Products
SentimenTrader Trading Tools
‍
Backtest Engine
My Trading Toolkit
Correlation Analysis
Seasonality
Market Prediction
Indicators & Data API
‍
Proprietary Indicators & Charts
Market Data API
Strategies & Scanner
‍
50+ Trading Strategies
Smart Stock Scanner
Smart Option Scanner
Research Reports
‍
Research Solutions
Reports Library
Free Resources
Simple Backtest Calculator
Simple Seasonality Calculator
The Kelly Criterion Calculator
Sentiment Geo Map
Public Research Reports
Education
Sentiment Indicators
Technical Indicators
Pricing
Company
About
In the News
Testimonials
Client Success Stories
Contact
Log inLoginSign up
< BACK TO ALL REPORTS

When the Baa corporate bond yield does this, pay attention

Dean Christians
2022-07-05
A new signal from a voting member in the TCTM Recession Composite Model registered an alert with the June update. The model measures a breakout in corporate bond yields. History suggests a potential recession and an unfavorable outlook for stocks.

Key points:

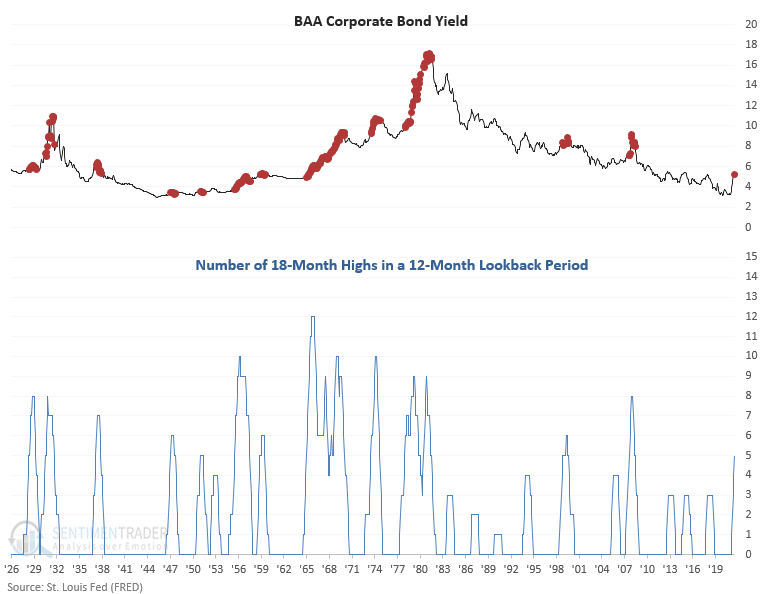
  • The Baa corporate bond yield has closed at an 18-month high in 5 out of the last 12 months
  • The increase in the cost of capital triggered a new alert for a component in the TCTM recession composite
  • History suggests a potential recession looks more likely 
  • After similar signals, the S&P 500 shows negative returns on a medium and long-term basis

Baa corporate bond yields as a recession and stock market signal

A new signal from a voting member in the TCTM Recession Composite Model registered an alert with the June update. The model identifies when the Baa corporate bond yield closes at an 18-month high in 5 out of the last 12 months. 

With the new signal, the TCTM recession composite count as a percentage of components increased to 25%.

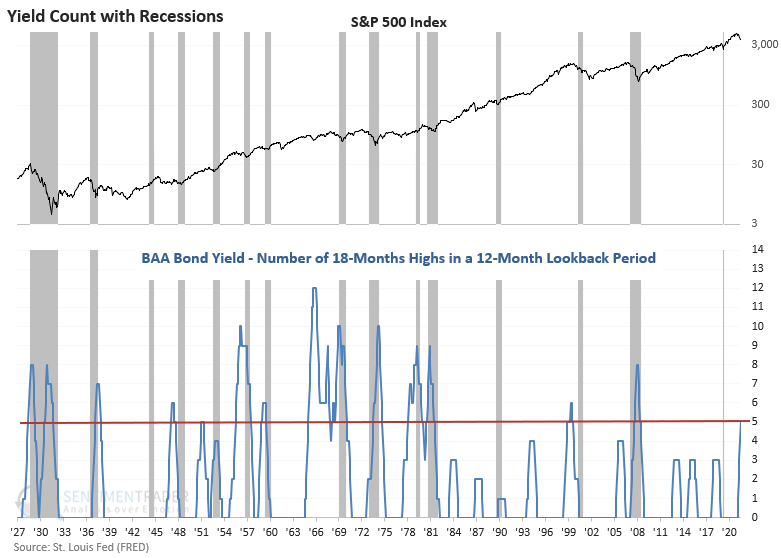
A consistent monthly increase in corporate bond yields above an 18-month high has been rare since the peak in rates in the early 1980s. The last two instances occurred before or during significant recessionary bear markets in 2000-02 and 2007-08.

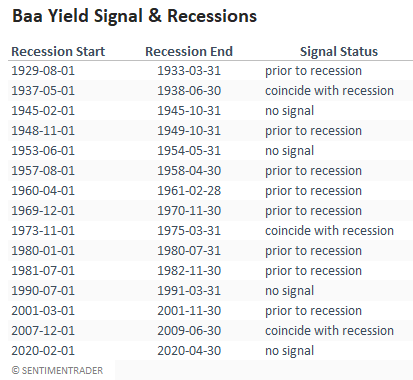
The Baa bond yield signal has triggered before or during a recession in 11 out of 15 instances since 1929. Most alerts occur before a recession.

With the S&P 500 and other indexes in a bear market, monitoring the economy for signs of a recession is imperative. Bear markets accompanied by a recession typically experience more significant drawdowns.

Similar surges in corporate bond yields preceded negative returns for stocks

This model generated a signal 13 other times over the past 93 years. After the others, S&P 500 future returns, win rates, and risk/reward profiles were unfavorable across medium and long-term time frames. Returns were negative at some point in the first 6 months in 11 out of 13 instances. The 1999 signal was a bit early. However, we all know what happened after that one.

The TCTM recession composite increased to 25% with the Baa signal. While some components like economic sentiment are approaching levels that would trigger an alert, others, like my jobless claims model, are not in a position to fire a signal.

What the research tells us...

When the BAA corporate bond yield closes at an 18-month high in 5 out of the last 12 months, the increase in the cost of capital weighs on economic activity and stock prices. Similar setups to what we're seeing now have preceded most recessions and weak returns for the S&P 500 across medium and long-term time frames. 

PRODUCTS
SentimenTrader
Trading Tools
Indicators & Data API
‍
Strategies & Scanner
‍
Research Reports
FREE
RESOUrCES
Simple Backtest
Calculator
Simple Seasonality
Calculator
The Kelly Criterion
Calculator
Sentiment Geo Map
‍
Public Research Reports
‍
Education
Sentiment Indicators
‍
Technical Indicators
‍
Pricing
Bundle pricing
‍
FAQ
‍
Announcements
‍
COMPANY
‍
About
‍
In the News
‍
Testimonials
‍
Client Success Stories
CONTACT
‍
General Inquiries
‍
Media Inquiries
‍
Financial Professionals Inquiries
‍
© 2026 Sundial Capital Research Inc. All rights reserved.
Setsail Marketing
TermsPrivacyAffiliate Program
Risk Disclosure: The information and tools provided are for research and analytical purposes only and are not intended as investment advice. Market analysis involves uncertainty, and outcomes may differ from expectations. Users should conduct their own due diligence and consider their individual circumstances before making any financial decisions. Past performance is not necessarily indicative of future results.

Hypothetical Performance Disclosure: Hypothetical performance results have many inherent limitations, some of which are described below. No representation is being made that any account will or is likely to achieve profits or losses similar to those shown; in fact, there are frequently sharp differences between hypothetical performance results and the actual results subsequently achieved by any particular trading program. One of the limitations of hypothetical performance results is that they are generally prepared with the benefit of hindsight. In addition, hypothetical trading does not involve financial risk, and no hypothetical trading record can completely account for the impact of financial risk of actual trading. for example, the ability to withstand losses or to adhere to a particular trading program in spite of trading losses are material points which can also adversely affect actual trading results. There are numerous other factors related to the markets in general or to the implementation of any specific trading program which cannot be fully accounted for in the preparation of hypothetical performance results and all which can adversely affect trading results.

Testimonial Disclosure: Testimonials appearing on this website may not be representative of other clients or customers and is not a guarantee of future performance or success.