When strong is too strong

In recent weeks, we've pointed out a number of warning signs related to record-high optimism, bordering on euphoria, with investors moving into the most leveraged and speculative parts of the market.
And yet, the type of internal deterioration we often see following similar readings has not yet happened, either broadly among stocks or leading markets like high-yield bonds.
The ever-cheerful service ZeroHedge published another warning on Wednesday, suggesting that this type of strength may be the source of its own undoing.
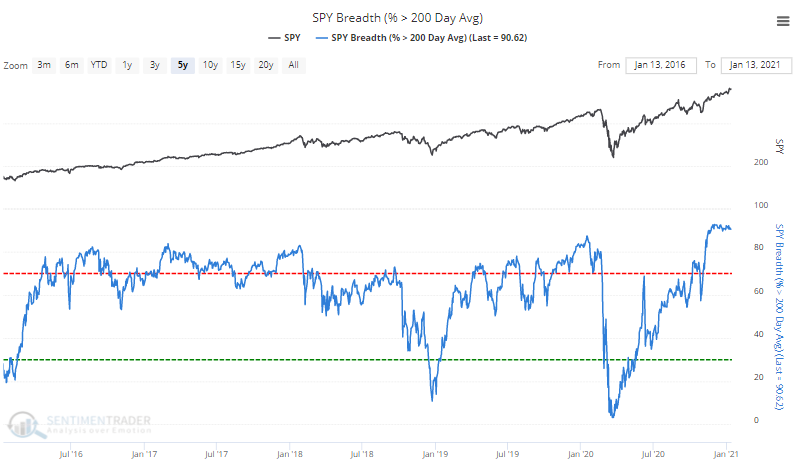
Morgan Stanley's Mike Wilson...points out that 92% of the stocks in the S&P 500 (extremely strong breadth) are currently sitting above their 200-day moving averages. As Wilson ominously points out, "historically, this metric tends to have difficulty moving above these levels (98th percentile over the last 30 years)" and If history holds, Morgan Stanley expects this metric to turn lower, "which can happen via price corrections or moving averages rising as prices stall."
Because according to [Bank of America's] Michael Wilson's backtest of forward returns after the % of S&P 500 stocks above 200-day moving averages reaching current levels or higher, forward returns on a 5-day, 1-month, and 3-month basis all tend to be lower than in other periods and in each case with high statistical significance.
This is, indeed, one of the strongest readings in years. In decades, even. Going back to 1927, it's one of the top readings ever.
So far, when we've looked at super-strong breadth readings, they have shown a modest tendency to precede short-term weakness, or at best tepid returns, but medium- to long-term results were skewed to the upside, with egregiously positive ratios of reward to risk.
In this case, context matters a lot, with a big difference in forward returns depending on where the S&P 500 index itself is trading.
What else we're looking at
- What happens when more than 92% of stocks are above their 200-day average, depending on where the S&P is trading
- A look at the price path going forward after the most similar cases
- When markets form an outside up month, future returns were rosy
- The impact of jobless claims miss on stocks and yields
- What happens when IWM is up so much and QQQ is...not
For immediate access to all the research with no obligation, sign up for a 30-day free trial
| Stat Box Thanks in part to an explosion of (and in) SPACs, there was a jump in 52-week highs on the Nasdaq exchange on Thursday. More than 15% of securities traded there ticked at a new high, ranking as the 16th most of any day since 1984. |
Sentiment from other perspectives
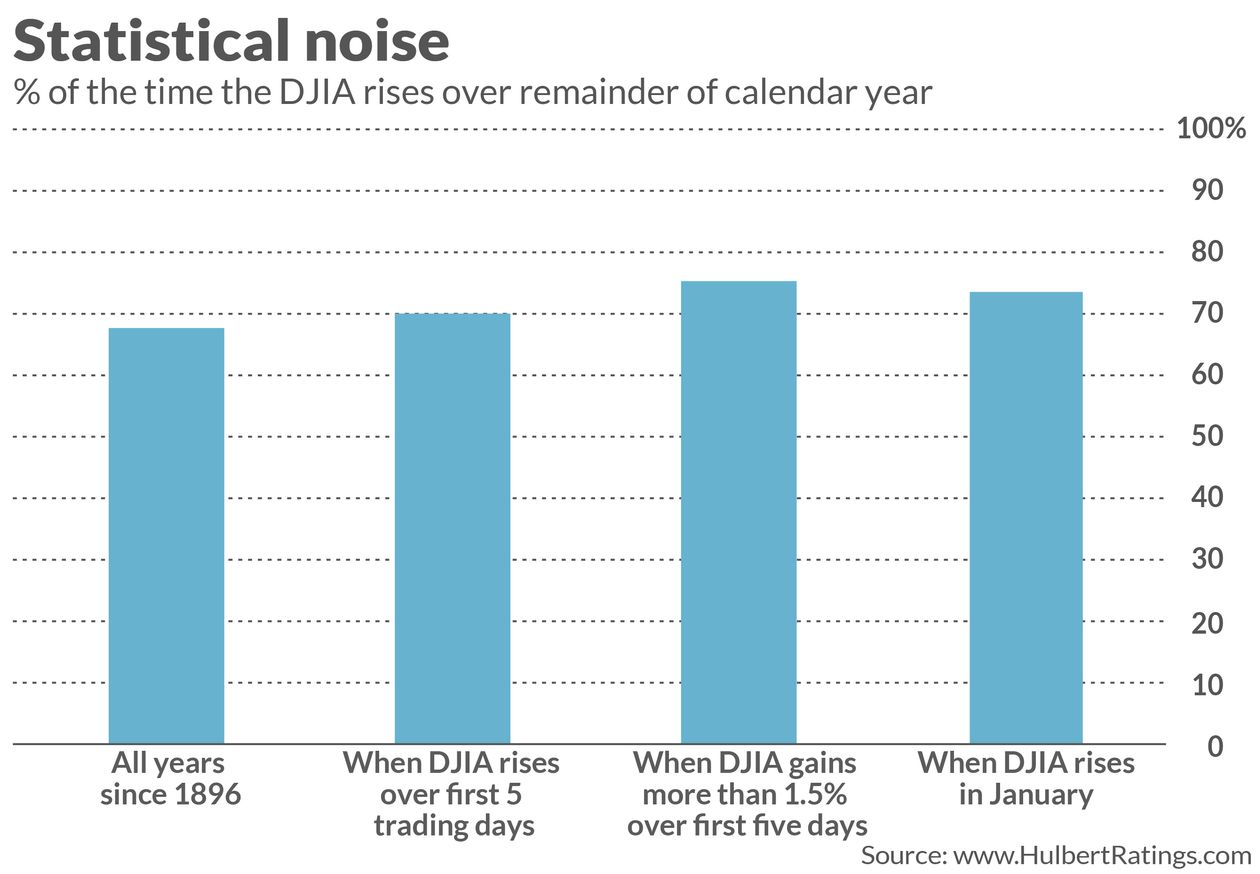
This effect gets (and deserves) an annual debunking - the first week of January is not a good reason to suddenly become optimistic about the rest of the year. Source: Marketwatch
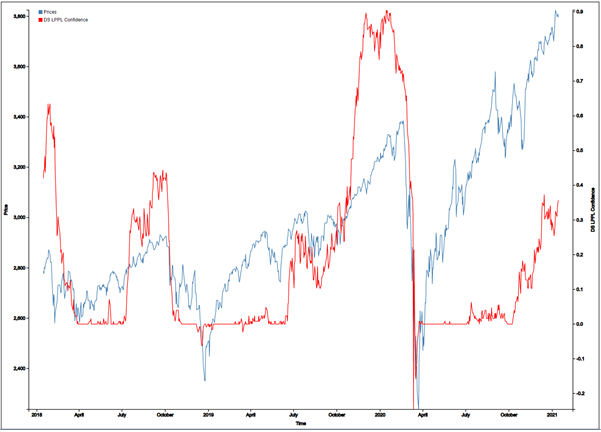
Even though a rise in January might not be the panacea bulls would like, it has increased the probability that the S&P 500 is in the beginning stages of forming a long-term bubble. Source: Financial Crisis Observatory
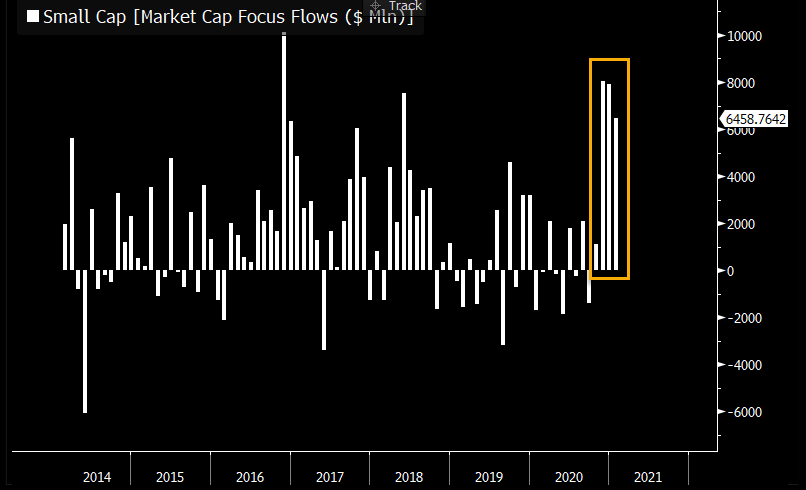
Traders see no bubble risk, as they continue to pile into small-cap funds. For the first time in more than 6 years, small-cap funds have taken in more than $6 billion a week for 3 consecutive months. Source: Bloomberg via Athanasios Psarofagis