
When NOT to own Bitcoin

Key Points
- Bitcoin (BTC) is the most well-known cryptocurrency and has been trading since 2010
- Grayscale Bitcoin Trust (GBTC) is solely and passively invested in BTC, enabling investors to gain exposure to BTC in the form of a security while avoiding the challenges of buying, storing, and safekeeping BTC, directly
- Certain days of the month have consistently seen poor price behavior
- In addition, certain months have typically shown below-average results
First the caveats
Caveat #1: I have never traded Bitcoin - or any cryptocurrency, for that matter. In fact, I am completely agnostic on the topic. On the one hand, I am of that demographic that wants to mutter "it's a bubble" in a gravely voice with a disdained look on my face. On the other hand, the fact that in its brief trading history (roughly twelve years), Bitcoin has already experienced four separate 80%+ drawdowns makes me think that maybe "there is something there." Allow me to explain.
Typically, when something is a "bubble," it enjoys its day in the sun, the bubble bursts, and then that thing either goes away entirely or collapses into a heap and limps along sideways at best for years to come. Bitcoin (so far) just keeps getting up off the canvas and coming back for more.
Typically things that are bubbles don't keep doing that. This makes me wonder if maybe there isn't something "there."
Caveat #2: The analysis below is based on after-the-fact analysis with the benefit of hindsight. I have been tracking it in real-time for less than a year and a half. So, if you want to categorize it as "data mining," there is probably not much I can do to refute that charge. Despite that, I still think you may find the results compelling.
The data
- I used Bitcoin price data that goes back to 2010 and price data for the Grayscale Bitcoin Trust that goes back to 2015 from Bloomberg. For part of its history, Bitcoin has traded Monday through Friday. Then Saturdays were added, and now Bitcoin is traded seven days a week
- Grayscale Bitcoin Trust is traded OTC, so it trades Monday through Friday on those days when the market is open
- Since Bitcoin now trades 24 hours, seven days a week, certain trading assumptions must be made. For example, the Open price generally refers to the price at 12:01 AM UTC of any given day, and the close generally refers to the price at 11:59 PM UTC of any given day
- Grayscale Bitcoin Trust trades from 9:30 EST to 4:00 EST
- For testing purposes, I used "Calendar Day of Month" exclusively. In other words, I looked at how these vehicles performed on the first day of the month, the second day of the month, and so on, through the 31st day of the month
Backtesting took place from the start of each data set through April 2021. I have been following the results in real-time since May 2021. I have not traded either Bitcoin or GBTC.
For better or worse, here is what I found.
When NOT to own Bitcoin
First, a reminder: We will be looking at all "Calendar Days of the Month" and NOT "trading days of the month."
Let's start at the end:
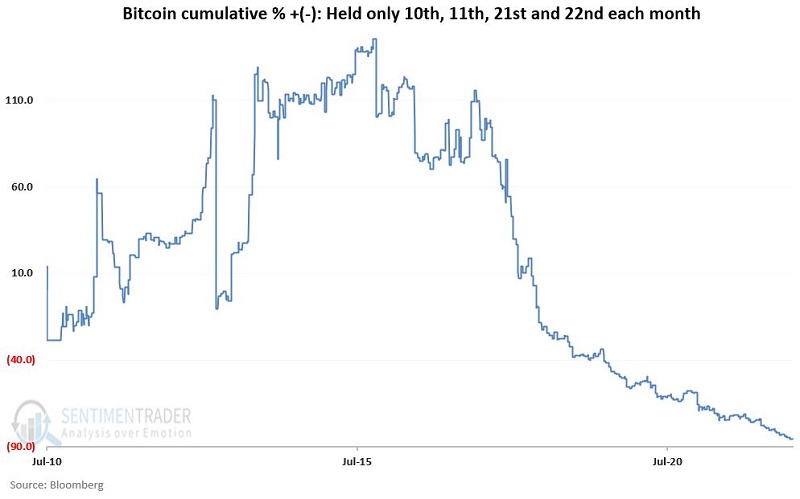
- The days to avoid are the 10th, 11th, 21st, and 22nd of the month
The chart below displays the cumulative % +(-) for an investment in Bitcoin if held only during these four days every month since July 2010.
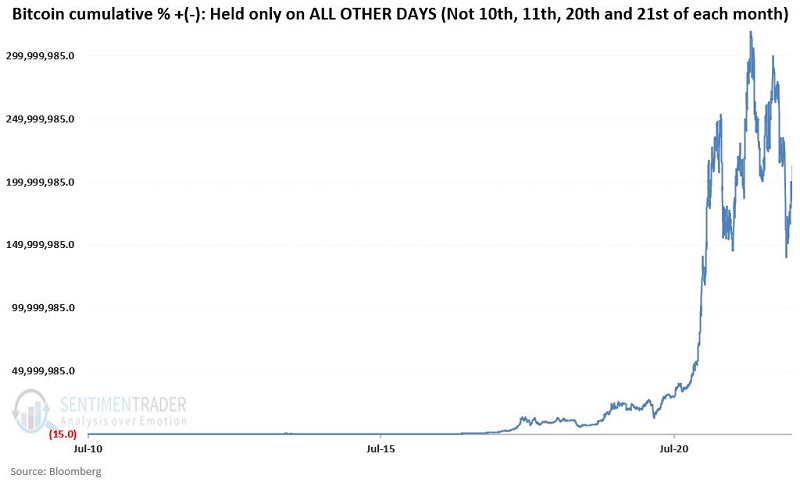
The chart below displays the cumulative % +(-) for an investment in Bitcoin if held during ALL OTHER days of the month since July 2010.
To make the data more meaningful, the chart below displays the same data as the chart above but shows it as the growth of a $1 investment on a logarithmic scale.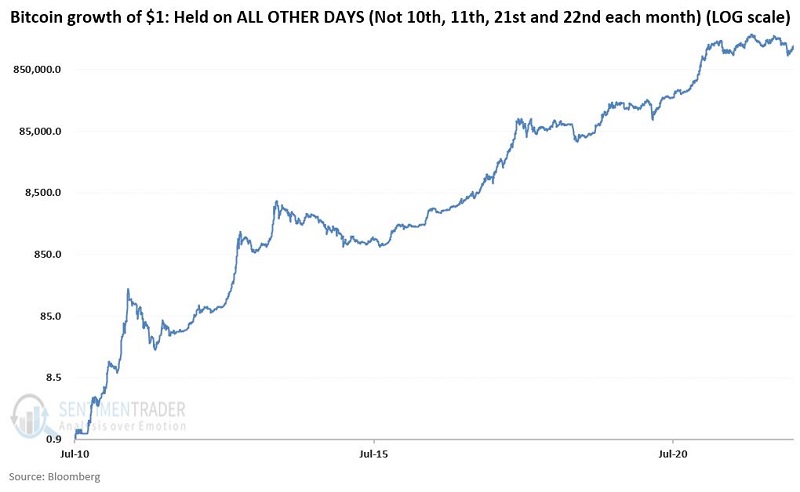
Don't let the 300 million % return put stars in your eyes. The results above are generated with the benefit of hindsight (through April 2021), AND the maximum drawdown during the so-called "favorable periods" (i.e., all days of the month that are NOT the 10th, 11th, 21st, or 22nd) was -89.8%. There is no "easy money" here. The real point is the relentless declines in the first chart since about the middle of 2015. The maximum drawdown since the peak in 2015 is a staggering -94.2%.
Moving over to GBTC
GBTC started trading in May 2015. Once again, we will look at "Calendar days of the Month" and NOT "trading days of the month."
Note:
- The days to avoid are the 10th, 11th, 21st, and 22nd of the month.
The chart below displays the cumulative % +(-) for an investment in GBTC if held only during these four days every month since May 2015.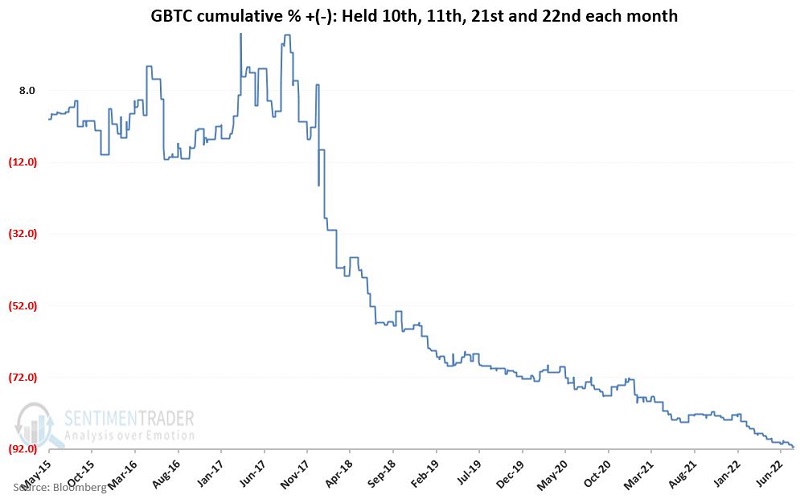
The chart below displays the cumulative % +(-) for GBTC if held during ALL OTHER days of the month since July 2010.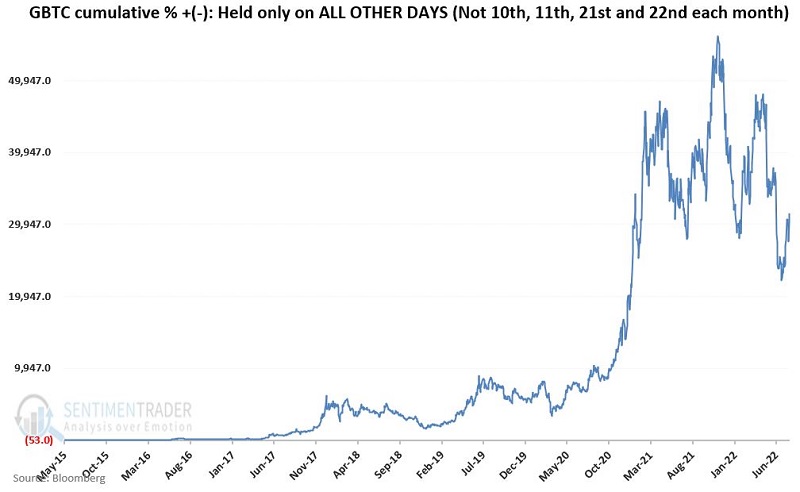
To make the data more meaningful, the chart below displays the same data as the chart above but shows it as the growth of a $1 investment on a logarithmic scale.
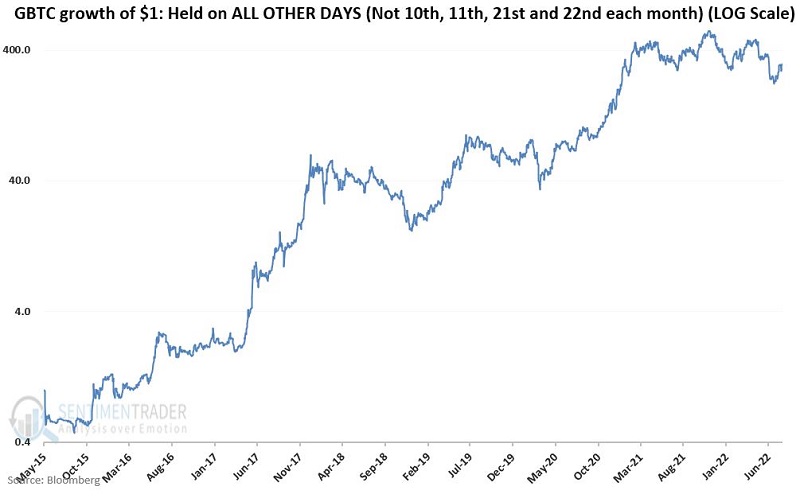
The bottom line is significant cumulative gains, large drawdowns, and long periods of sideways action.
Monthly
Now let's break things down on a month-by-month basis and look at performance on calendar days of month 10, 11, 21, and 22 each month. The table below displays the cumulative % gain/loss for Bitcoin each month during days of month 10, 11, 21, and 22 versus "all other days of the month" from 2010 until late July 2022.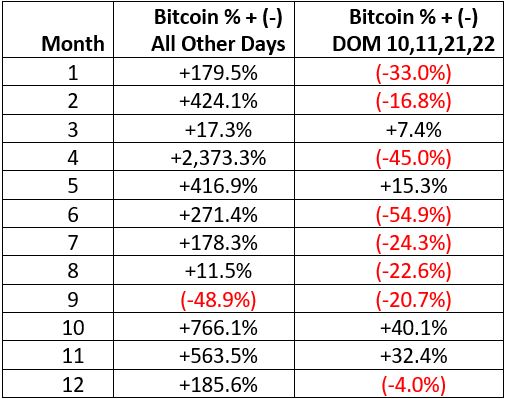
The table below displays the cumulative % gain/loss for GBTC each month during days of month 10, 11, 21, and 22 versus "all other days of the month" from 2015 until late July 2022.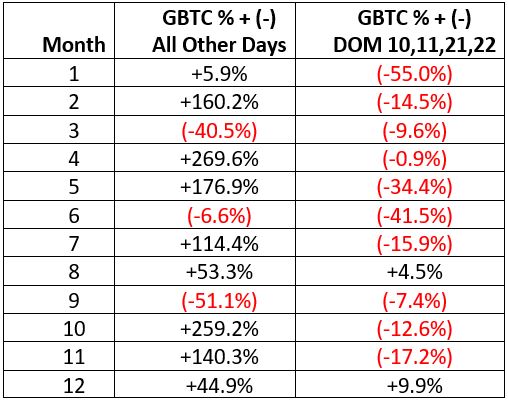
To date, it is fair to say that:
- Bitcoin and GBTC have performed much more poorly during days of month #'s 10, 11, 21 and 22
- For "All Other Days," months 3, 6, 9, and 12 have been relatively weak months for both Bitcoin and GBTC
A trading strategy
To carry this thought experiment to the end, let's conduct the following simulation (pointing out once again that the results are achieved with the benefit of hindsight and that only the last roughly year and a quarter are based on out-of-sample data):
- During March, June, September, and December, we will remain flat with no position in GBTC (for this test, no interest is earned while out of GBTC)
- During all other months, we will hold GBTC during all days of the month EXCEPT calendar days of month 10, 11, 21 and 22
For example, the table below displays the positions held during late July, August, and early September (technically, September will be in cash for the entire month).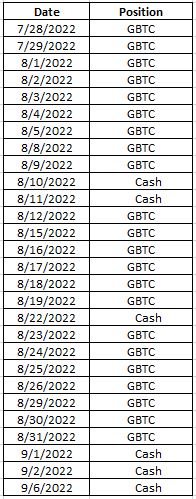
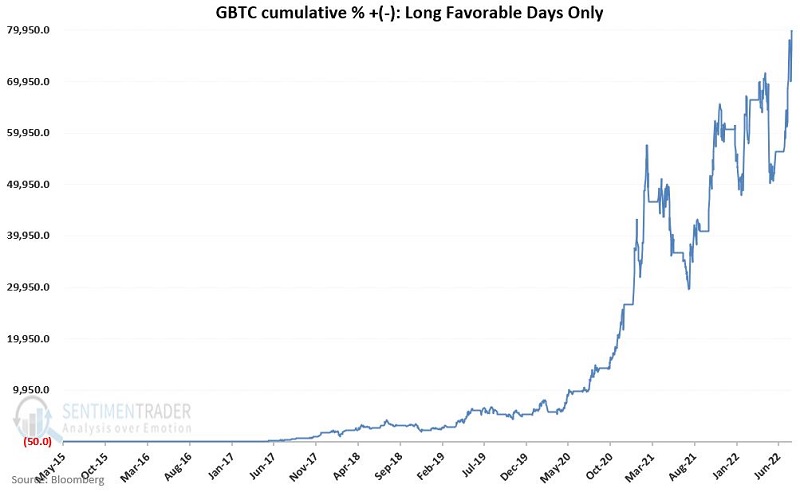
The chart below shows the hypothetical cumulative % gain from holding GBTC using the rules above.
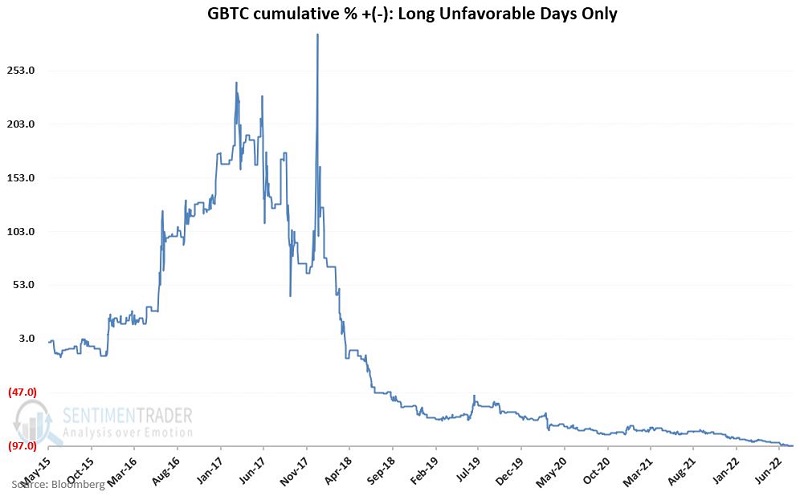
The chart below displays the hypothetical cumulative % loss from holding GBTC only during all unfavorable days according to the rules above.
The chart below displays a logarithmic scale chart of the hypothetical growth achieved during favorable days divided by the hypothetical growth achieved during unfavorable days (i.e., all of March, June, September, and December plus days of month 10, 11, 21, and 22).
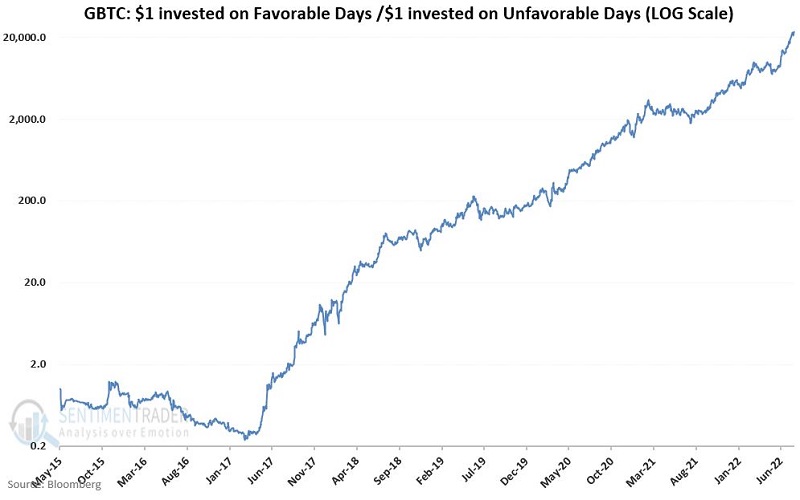
The good news is that since mid-2017, favorable days have vastly and consistently outperformed unfavorable days. The bad news is favorable days have nevertheless experienced some extremely volatile action.
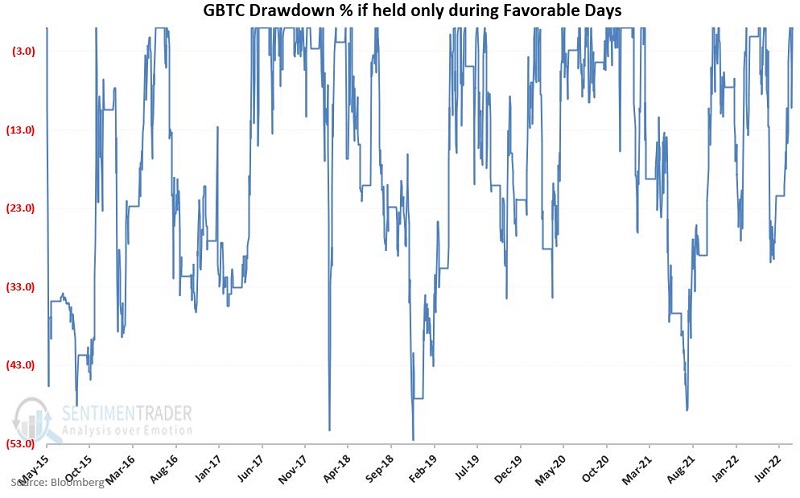
One dose of reality: Large drawdowns are the norm even during the so-called "Favorable" periods. The chart below displays the % drawdowns experienced holding GBTC only during the favorable periods since 2015. There is nothing even remotely "low risk" about this strategy. In seven years, there have been four separate drawdowns in excess of -40%. You have been warned.
What the research tells us…
Is this all simply an exercise in data mining? One can make a reasonable argument that it is. Does any of this amount to a viable strategy on which a trader might consider risking money? That is certainly open for debate. One last thought: On December 18, 2017, GBTC spiked +28%. Since then, it has declined -by 61%. The hypothetical breakdown:
- Favorable Days: +4,365%
- Unfavorable Days: (-99.1%)
Does any of this amount to a viable strategy: That's your call. I'm still trying to decide.
Is there maybe something there? Could be.