Data &
Technology
Research
Reports
Report Solutions
Reports Library
Actionable
Strategies
Free
Resources
Simple Backtest Calculator
Simple Seasonality Calculator
The Kelly Criterion Calculator
Sentiment Geo Map
Public Research Reports
Free Webinar
Pricing
Company
About
Meet Our Team
In the News
Testimonials
Client Success Stories
Contact
Log inLoginSign up
< BACK TO ALL REPORTS

When Gold Meets Japan (Part I)

Jay Kaeppel
2021-05-07
If you are looking for an edge in the markets, it can pay to look at relationships that most investors do not consider. In this two-part series, we examine the Japanese markets relative to gold bullion to see if we can find an edge in the process (HINT: We did).

Some relationships are fairly obvious, and others are not. Not many people think much about the relationship between gold and the Japanese stock market and/or the Japanese Yen. The chart below (courtesy of AIQ TradingExpert) displays ticker FXY (Invesco CurrencyShares Japanese Yen Trust) and ticker GLD (SPDR Gold Shares). 

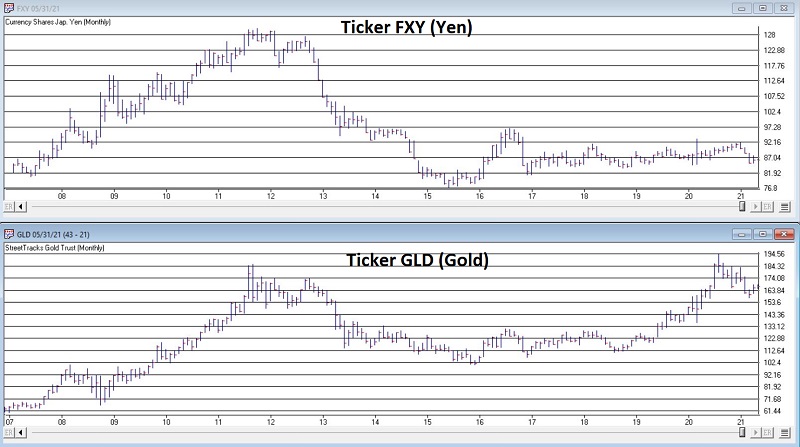
A simple glance at the two charts reveals a clear degree of correlation between the Japanese Yen and Gold. In Part I, we will discuss one way to use a gold indicator to help identify the trend of the Japanese stock market.

GOLD RISK LEVELS

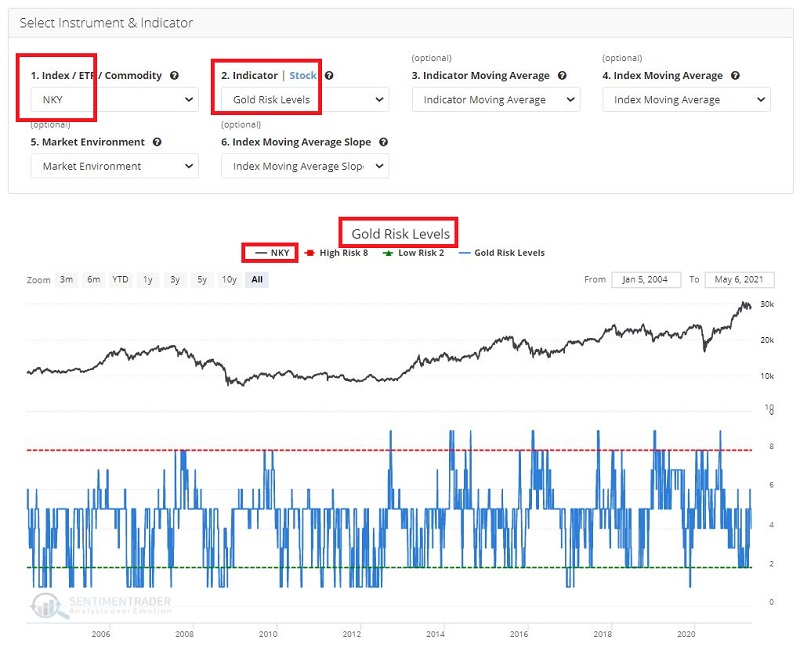
Gold Risk Levels is an indicator available on SentimenTrader.

Clicking this link will load the following test into the Backtest Engine:

  • Index = NKY (Nikkei Index)
  • Indicator = Gold Risk Levels
  • Looking for the Indicator to cross below 8 (Technical Note: This tests for a drop from above 8 to a value 8 or below)
  • For the first time in the past 60 days

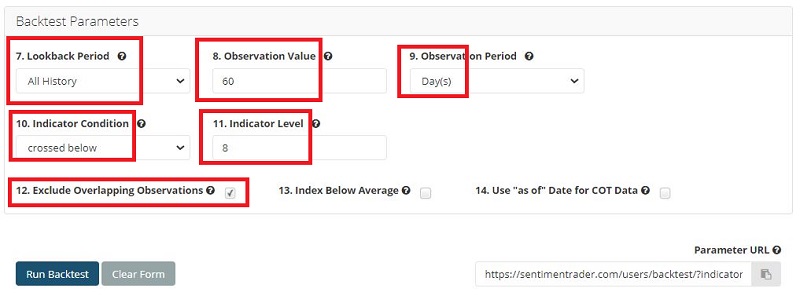
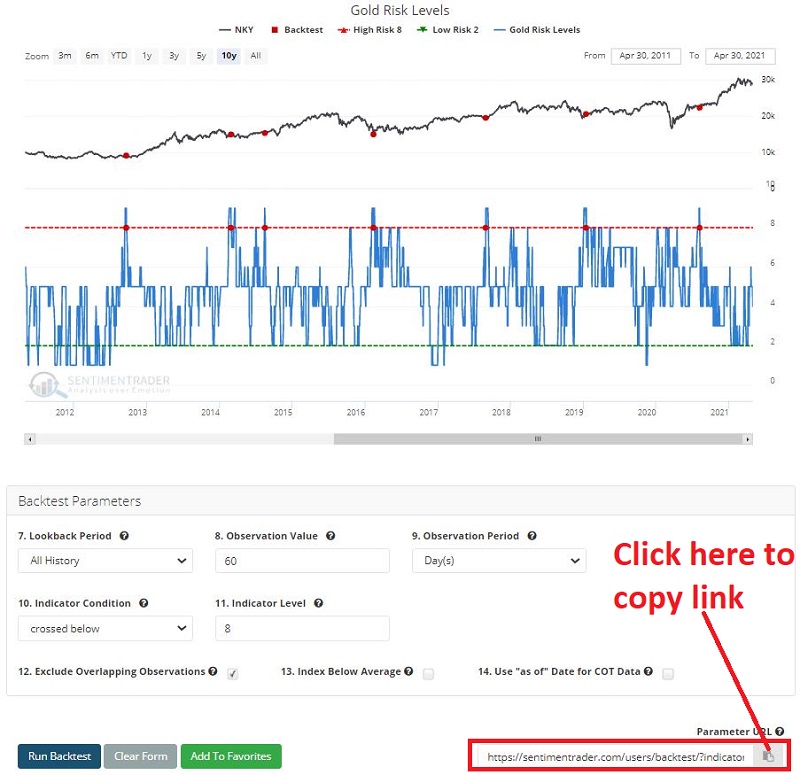
Clicking "Run Backtest" will launch the test and analyze the Nikkei Index's performance in the 1 to 12 months following a reading by the Gold Risk Levels Indicator that drops from above 8 to 8 or below for the first time in 60 days.

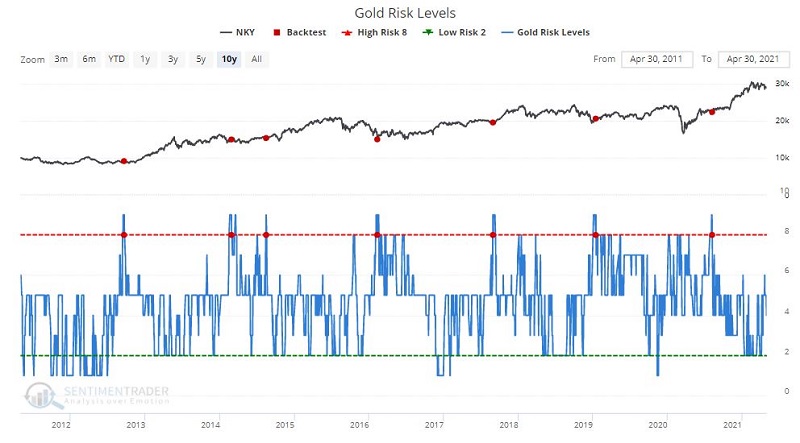
The chart below displays the handful of signals - all of which occurred within the last 10 years - using a red dot.

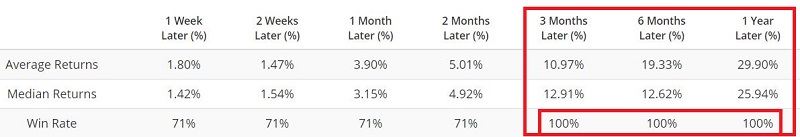
The table below displays the Summary of Nikkei Index performance results. Note the particularly favorable Average and Median Returns and Win Rates for the 3-month, 6-month, and 1-year periods.

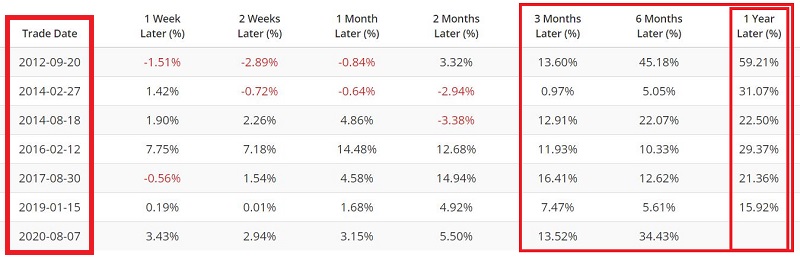
The table below shows that signals were generated in 6 separate years and highlights the favorable 3-month, 6-month, and 12-month return for the Nikkei Index following each signal.

THE BOTTOM LINE

A reversal in Gold Risk Levels from a high level strongly suggests potentially favorable price action in the year ahead for the Nikkei Index.

SAVING THIS TEST FOR FUTURE USE

In a candor, this is not the most timely series of articles I will ever write.  So we may want to save this test for future use when it is more relevant.

To save this test for future reuse:

  • Click "Add to Favorites"
  • Type in a descriptive test name (such as "Nikkei Index versus Gold Risk Levels cross below 8")
  • Click "Save Favorite"

These steps will add this particular scan to your list of Favorites. Anytime you enter Backtest Engine, your Favorites will be listed at the bottom as per below.

Another alternative would be to:

  • Click the file folder icon to the far right below the words "Parameter URL"

This will copy the entire test link to your clipboard. You can then paste the link itself into a document or spreadsheet and save it for future use.

In Part II, we will look at Gold Risk Levels versus the Japanese Yen.

DATA &
TECHnologies
IndicatorEdge
‍
BackTestEdge
‍
Other Tools
‍
DataEdge API
RESEARCH
reports
Research Solution
‍
Reports Library
‍
actionable
Strategies
Trading Strategies
‍
Smart Stock Scanner
‍
FREE
RESOUrCES
Simple Backtest
Calculator
Simple Seasonality
Calculator
The Kelly Criterion
Calculator
Sentiment Geo Map
‍
Public Research Reports
‍
Free Webinar
COMPANY
‍
About
‍
Meet our Team
‍
In the News
‍
Testimonials
‍
Client Success Stories
Pricing
Bundle pricing
‍
Announcements
‍
FAQ
© 2024 Sundial Capital Research Inc. All rights reserved.
Setsail Marketing
TermsPrivacyAffiliate Program
Risk Disclosure: Futures and forex trading contains substantial risk and is not for every investor. An investor could potentially lose all or more than the initial investment. Risk capital is money that can be lost without jeopardizing ones’ financial security or life style. Only risk capital should be used for trading and only those with sufficient risk capital should consider trading. Past performance is not necessarily indicative of future results.

Hypothetical Performance Disclosure: Hypothetical performance results have many inherent limitations, some of which are described below. No representation is being made that any account will or is likely to achieve profits or losses similar to those shown; in fact, there are frequently sharp differences between hypothetical performance results and the actual results subsequently achieved by any particular trading program. One of the limitations of hypothetical performance results is that they are generally prepared with the benefit of hindsight. In addition, hypothetical trading does not involve financial risk, and no hypothetical trading record can completely account for the impact of financial risk of actual trading. for example, the ability to withstand losses or to adhere to a particular trading program in spite of trading losses are material points which can also adversely affect actual trading results. There are numerous other factors related to the markets in general or to the implementation of any specific trading program which cannot be fully accounted for in the preparation of hypothetical performance results and all which can adversely affect trading results.

Testimonial Disclosure: Testimonials appearing on this website may not be representative of other clients or customers and is not a guarantee of future performance or success.