Data &
Technology
Research
Reports
Report Solutions
Reports Library
Actionable
Strategies
Free
Resources
Simple Backtest Calculator
Simple Seasonality Calculator
The Kelly Criterion Calculator
Sentiment Geo Map
Public Research Reports
Free Webinar
Pricing
Company
About
Meet Our Team
In the News
Testimonials
Client Success Stories
Contact
Log inLoginSign up
< BACK TO ALL REPORTS

When Energy Stocks Did This, They Rebounded Every Time

Jason Goepfert
2021-07-19
Late last week, more than 80% of energy stocks fell to their lowest price in a month.

Energy stocks are weak, and there has been a surge in them falling to their lowest prices in a month.

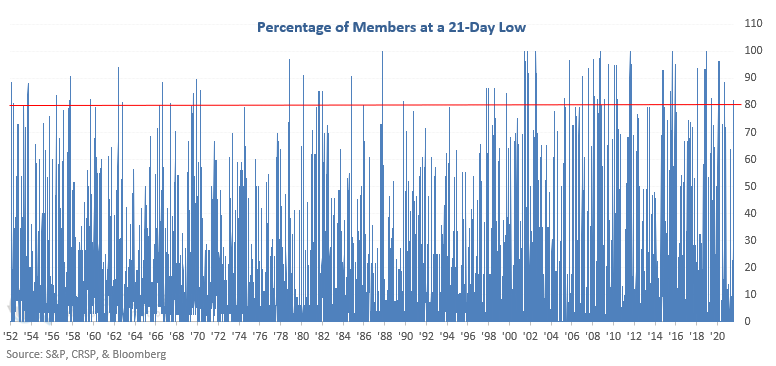
Last week, Dean shared a trading signal for the S&P 1500 Oil & Gas Exploration & Production sub-industry that suggested a cautious short-term outlook for the group. The energy sector weakened considerably on the day, enough so that 82% of energy stocks fell to at least a 1-month low, the most since last September.

Percentage of energy stocks at 1 month low

As much as possible, we like to look at indicators in different contexts. Signals in healthy environments tend to act much differently than those in unhealthy ones.

So, Dean looked at future returns in the S&P 500 Energy sector after a surge in those stocks falling to 1-month lows, but only when it triggered within about a month of the sector being at a 1-year high.

Energy stocks at 1 month low

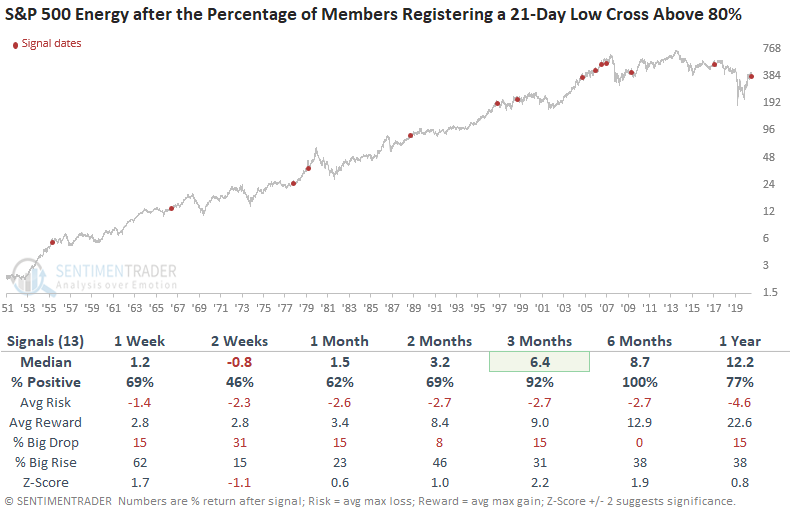
The sector often wobbled in the short-term, but it had a consistent tendency to rebound over the next few months. By six months later, it was higher every time.


What else we're looking at

  • Full returns in the energy sector after similar surges in 1-month lows
  • Different views of this surge in new lows and their impact on future returns
  • A look at the stamped into tech stocks, especially at this certain seasonal time of the year

Stat box

On Friday, there were 50 more stocks at 52-week lows than 52-week highs on the Nasdaq. That was the 3rd straight session, within a week or so of the Nasdaq Composite trading at record highs. That triggered a Titanic Syndrome warning for each of those days.

Etcetera

Record low participation. As the S&P 500 has been clustering at record highs, it's been doing so with fewer than 60% of its stocks trading above their 50-day moving averages. The latest Market Minute takes a look at what happened after similar signals.

youtube video participation

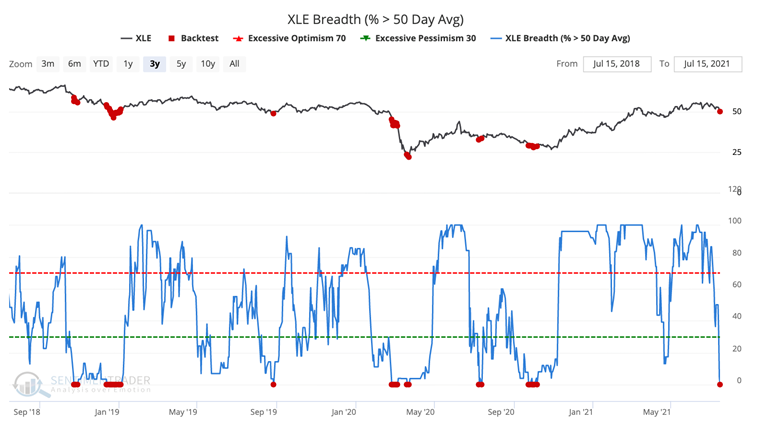
Energy savings. Every energy stock is trading below its 50-day moving average, yet the XLE fund is still above its rising 200-day moving average. According to our Backtest Engine, similar setups preceded a rebound in XLE over the next month after 13 out of 15 signals.

energy stocks xle above 50 day moving average

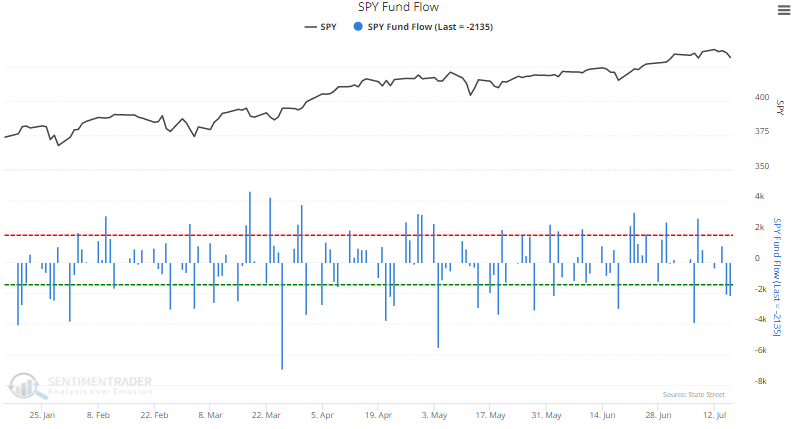
Leaving the casino. Traders pulled more than $2 billion out of the largest ETF in the world on Friday. Over the past year, SPY has lost more than $2 billion in a single day 37 times. Over the next two weeks, it rallied after 32 of those. If it doesn't this time, it will suggest something has changed in the environment.

spy fund flow

DATA &
TECHnologies
IndicatorEdge
‍
BackTestEdge
‍
Other Tools
‍
DataEdge API
RESEARCH
reports
Research Solution
‍
Reports Library
‍
actionable
Strategies
Trading Strategies
‍
Smart Stock Scanner
‍
FREE
RESOUrCES
Simple Backtest
Calculator
Simple Seasonality
Calculator
The Kelly Criterion
Calculator
Sentiment Geo Map
‍
Public Research Reports
‍
Free Webinar
COMPANY
‍
About
‍
Meet our Team
‍
In the News
‍
Testimonials
‍
Client Success Stories
Pricing
Bundle pricing
‍
Announcements
‍
FAQ
© 2024 Sundial Capital Research Inc. All rights reserved.
Setsail Marketing
TermsPrivacyAffiliate Program
Risk Disclosure: Futures and forex trading contains substantial risk and is not for every investor. An investor could potentially lose all or more than the initial investment. Risk capital is money that can be lost without jeopardizing ones’ financial security or life style. Only risk capital should be used for trading and only those with sufficient risk capital should consider trading. Past performance is not necessarily indicative of future results.

Hypothetical Performance Disclosure: Hypothetical performance results have many inherent limitations, some of which are described below. No representation is being made that any account will or is likely to achieve profits or losses similar to those shown; in fact, there are frequently sharp differences between hypothetical performance results and the actual results subsequently achieved by any particular trading program. One of the limitations of hypothetical performance results is that they are generally prepared with the benefit of hindsight. In addition, hypothetical trading does not involve financial risk, and no hypothetical trading record can completely account for the impact of financial risk of actual trading. for example, the ability to withstand losses or to adhere to a particular trading program in spite of trading losses are material points which can also adversely affect actual trading results. There are numerous other factors related to the markets in general or to the implementation of any specific trading program which cannot be fully accounted for in the preparation of hypothetical performance results and all which can adversely affect trading results.

Testimonial Disclosure: Testimonials appearing on this website may not be representative of other clients or customers and is not a guarantee of future performance or success.