
When earnings meet inflation

Key Points
- Low inflation makes a dollar of earnings more valuable, and high inflation makes a dollar of earnings less valuable
- Both earnings and inflation fluctuate over time
- This relationship has recently reached a historic extreme
- This piece highlights what trends in this relationship matter most for stock investors
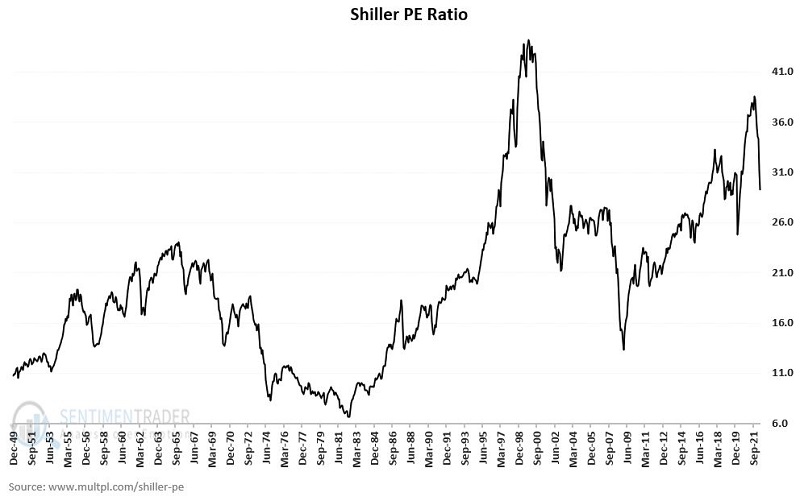
Price/Earnings Ratio
A P/E ratio is calculated by dividing a given price index by total earnings for the index stocks. For our purposes, I will use the Shiller PE Ratio based on average inflation-adjusted earnings from the previous ten years. See the chart below.
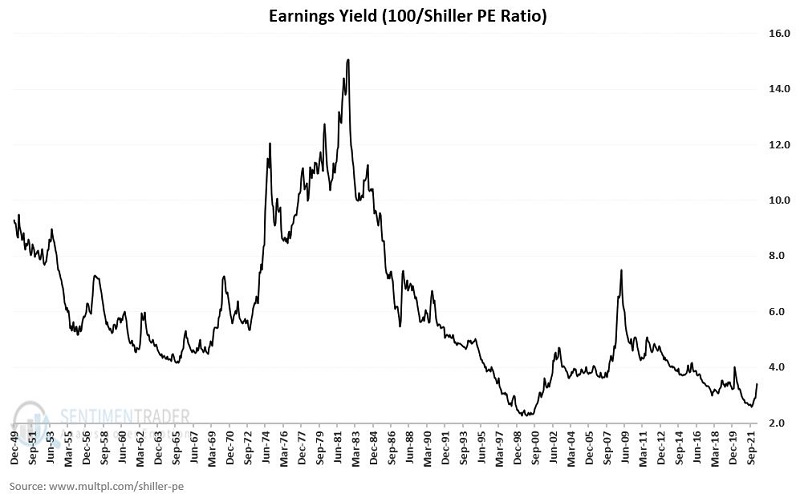
Earnings Yield
To calculate earnings yield, we divide 100 by the Shiller PE ratio. If the Shiller PE is 20, the earnings yield is 5 (100/20), and if the Shiller PE stands at 30, the earnings yield is 3.33 (100/30), and so on.
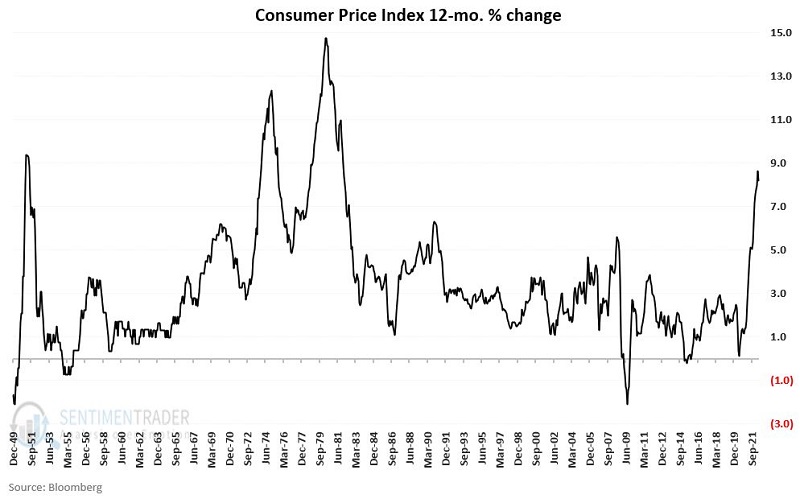
Inflation Rate
To arrive at the inflation rate, we divide the latest raw value for the Consumer Price Index by the raw value for the Consumer Price Index from 12 months ago, then subtract one and multiply by 100.
JK Earnings/Inflation Indicator
To arrive at the indicator, we do the following:
A = Shiller PE Ratio
B = (100/B)
C = CPI 12-month % change
D = (B - C)
JK Earnings/Inflation Indicator = D
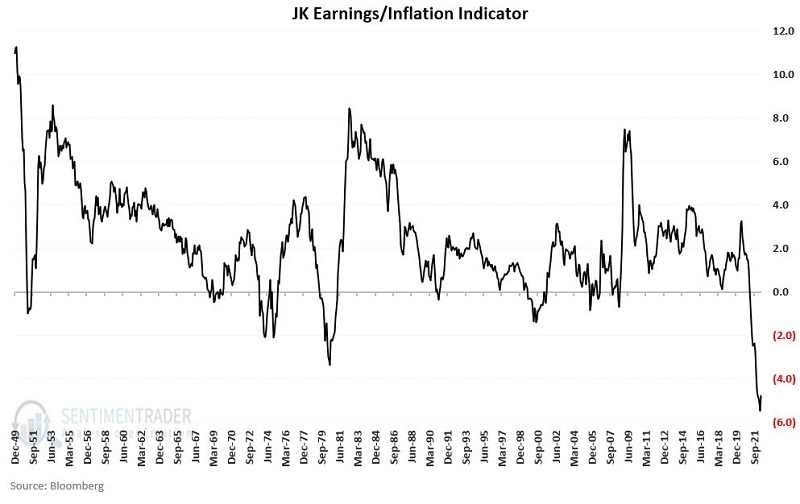
In other words, the indicator is nothing more than the earnings yield minus the inflation rate. Not exactly sophisticated or complex. But serious investors care more about results than the sophistication of the calculations.
Interpretation
- If JK Earnings/Inflation Indicator > 0 at month-end = Bullish for the next month
- If JK Earnings/Inflation Indicator < 0 at month-end = Bearish for next month
Results
For testing purposes, each variable's values and the indicator itself are updated on the last day of the month. If the indicator is positive at the end of a month, the stock market is deemed "bullish" for the next month, and if the indicator is negative at the end of the month, it is considered "bearish" for the next month.
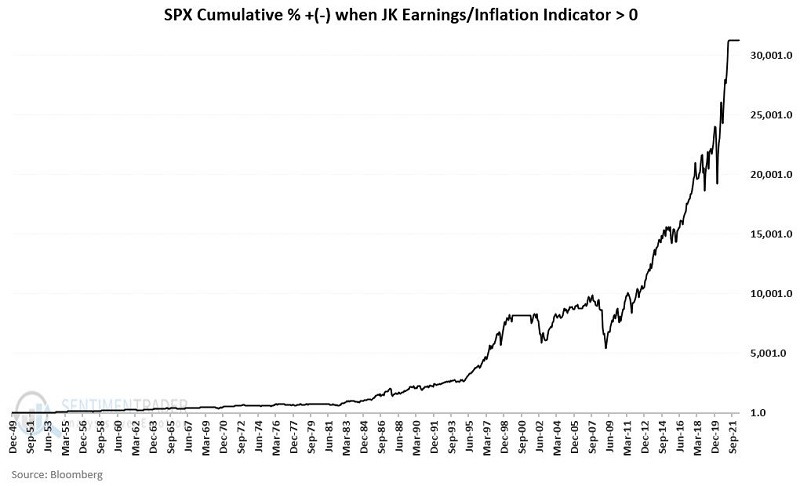
The chart below displays the cumulative growth for the S&P 500 Index held long only when the JK Earnings/Inflation Indicator is bullish. The cumulative hypothetical SPX % gain from January 1950 through May 2022 is +31,314%.
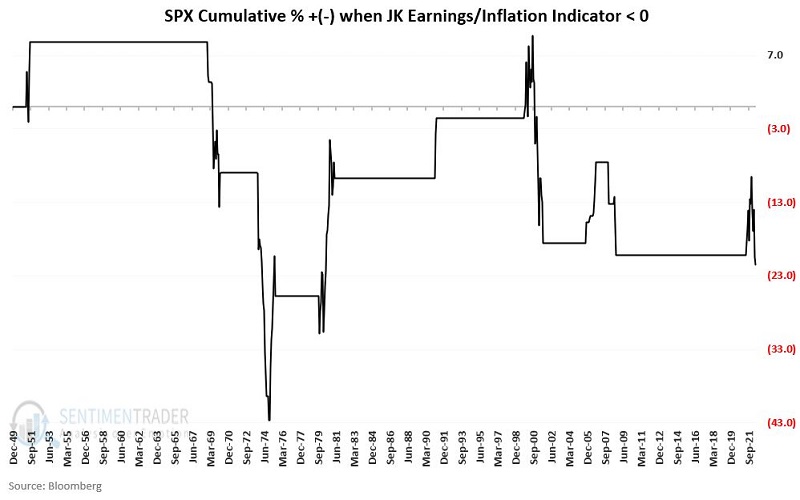
The chart below displays the cumulative growth for the S&P 500 Index held long only when the JK Earnings/Inflation Indicator is bearish. The cumulative hypothetical SPX % gain from January 1950 through May 2022 is -21.5%. The indicator is deemed bearish for June 2022.
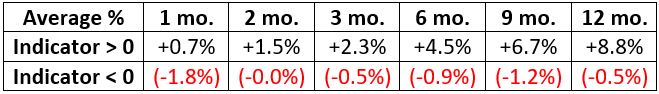
The table below displays the average one to twelve-month % +(-) for the S&P 500 Index depending on whether the current month-end reading for the JK Earnings/Inflation Indicator is above 0 (bullish) or below 0 (bearish).
The table below displays the one to twelve-month Win Rate (% times higher) for the S&P 500 Index depending on whether the current month-end reading for the JK Earnings/Inflation Indicator is above 0 (bullish) or below 0 (bearish).
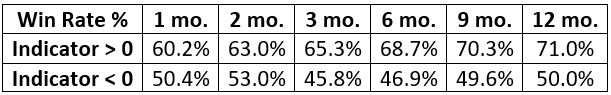
The key thing to note from the tables above is the consistency of outperformance for the S&P 500 Index following JK Earnings/Inflation indicator readings > 0.
Current Status
As of 5/31/2022, the calculations were as follows:
A = 29.28 (Shiller PE Ratio)
B = 3.42 (100/B)
C = 8.18% (CPI 12-month % change)
D = (-4.77) (B - C)
JK Earnings/Inflation Indicator = (-4.77)
As a result, the indicator is "Bearish" for June 2022.
Looking ahead to the end of June, IF the month ended today, the calculations would be:
A = 29.09 (Shiller PE Ratio - this will likely be different on 6/30)
B = 3.44 (100/B)
C = 8.54 (CPI 12-month % change)
D = (-5.10) (B - C)
JK Earnings/Inflation Indicator = (-5.10)
Barring a massive decline in the Shiller PE Ration between now and the end of June, this indicator will remain "Bearish" for July 2022.
What the research tells us…
The theory is that low valuation and low inflation are bullish for stocks and that high valuation and high inflation are bearish for stocks. The JK Earnings/Inflation indicator attempts to weigh these two factors in one indicator. The results shown above - and the consistency of the results - appear to show that the theory is correct.