Data &
Technology
Research
Reports
Report Solutions
Reports Library
Actionable
Strategies
Free
Resources
Simple Backtest Calculator
Simple Seasonality Calculator
The Kelly Criterion Calculator
Sentiment Geo Map
Public Research Reports
Free Webinar
Pricing
Company
About
Meet Our Team
In the News
Testimonials
Client Success Stories
Contact
Log inLoginSign up
< BACK TO ALL REPORTS

When Almost Every Stock Rises, This Happens

Jason Goepfert
2021-06-23
Monday's session saw one of the best breadth days ever, with more than 90% of S&P 500 stocks rising on the day.

With internal weakness that's been festering for a while, then a dip in most stocks to end last week, some sensitive breadth measures neared oversold territory. Monday's surge took care of much of that.

Traders get excited when there is a lopsided day in the markets. On Monday, it was all-aboard to the upside, with few stocks failing to rise. There have been more than 450 net advancing stocks within the S&P 500 only five other times in the past five years when SPY was above its 200-day moving average. 

S&P 500 advance decline best days

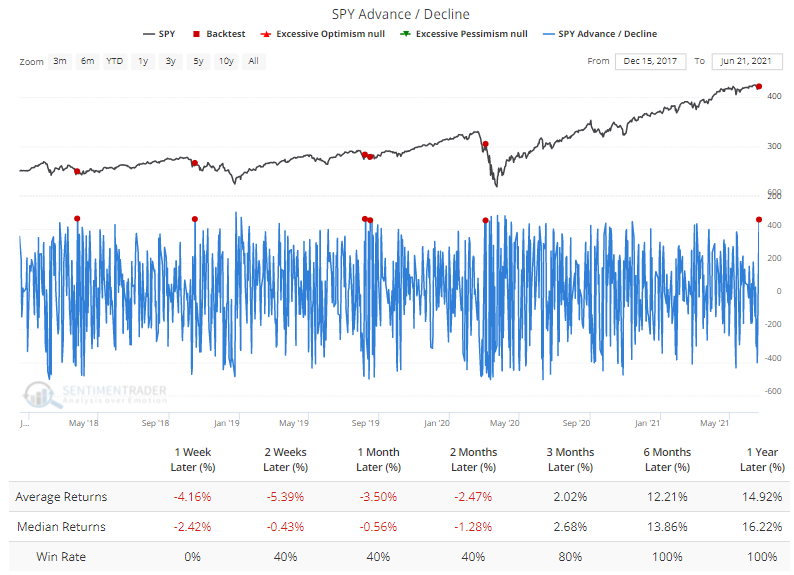
For what it's worth, all five saw the S&P trade lower over the next week before rebounding. It took about 5 seconds to test this assumption using our Backtest Engine.

Going back to 1928, Monday was among the best breadth days ever, with more than 90% of its stocks advancing, when the S&P was sitting within 1% of a multi-year high. It never happened from 1928 through 1986.

Before Monday's surge, for only the third time since the pandemic low, fewer than 35% of S&P 500 stocks were holding above their 50-day moving averages. This ended a streak of more than seven months, the longest in over three years and ranking as one of the best since 1927. And despite the drop in stocks holding above their 50-day averages, nearly 90% of them were still above their 200-day averages.

What else we're looking at

  • Full returns following a lopsided breadth day near a high since 1928
  • What happens after a drop in stocks above their 50-day averages
  • Returns following ends of medium-term uptrends but within long-term positive trends
  • A very curious thing happened during Tuesday's session
  • Why it's time to keep a close eye on natural gas
  • A reminder about looming S&P 500 seasonality
  • Crude oil has been very "trendy" lately - what it means going forward


Stat box

On Tuesday, the S&P 500 closed within 0.25% of a 52-week high, but fewer than 46% of its stocks were above their 10-day moving averages. That ranks as the 6th-lowest reading out of 3,395 days since 1928.

Etcetera

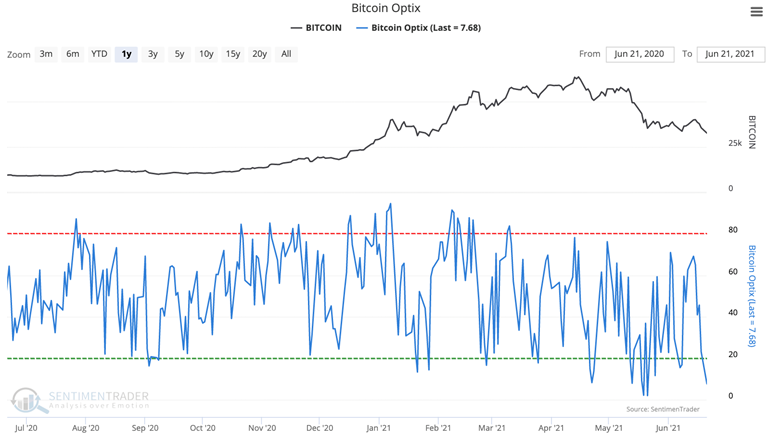
Crypto crash. The Bitcoin Optix has dropped to 7.6 for only the third time this year, with the others both being late last month.

bitcoin sentiment optimism index

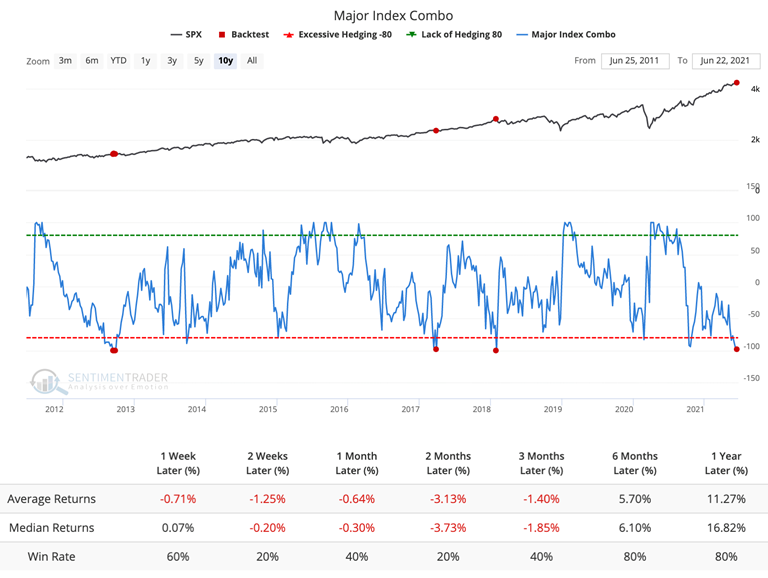
Major meltdown. The Major Index Combo has dropped to its lowest point in two years, slumping to -98. When this has happened within the last decade, according to the Backtest Engine, returns were mostly negative over the next 2-8 weeks.

hedgers smart money in s&p 500 futures

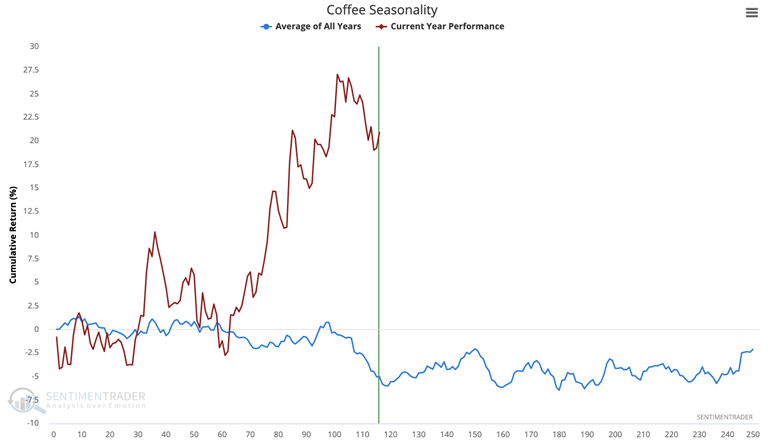
No average joe. Average coffee seasonality is close to its lowest point of the year. Over the past 30 years, the contract has usually bottomed around the 115th trading day of the year. Hard to imagine in 2021 with massive gains already.

coffee seasonality

DATA &
TECHnologies
IndicatorEdge
‍
BackTestEdge
‍
Other Tools
‍
DataEdge API
RESEARCH
reports
Research Solution
‍
Reports Library
‍
actionable
Strategies
Trading Strategies
‍
Smart Stock Scanner
‍
FREE
RESOUrCES
Simple Backtest
Calculator
Simple Seasonality
Calculator
The Kelly Criterion
Calculator
Sentiment Geo Map
‍
Public Research Reports
‍
Free Webinar
COMPANY
‍
About
‍
Meet our Team
‍
In the News
‍
Testimonials
‍
Client Success Stories
Pricing
Bundle pricing
‍
Announcements
‍
FAQ
© 2024 Sundial Capital Research Inc. All rights reserved.
Setsail Marketing
TermsPrivacyAffiliate Program
Risk Disclosure: Futures and forex trading contains substantial risk and is not for every investor. An investor could potentially lose all or more than the initial investment. Risk capital is money that can be lost without jeopardizing ones’ financial security or life style. Only risk capital should be used for trading and only those with sufficient risk capital should consider trading. Past performance is not necessarily indicative of future results.

Hypothetical Performance Disclosure: Hypothetical performance results have many inherent limitations, some of which are described below. No representation is being made that any account will or is likely to achieve profits or losses similar to those shown; in fact, there are frequently sharp differences between hypothetical performance results and the actual results subsequently achieved by any particular trading program. One of the limitations of hypothetical performance results is that they are generally prepared with the benefit of hindsight. In addition, hypothetical trading does not involve financial risk, and no hypothetical trading record can completely account for the impact of financial risk of actual trading. for example, the ability to withstand losses or to adhere to a particular trading program in spite of trading losses are material points which can also adversely affect actual trading results. There are numerous other factors related to the markets in general or to the implementation of any specific trading program which cannot be fully accounted for in the preparation of hypothetical performance results and all which can adversely affect trading results.

Testimonial Disclosure: Testimonials appearing on this website may not be representative of other clients or customers and is not a guarantee of future performance or success.