
What's the market message from the surge in the yield curve

Key points:
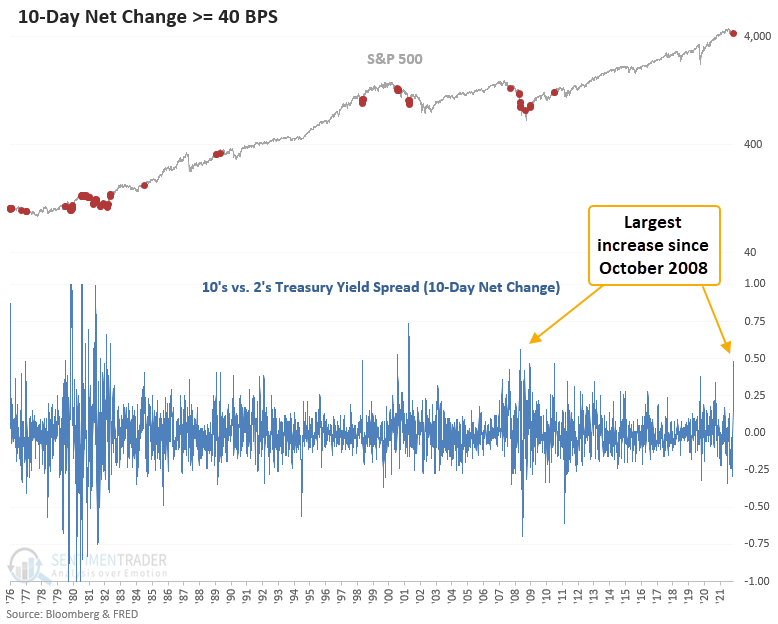
- The 10's vs. 2's treasury yield spread has increased by 48 bps
- The sharp rise in the spread occurred over the trailing 10 sessions
- Similar conditions preceded mixed to slightly weak results for stocks in the near term
- The yield curve could flatten again with 2's rising faster than 10's
A proxy for investor sentiment on the direction of the economy
When the 10's vs. 2's treasury yield spread declines, the yield curve is said to be "flattening." Typically, a flattening of the yield curve suggests softer economic conditions.
Conversely, when the 10's vs. 2's treasury yield spread increases, the yield curve is said to be "steepening." A steepening of the yield curve is typically, but not always, associated with more robust economic conditions.
However, we need to keep in mind that the unprecedented policy by the Federal Reserve could influence the bond market in a way that has nothing to do with the economy.
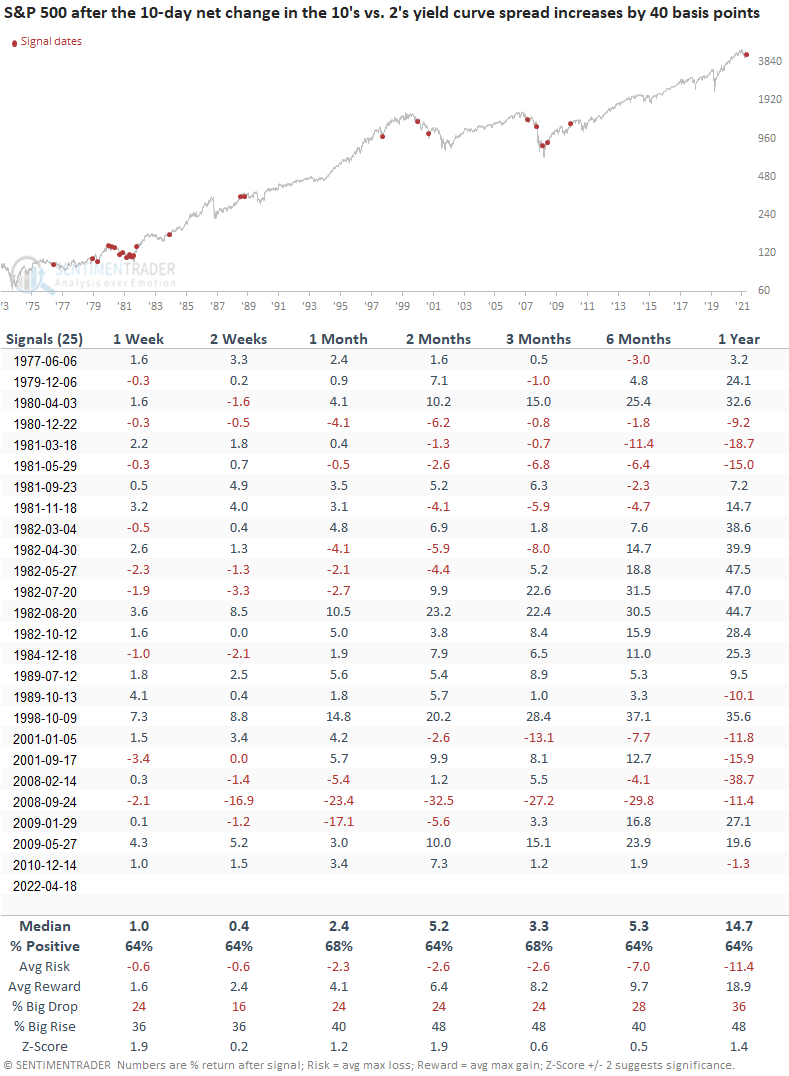
What happens when the yield curve increases by a meaningful amount
Let's assess the outlook for the stock market when the 10-day net change in the 10's versus 2's treasury yield spread increases by 40 basis points or more. I will use a reset that requires the 10-day net change to cross below zero before a new signal can trigger again.
Significant increases in the treasury yield spread in a brief period typically occur in unfavorable trend environments for the S&P 500. The signal count shows that 67% of the instances triggered below the 200-day moving average.
Similar signals preceded mostly favorable returns
This study generated a signal 25 other times over the past 45 years. After the others, S&P 500 future returns and win rates were slightly better to inline when compared to historical averages. Significant drawdowns in the 6-12 month windows all boiled down to whether the index was in a recession-induced bear market. I would keep in mind that most signals occurred between 1980 and 1982. So, that period will have an outsized influence on the data.
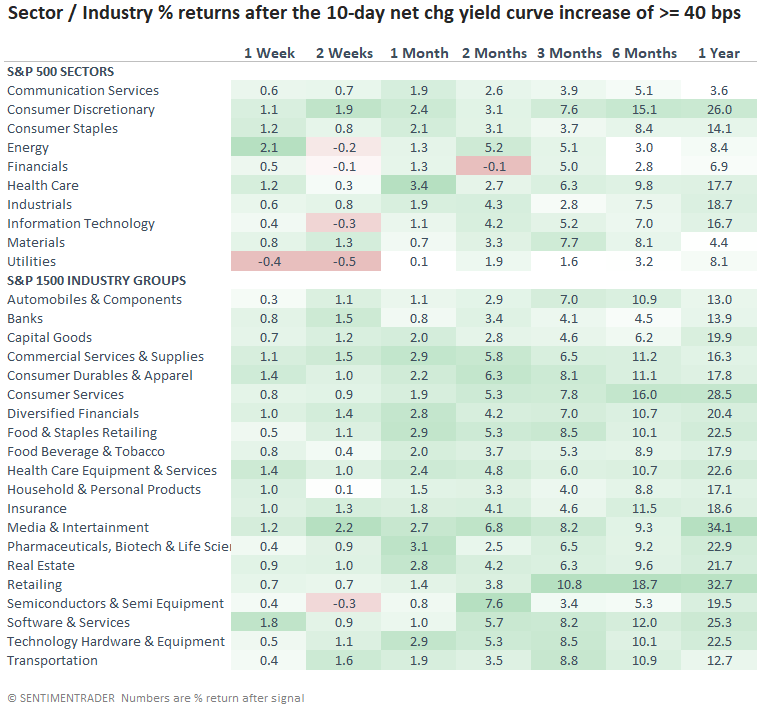
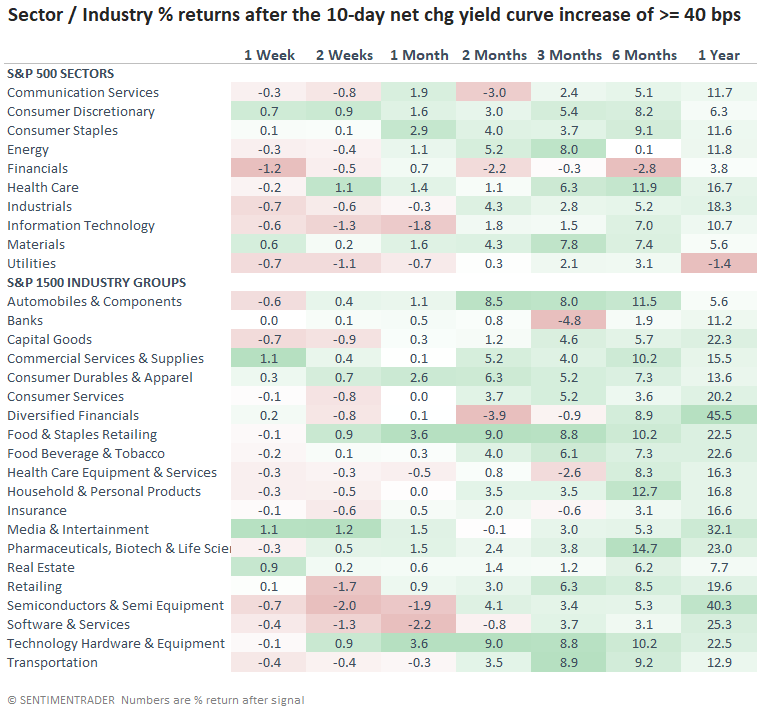
Sector and industry returns after the yield curve surge
Returns look constructive across most time frames except for the 2-week window. Financials look somewhat sluggish, especially in the first few months.
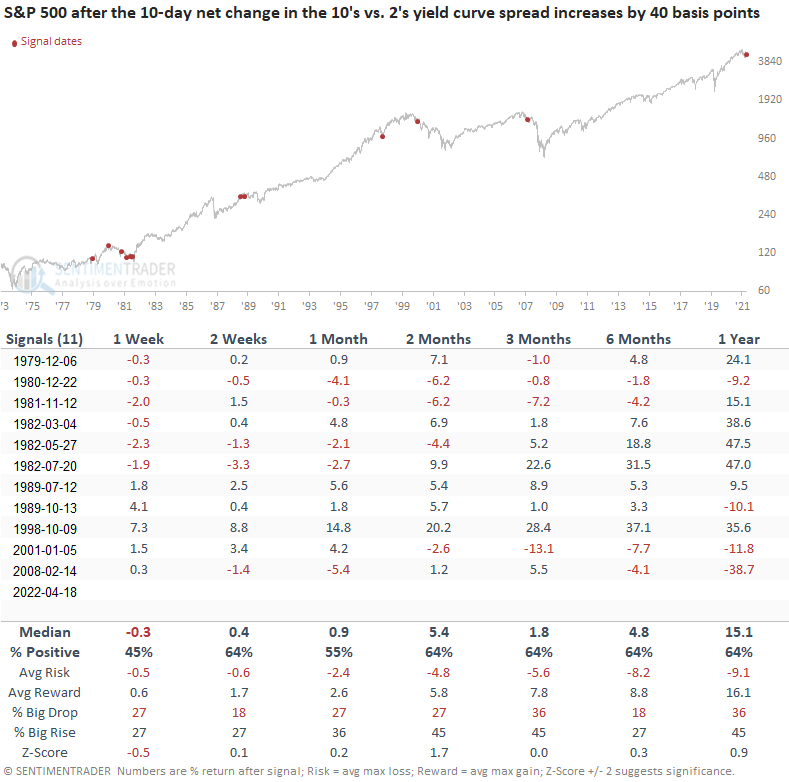
Signals after a yield curve inversion
Let's add some context to the study. I will keep the net change surge but now include a filter that requires the 10's vs. 2's yield curve to invert before a signal can trigger. If you recall, the 10/2 curve inverted on 4/1/22.
This study generated a signal 11 other times over the past 43 years. After the others, S&P 500 future returns, win rates, and risk/reward profiles were mixed to slightly better than historical averages across most time frames. However, the results look less favorable on a short to medium-term basis compared to the original study.
Sector and industry returns after yield curve inversion
Sector and industry returns show a weaker outlook in the near term. Once again, financials look sluggish.
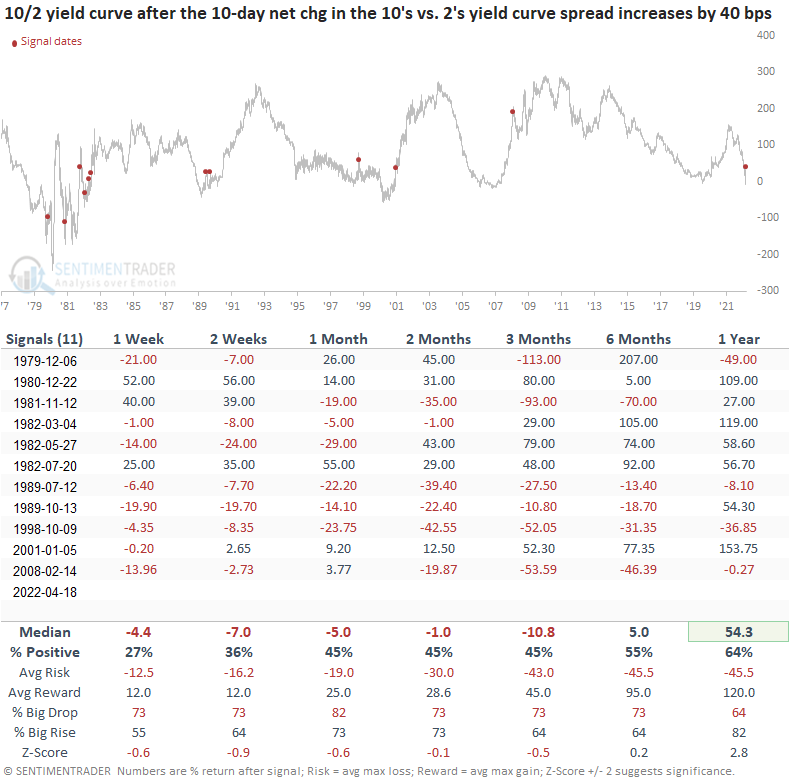
Yield curve when the surge occurs after an inverted curve
When I apply the signals to the yield curve, the outlook table suggests the curve could flatten over the next 3 months.
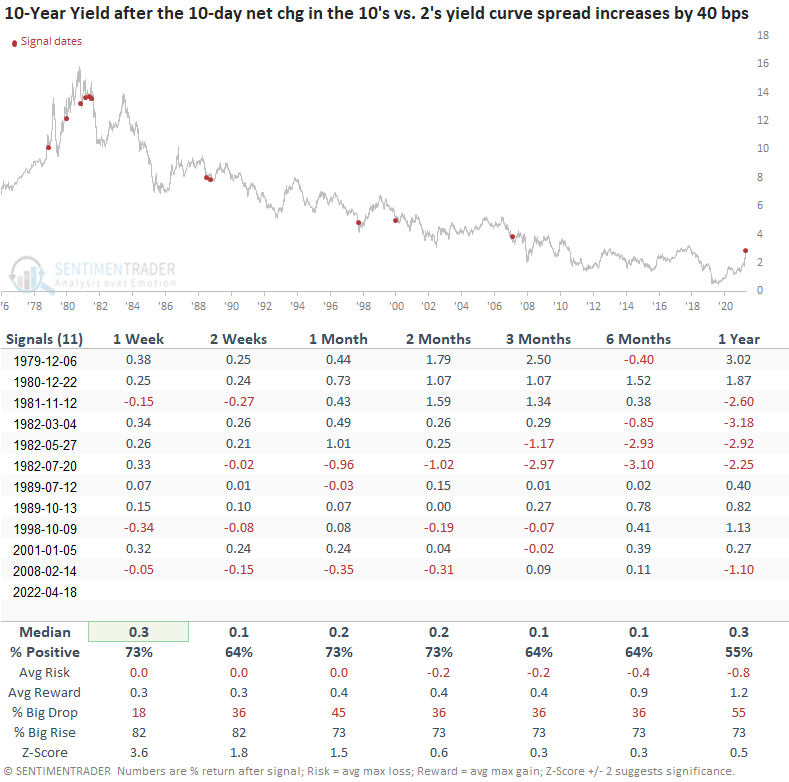
10-year yield when the surge occurs after an inverted curve
The 10-year bond suggests yields could continue to increase, which is alarming, given the amount of pain that bond investors have endured lately.
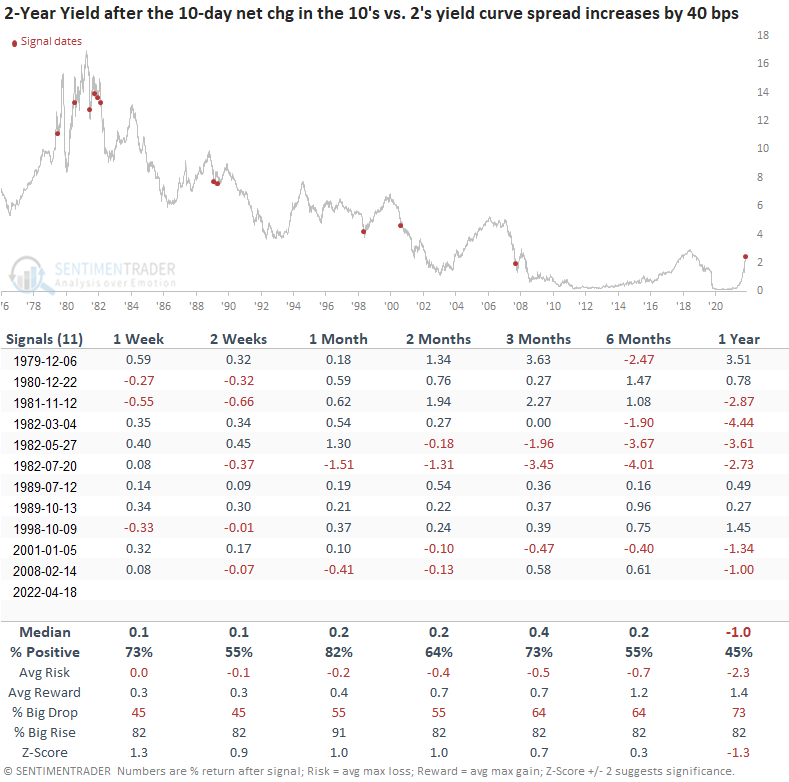
2-year yield when the surge occurs after an inverted curve
The 2-year bond shows an even greater chance that short-term yields continue to rise with an 82% win rate in the 1-month time frame.
What the research tells us...
When the 10's vs. 2's yield curve spread registers a sharp increase over the trailing 10-day period, stocks show mixed to slightly weak results in the near term, especially after an inversion. Long-term gains look constructive outside of a few recession-induced bear instances. After the sharp increase, the curve could flatten again with 2's rising more than 10's.