Products
SentimenTrader Trading Tools
‍
Backtest Engine
My Trading Toolkit
Correlation Analysis
Seasonality
Indicators & Data API
‍
Proprietary Indicators & Charts
Market Data API
Strategies & Scanner
‍
50+ Trading Strategies
Smart Stock Scanner
Research Reports
‍
Research Solutions
Reports Library
Free Resources
Simple Backtest Calculator
Simple Seasonality Calculator
The Kelly Criterion Calculator
Sentiment Geo Map
Public Research Reports
Pricing
Company
About
In the News
Testimonials
Client Success Stories
Contact
Log inLoginSign up
< BACK TO ALL REPORTS

What's the market message from higher bond yields

Dean Christians
2022-02-09
The 2-year yield has closed higher for 7 consecutive weeks. Let's conduct a study to assess the outlook for stocks, bonds, and commodities after similar interest rate adjustments.

Key points:

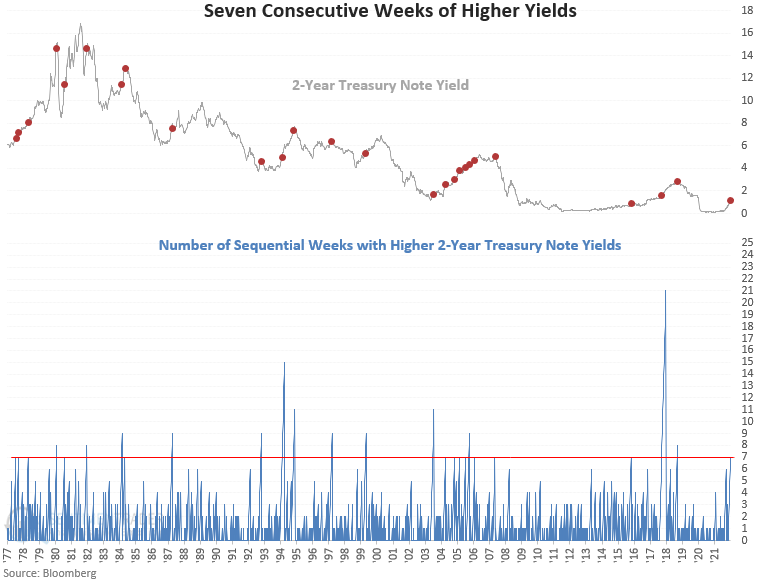
  • The 2-year Treasury note yield has increased for 7 consecutive weeks
  • Stocks show tepid results on a short to medium-term time frame
  • Bond yields continue higher in the near term
  • Commodities show neutral results on a short to medium-term time frame

What's the impact of higher yields on stocks, bonds, and commodities

Let's conduct a study to assess the outlook for stocks, bonds, and commodities when the 2-year treasury note yield increases for 7 consecutive weeks. I screened out repeats by requiring the count to reset to zero before triggering an additional signal.

Since 1977, only 5 out of 25 signals coincided with a significant peak in the 2-year yield.

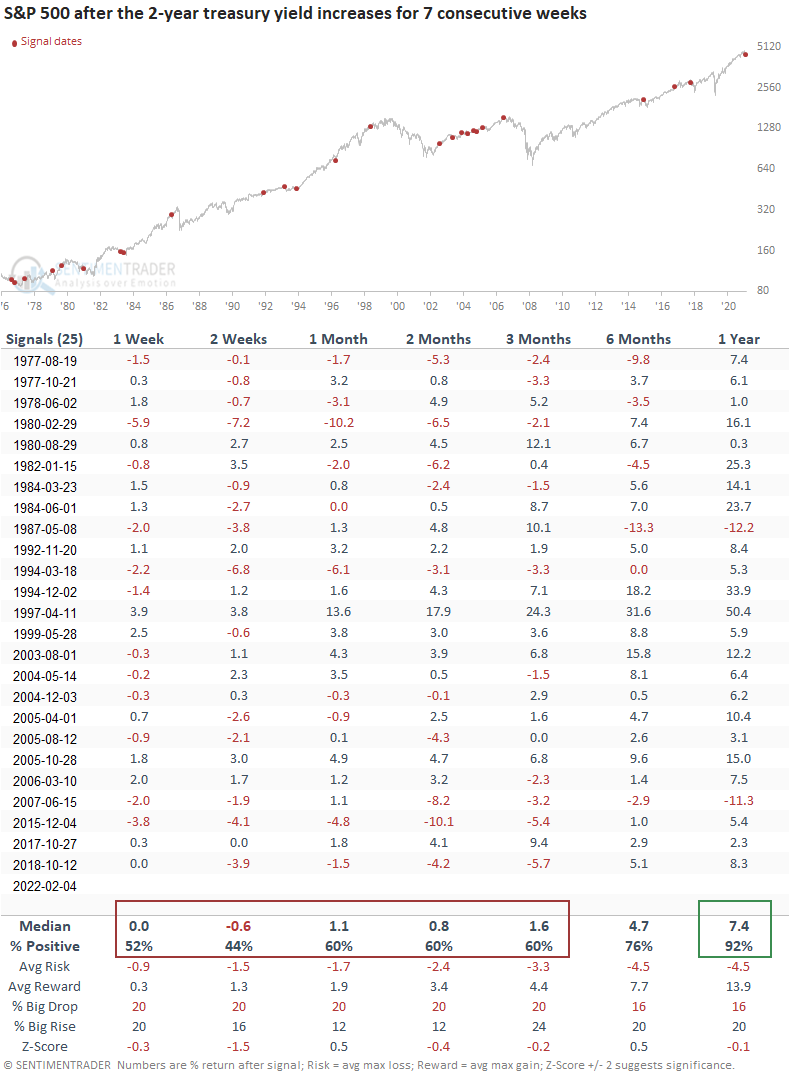
Similar streaks show tepid gains for the S&P 500

This signal has triggered 25 other times over the past 45 years. After the others, S&P 500 performance and win rates show somewhat tepid results on short to medium-term time frames. However, the 1-year win rate suggests that similar increases in bond yields do not kill a bull market.

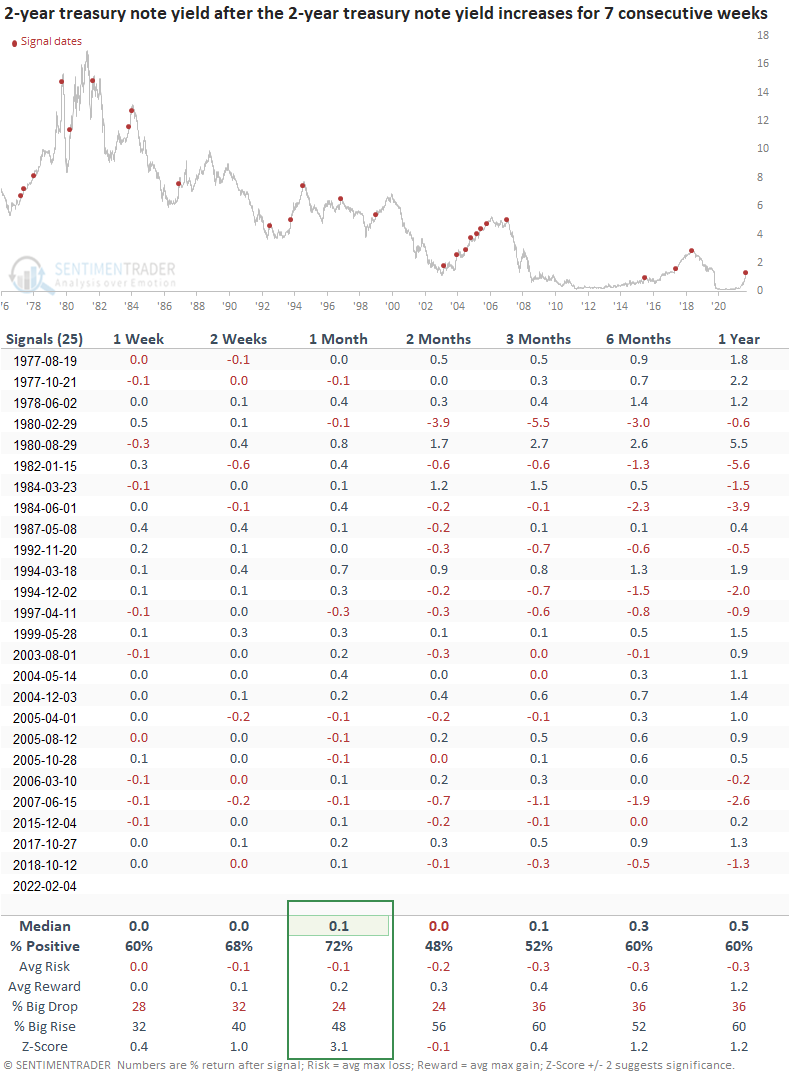
Similar streaks show yields could continue higher in the near term

The 1-month time frame suggests the 2-year yield could continue to increase in the near term. The June 2007 signal is the only time yields peaked and fell across all time frames.

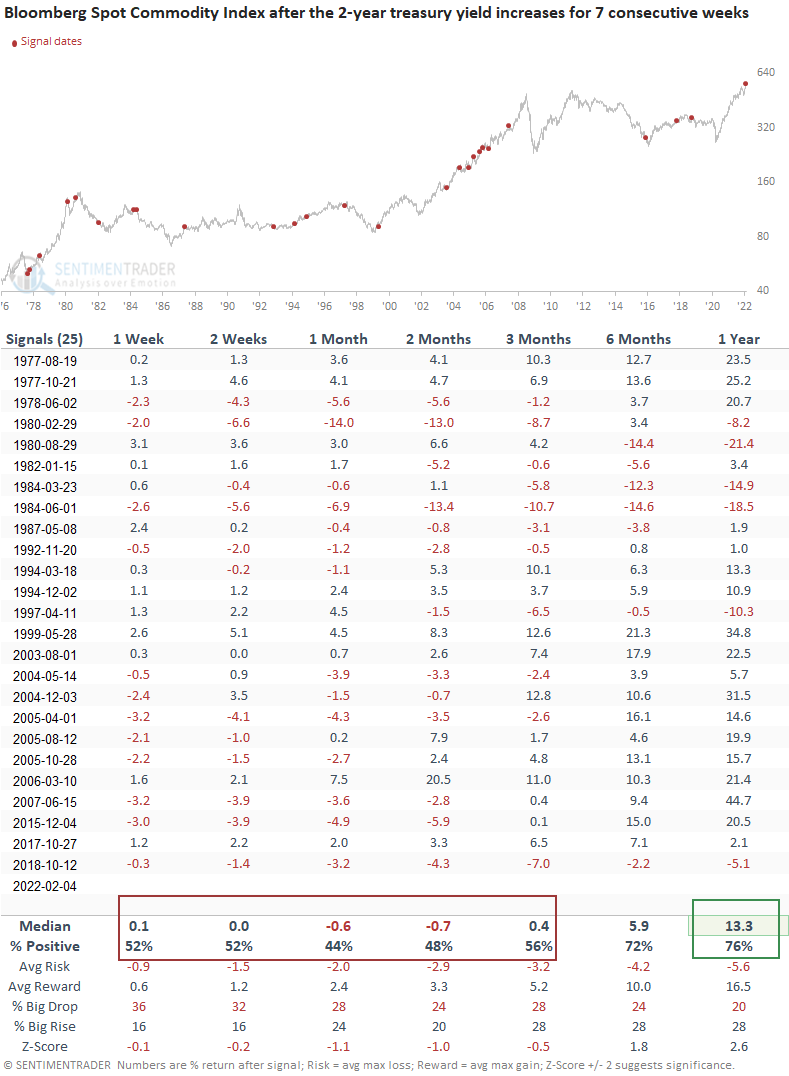
Similar streaks show commodities could struggle in the months ahead

Commodities offer flat to slightly negative returns on a short to medium-term basis. The long-term results look good, especially if commodities are in a bull market like 1970-80 or 2002-2008.

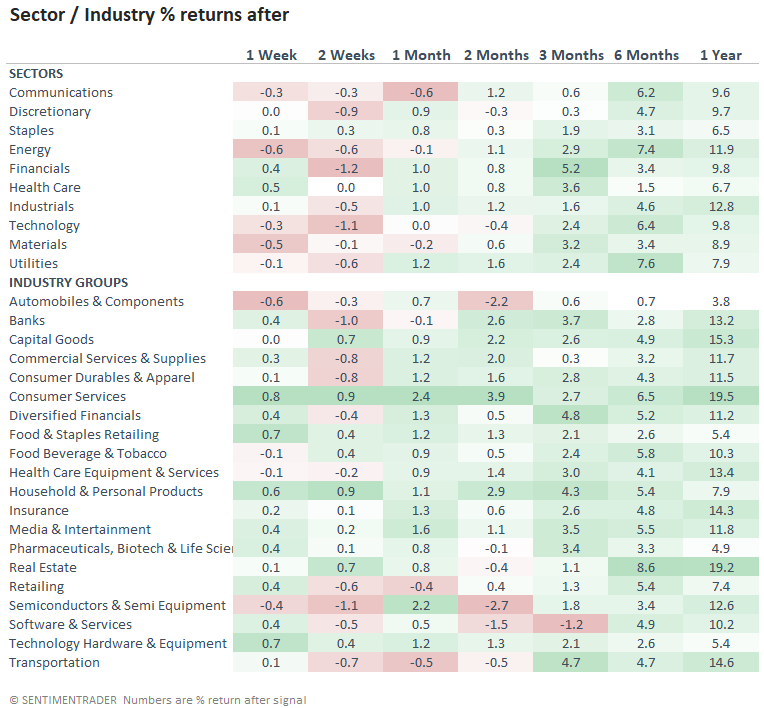
Sectors and industry groups confirm the broad market message

When we examine sectors and industry groups, the return patterns look similar to the S&P 500. One might expect soft results in the near term but significantly better days ahead, especially a year from now. On Tuesday, I highlighted a few bullish signals for financials. The yield study provides one more incrementally positive message for the sector.

What the research tells us...

When the 2-year bond yield increases for 7 consecutive weeks, assets such as stocks and commodities typically adjust to the higher cost of capital. Similar setups to what we're seeing now have preceded slightly flat to negative results for stocks and commodities on a short to medium-term basis. However, the long-term results suggest that the adjustment to higher rates is short-lived. Typically, consistent win streaks like the current one suggest yields can go higher in the near term.

Sorry, you don't have access to this report

Upgrade your subscription plan to get access
Go to Dasboard
PRODUCTS
SentimenTrader
Trading Tools
Indicators & Data API
‍
Strategies & Scanner
‍
Research Reports
FREE
RESOUrCES
Simple Backtest
Calculator
Simple Seasonality
Calculator
The Kelly Criterion
Calculator
Sentiment Geo Map
‍
Public Research Reports
‍
Pricing
Bundle pricing
‍
Announcements
‍
FAQ
COMPANY
‍
About
‍
In the News
‍
Testimonials
‍
Client Success Stories
CONTACT
‍
General Inquiries
‍
Media Inquiries
‍
Financial Professionals Inquiries
‍
© 2025 Sundial Capital Research Inc. All rights reserved.
Setsail Marketing
TermsPrivacyAffiliate Program
Risk Disclosure: Futures and forex trading contains substantial risk and is not for every investor. An investor could potentially lose all or more than the initial investment. Risk capital is money that can be lost without jeopardizing ones’ financial security or life style. Only risk capital should be used for trading and only those with sufficient risk capital should consider trading. Past performance is not necessarily indicative of future results.

Hypothetical Performance Disclosure: Hypothetical performance results have many inherent limitations, some of which are described below. No representation is being made that any account will or is likely to achieve profits or losses similar to those shown; in fact, there are frequently sharp differences between hypothetical performance results and the actual results subsequently achieved by any particular trading program. One of the limitations of hypothetical performance results is that they are generally prepared with the benefit of hindsight. In addition, hypothetical trading does not involve financial risk, and no hypothetical trading record can completely account for the impact of financial risk of actual trading. for example, the ability to withstand losses or to adhere to a particular trading program in spite of trading losses are material points which can also adversely affect actual trading results. There are numerous other factors related to the markets in general or to the implementation of any specific trading program which cannot be fully accounted for in the preparation of hypothetical performance results and all which can adversely affect trading results.

Testimonial Disclosure: Testimonials appearing on this website may not be representative of other clients or customers and is not a guarantee of future performance or success.