Data &
Technology
Research
Reports
Report Solutions
Reports Library
Actionable
Strategies
Free
Resources
Simple Backtest Calculator
Simple Seasonality Calculator
The Kelly Criterion Calculator
Sentiment Geo Map
Public Research Reports
Free Webinar
Pricing
Company
About
Meet Our Team
In the News
Testimonials
Client Success Stories
Contact
Log inLoginSign up
< BACK TO ALL REPORTS

What's scaring investors right now

Jason Goepfert
2021-03-17
The 1-month correlation between the VIX and 10-year yields is the highest it's been in years.

What's been scaring investors over the past month? Rising yields.

Maybe "scared" isn't the right word, since the VIX indicator, which measures options traders' estimate of future volatility, has mostly been dropping. So "influencing" is probably more appropriate. And over the past month, yields have been influencing the VIX at one of the highest levels in a decade.

The chart below shows a rolling 1-month correlation between daily changes in the VIX and 10-year Treasury yields. The higher the blue line, the more that yields seem to be influencing stock investors' volatility expectations.

vix and 10 year treasury yield correlation

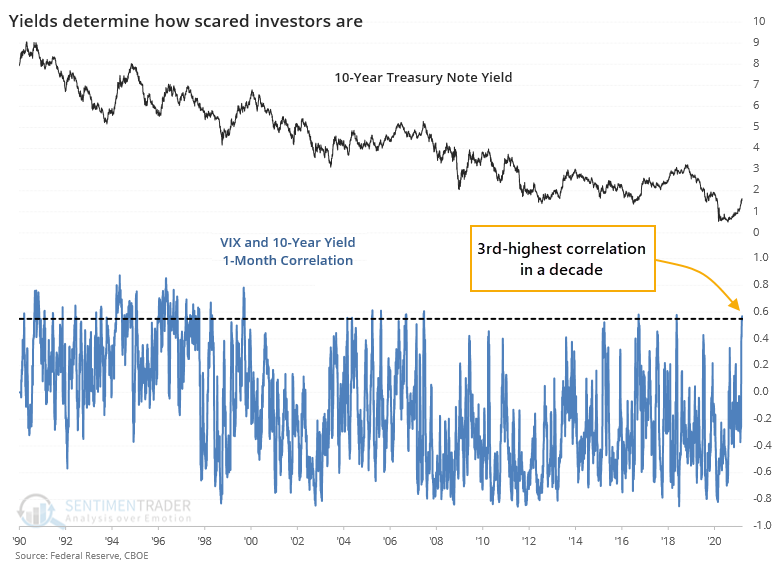
Whether this matters is open to interpretation. So, let's put some numbers to it. We'll go back to the inception of the VIX and look for every time the 21-day correlation in daily changes between it and the yield on 10-year notes exceeds 0.55. This is on a scale of -1.0 (perfect inverse correlation) to +1.0 (perfect positive correlation).

When rising yields most influenced the VIX, over the next 3 months, the S&P 500 averaged a return of only +0.3% versus more than 5% when the VIX was being influenced by falling yields.

What else we're looking at

  • Full details on S&P 500, VIX, and 10-year Treasury returns after high VIX / yield correlations
  • What the opposite conditions led to
  • A look at bonds vs. economic expectations
  • An inflation model using core vs. reported CPI measures

Stat Box

For the 1st time in 4 years, more than 95% of stocks in Japan's Nikkei 225 index are above their 200-day moving averages. Over the past 15 years, our Backtest Engine shows that when this many stocks trade above their long-term averages for the first time in a year, the Nikkei was higher a year later 4 out of 5 times.


Etcetera

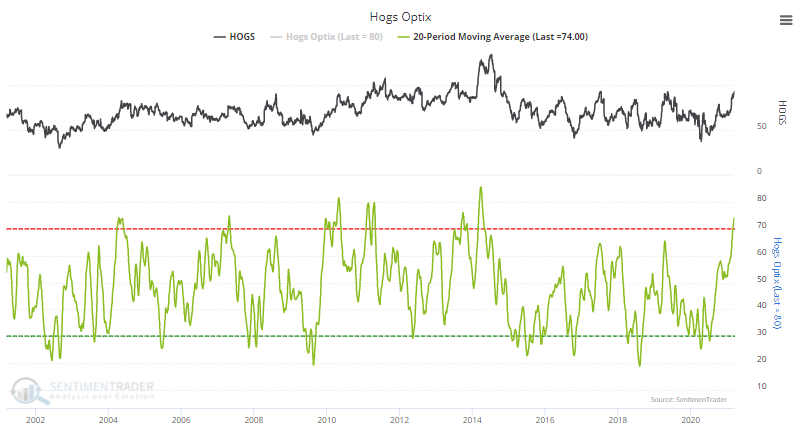
Get the butcher knife ready. The old trope, "Bulls make money, bears make money, but pigs get slaughtered," may be apropos now since optimism on hog futures is among the highest levels in history. A 20-day average of the Optimism Index is now the highest since 2014.

hog sentiment

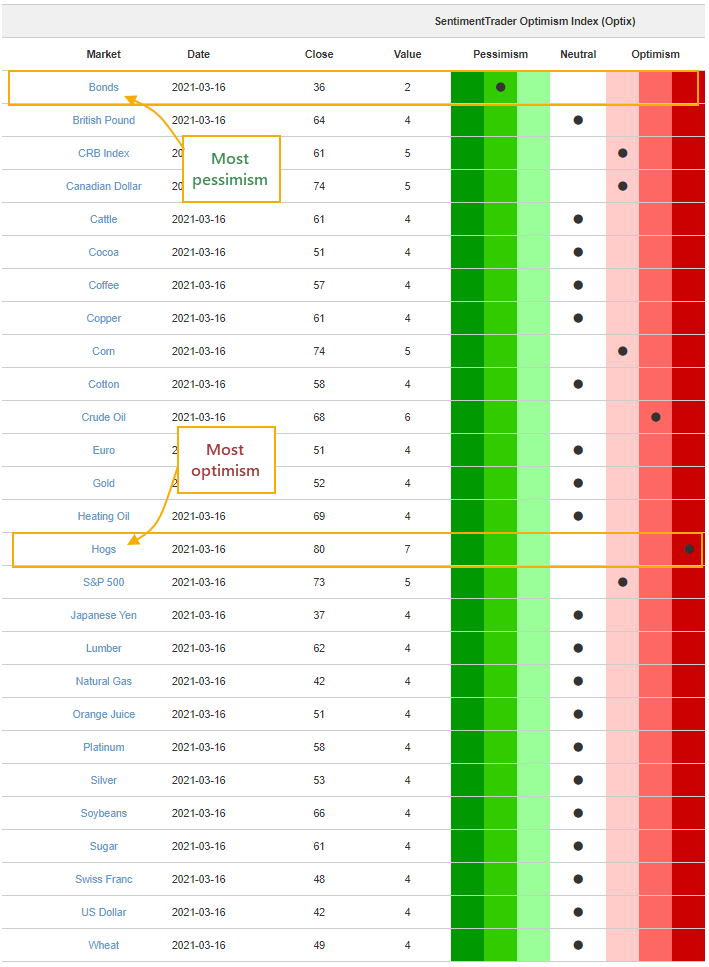
It's got the most optimism. Even as speculation rages in the stock market, the most overall optimism among markets is in hogs. Our Market Overview shows it's the market with the highest expectations built in. Bonds have the lowest.

market sentiment table

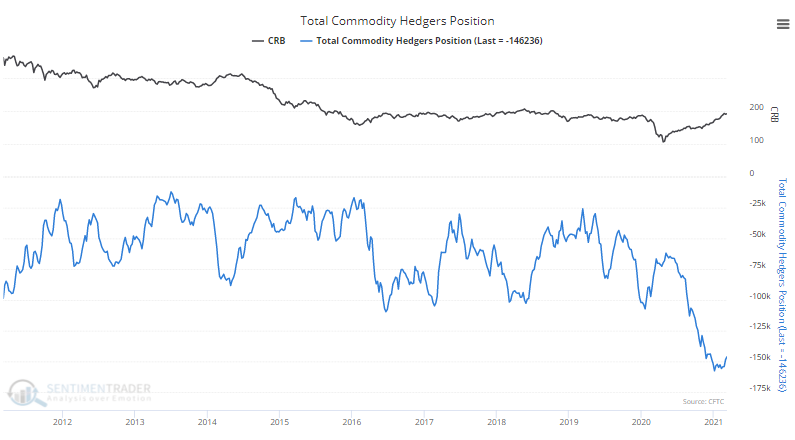
It's not just hogs. Optimism is high in many commodity futures contracts, and smart money commercial hedgers are betting against them (kind of). The net number of contracts on commodity futures among hedgers has plunged to an all-time record low.

smart money hedger commodities

DATA &
TECHnologies
IndicatorEdge
‍
BackTestEdge
‍
Other Tools
‍
DataEdge API
RESEARCH
reports
Research Solution
‍
Reports Library
‍
actionable
Strategies
Trading Strategies
‍
Smart Stock Scanner
‍
FREE
RESOUrCES
Simple Backtest
Calculator
Simple Seasonality
Calculator
The Kelly Criterion
Calculator
Sentiment Geo Map
‍
Public Research Reports
‍
Free Webinar
COMPANY
‍
About
‍
Meet our Team
‍
In the News
‍
Testimonials
‍
Client Success Stories
Pricing
Bundle pricing
‍
Announcements
‍
FAQ
© 2024 Sundial Capital Research Inc. All rights reserved.
Setsail Marketing
TermsPrivacyAffiliate Program
Risk Disclosure: Futures and forex trading contains substantial risk and is not for every investor. An investor could potentially lose all or more than the initial investment. Risk capital is money that can be lost without jeopardizing ones’ financial security or life style. Only risk capital should be used for trading and only those with sufficient risk capital should consider trading. Past performance is not necessarily indicative of future results.

Hypothetical Performance Disclosure: Hypothetical performance results have many inherent limitations, some of which are described below. No representation is being made that any account will or is likely to achieve profits or losses similar to those shown; in fact, there are frequently sharp differences between hypothetical performance results and the actual results subsequently achieved by any particular trading program. One of the limitations of hypothetical performance results is that they are generally prepared with the benefit of hindsight. In addition, hypothetical trading does not involve financial risk, and no hypothetical trading record can completely account for the impact of financial risk of actual trading. for example, the ability to withstand losses or to adhere to a particular trading program in spite of trading losses are material points which can also adversely affect actual trading results. There are numerous other factors related to the markets in general or to the implementation of any specific trading program which cannot be fully accounted for in the preparation of hypothetical performance results and all which can adversely affect trading results.

Testimonial Disclosure: Testimonials appearing on this website may not be representative of other clients or customers and is not a guarantee of future performance or success.