Data &
Technology
Research
Reports
Report Solutions
Reports Library
Actionable
Strategies
Free
Resources
Simple Backtest Calculator
Simple Seasonality Calculator
The Kelly Criterion Calculator
Sentiment Geo Map
Public Research Reports
Free Webinar
Pricing
Company
About
Meet Our Team
In the News
Testimonials
Client Success Stories
Contact
Log inLoginSign up
< BACK TO ALL REPORTS

Whatever dispersion is, it just hit a record

Jason Goepfert
2020-11-11
The difference in daily returns between defensive and cyclical stocks jumped this week, continuing a trend from the past year.

Monday's session was one for the record books for multiple reasons. 

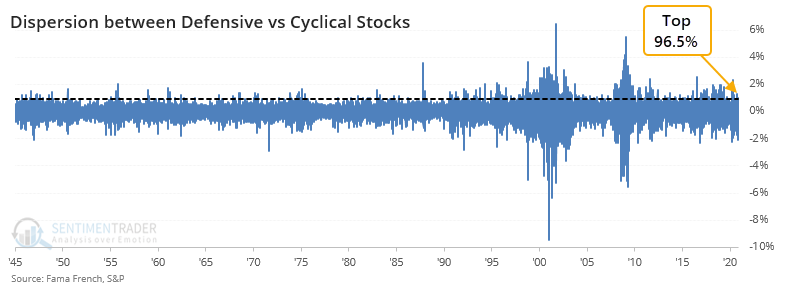
There was a clear shift from former winners to former losers. The spread in daily returns between defensive and cyclical stocks on Monday ranked in the top 96.5% of all readings since 1945.

Defensive versus cyclical stock rotation

It was even starker between small- and large-cap stocks, with Monday's difference ranking in the top 99.9% of all readings.

And greater still between value and growth stocks. The shift from growth to value on Monday had never been more extreme in the past 75 years. 

If we look at those charts, then it's not just Monday's activity that stands out, but the wild differences in returns that have been evident for months. When we look at the absolute difference in price changes between all 6 factors over the past 200 days, then we've seen one of the truly extreme risk-on vs risk-off environments ever.


What else is happening

These are topics we explored in our most recent research. For immediate access with no obligation, sign up for a 30-day free trial now.

  • What happened in the S&P 500 when factor dispersion was so great
  • More consistently, what happened to defensive / cyclical, small-cap / large-cap, and value / growth ratios
  • There has been a surge of stocks in uptrends, and at new highs
  • Looking at breadth thrusts in financials and the Nifty 50 index from India

Stat Box

In the finance sector, more than 69% of stocks have jumped outside of their Bollinger Bands. Nice. That's among the largest readings in 30 years, and has typically resulted in a breather over the next month. One year later, the sector was higher after 8 out of 8 signals by an average of 21%.

Sentiment from other perspectives

We don't necessarily agree with everything posted here - some of our work might directly contradict it - but it's often worth knowing what others are watching.

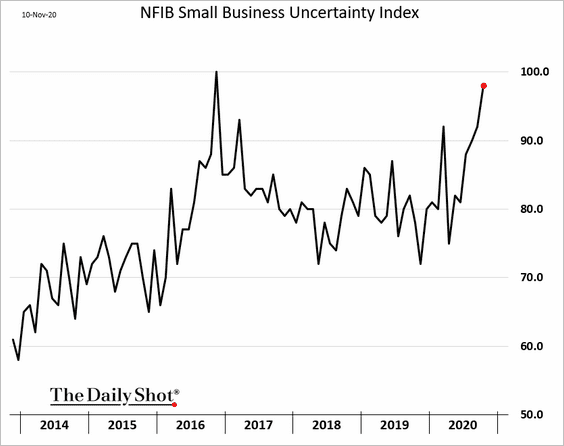
1. Small businesses are showing a big increase in uncertainty - Daily Shot

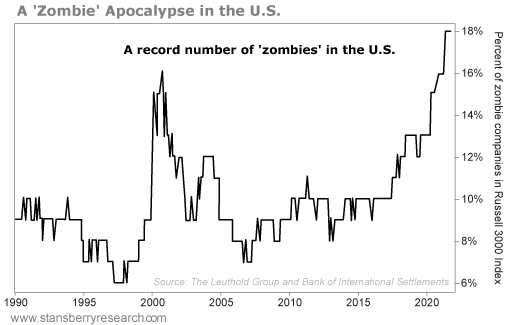
2. Bond investors have been forgiving enough that there is now a record number of zombie companies- Daily Wealth

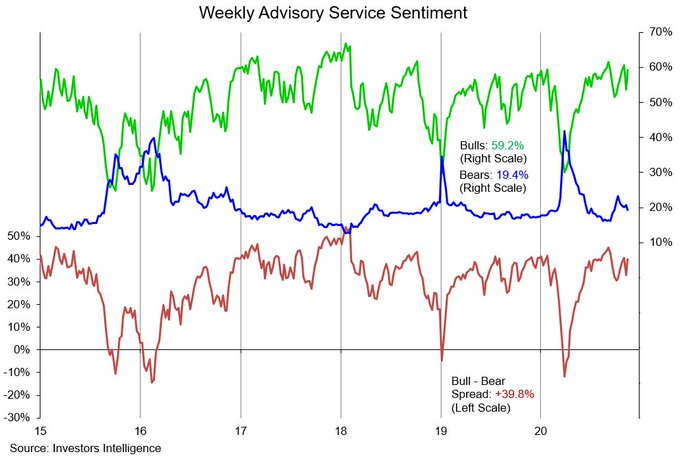
3. Newsletter writers don't care about all that, they're among the most bullish they've been in years - Willie Delwiche, CMT, CFA

DATA &
TECHnologies
IndicatorEdge
‍
BackTestEdge
‍
Other Tools
‍
DataEdge API
RESEARCH
reports
Research Solution
‍
Reports Library
‍
actionable
Strategies
Trading Strategies
‍
Smart Stock Scanner
‍
FREE
RESOUrCES
Simple Backtest
Calculator
Simple Seasonality
Calculator
The Kelly Criterion
Calculator
Sentiment Geo Map
‍
Public Research Reports
‍
Free Webinar
COMPANY
‍
About
‍
Meet our Team
‍
In the News
‍
Testimonials
‍
Client Success Stories
Pricing
Bundle pricing
‍
Announcements
‍
FAQ
© 2024 Sundial Capital Research Inc. All rights reserved.
Setsail Marketing
TermsPrivacyAffiliate Program
Risk Disclosure: Futures and forex trading contains substantial risk and is not for every investor. An investor could potentially lose all or more than the initial investment. Risk capital is money that can be lost without jeopardizing ones’ financial security or life style. Only risk capital should be used for trading and only those with sufficient risk capital should consider trading. Past performance is not necessarily indicative of future results.

Hypothetical Performance Disclosure: Hypothetical performance results have many inherent limitations, some of which are described below. No representation is being made that any account will or is likely to achieve profits or losses similar to those shown; in fact, there are frequently sharp differences between hypothetical performance results and the actual results subsequently achieved by any particular trading program. One of the limitations of hypothetical performance results is that they are generally prepared with the benefit of hindsight. In addition, hypothetical trading does not involve financial risk, and no hypothetical trading record can completely account for the impact of financial risk of actual trading. for example, the ability to withstand losses or to adhere to a particular trading program in spite of trading losses are material points which can also adversely affect actual trading results. There are numerous other factors related to the markets in general or to the implementation of any specific trading program which cannot be fully accounted for in the preparation of hypothetical performance results and all which can adversely affect trading results.

Testimonial Disclosure: Testimonials appearing on this website may not be representative of other clients or customers and is not a guarantee of future performance or success.