Data &
Technology
Research
Reports
Report Solutions
Reports Library
Actionable
Strategies
Free
Resources
Simple Backtest Calculator
Simple Seasonality Calculator
The Kelly Criterion Calculator
Sentiment Geo Map
Public Research Reports
Free Webinar
Pricing
Company
About
Meet Our Team
In the News
Testimonials
Client Success Stories
Contact
Log inLoginSign up
< BACK TO ALL REPORTS

What you need to know about the year end rally

Jay Kaeppel
2022-11-14
The stock market has long shown a tendency to rally late in the calendar year. This piece looks at one iteration of the year-end rally and analyzes long-term results and consistency. We also compare bull market year results to bear market year results.

Key points:

  • One of the more favorable times of the year starts the week of Thanksgiving and runs through year-end
  • The market is likely to be showing a year-to-date loss when this year's favorable period begins
  • Down years still showed above-average performance during these windows

The year-end rally period starts this week

There are many different takes on year-end seasonality, and none of them are necessarily the "right" one.

From my perspective, the year-end rally period starts at the close on Friday the week before Thanksgiving and ends at the close on the last trading day of the year.

For testing purposes, we will use daily closing prices for the S&P 500 Index. The chart below displays the cumulative percentage return for the S&P 500 Index held long only during this period starting in 1942.

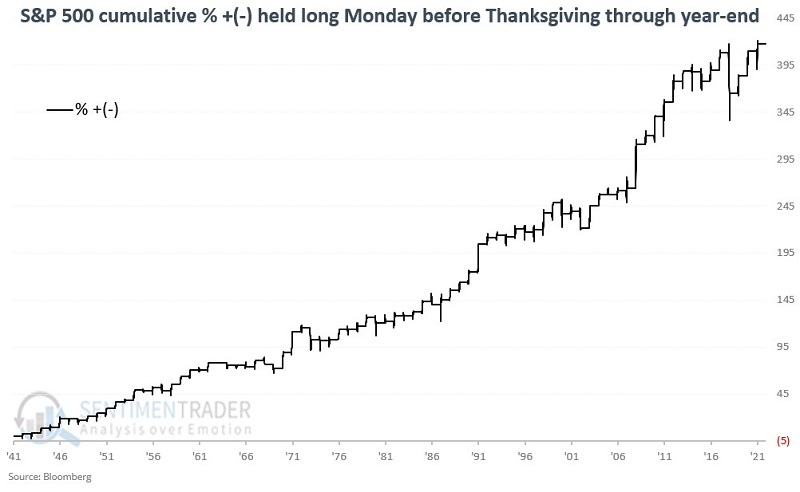
The bad news is that on a year-to-year basis, there is no way to predict how the market will perform during this year-end period. The good news is that the long-term trend slopes from lower left to upper right, showing long-term consistency.

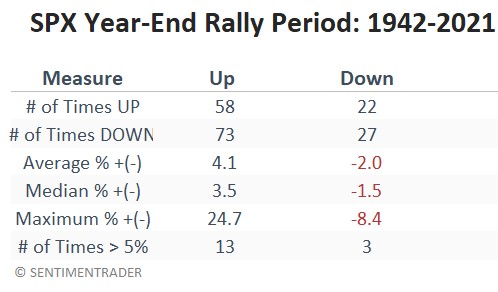
The S&P 500 sported a positive return 73% of the time, but more impressively, average gains about doubled average losses, and the S&P was much more likely to enjoy a large gain than a large loss.

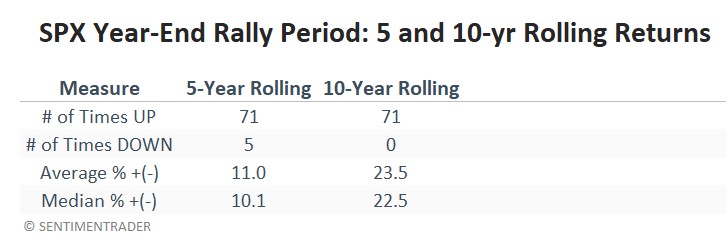
5-year and 10-year rolling returns and their impact on returns

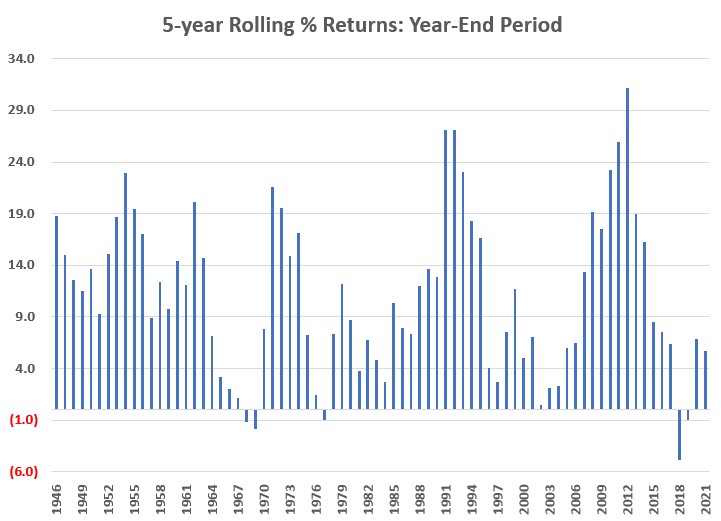
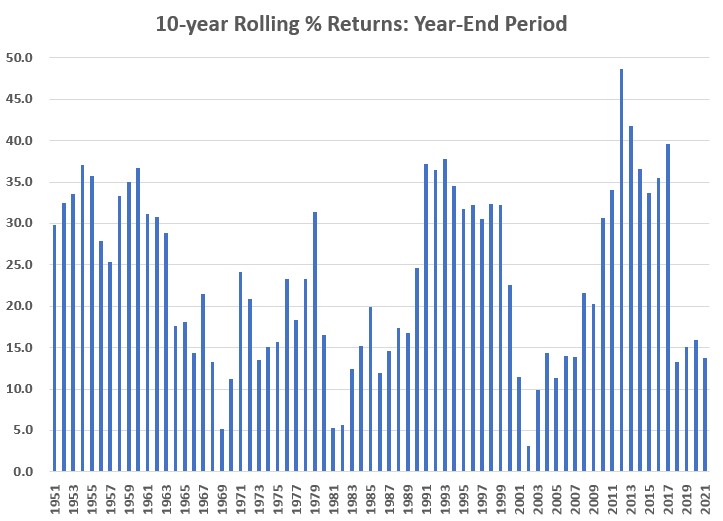
For these tests, we look at the cumulative percentage change achieved by holding the S&P 500 only during the year-end rally period over each 5-year and 10- year stretches.

The chart below shows the rolling 5-year returns, and the one below that shows the rolling 10-year returns.

Results based on year-to-date performance

The S&P 500 will likely be at a loss for the year when this year's year-end rally period begins. To assess if this might matter, we looked separately at year-end rally period performance based on whether the S&P 500 was showing a gain or a loss as of the close on the Friday before Thanksgiving.

The chart below displays the cumulative S&P 500 percentage return for year-end periods when the S&P is up for the year as of the Friday before Thanksgiving. 

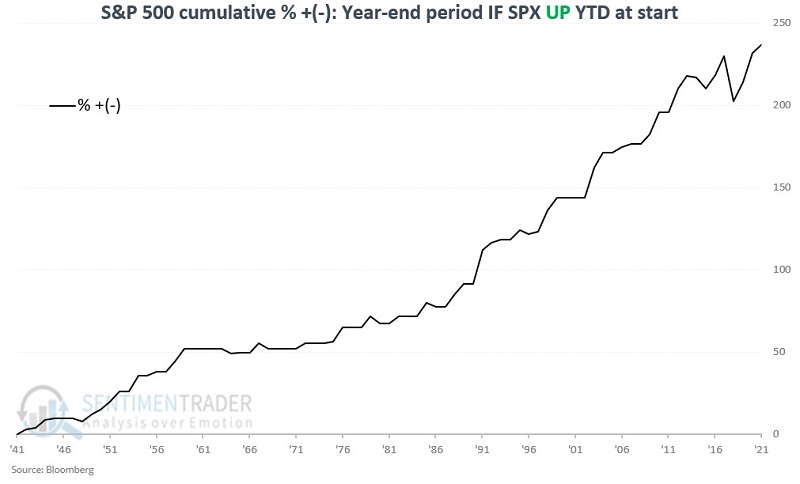
During these years, the S&P gained 77% of the time, with returns that were heavily skewed to the positive side.

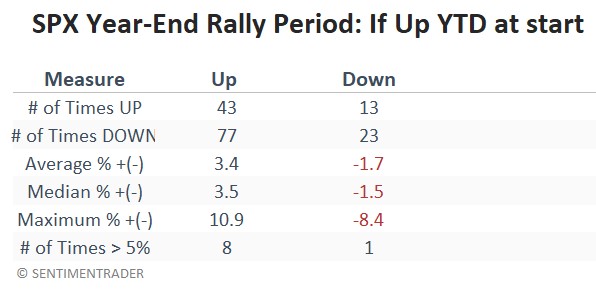
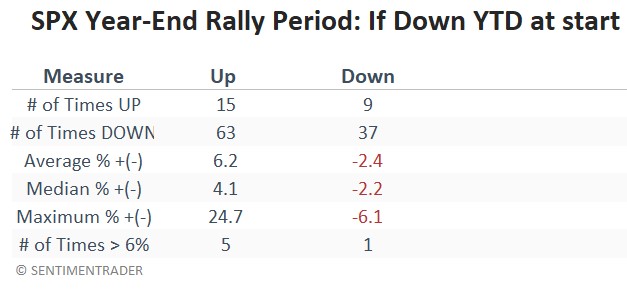
The chart below displays the cumulative S&P 500 return for year-end periods when the S&P is down for the year as of the Friday before Thanksgiving. 

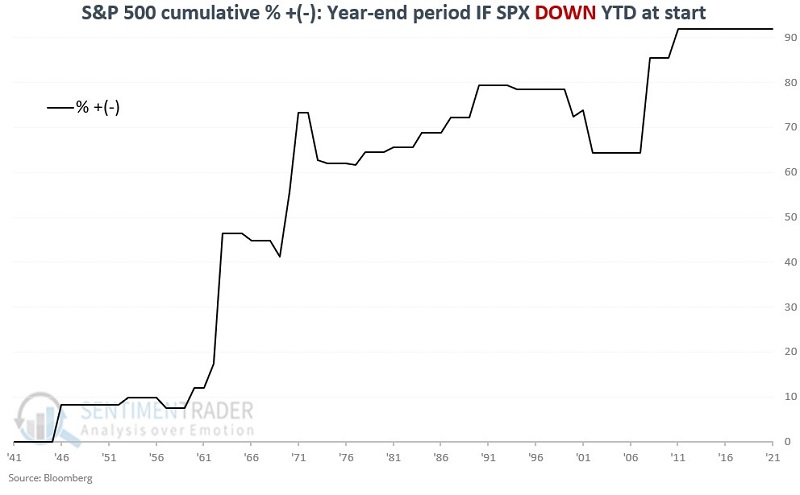
The year-end period Win Rate drops from 77% to 63% during these years. The good news is that results still skew significantly positive. Also, the median loss is just -2.2%. The worst losses were -6.1% in 1973 and -5.5% in 2002.

What the research tells us…

History suggests that investors should have a high degree of confidence in being in stocks during the week of Thanksgiving through the end of the year. While there is never any guarantee, and year-to-year results can vary greatly, the period has shown a bullish consistency that is very rare. Another striking thing to note is the relatively benign nature of declines during those years when the year-end rally period does show a loss.

Sorry, you don't have access to this report

Upgrade your subscription plan to get access
Go to Dasboard
DATA &
TECHnologies
IndicatorEdge
‍
BackTestEdge
‍
Other Tools
‍
DataEdge API
RESEARCH
reports
Research Solution
‍
Reports Library
‍
actionable
Strategies
Trading Strategies
‍
Smart Stock Scanner
‍
FREE
RESOUrCES
Simple Backtest
Calculator
Simple Seasonality
Calculator
The Kelly Criterion
Calculator
Sentiment Geo Map
‍
Public Research Reports
‍
Free Webinar
COMPANY
‍
About
‍
Meet our Team
‍
In the News
‍
Testimonials
‍
Client Success Stories
Pricing
Bundle pricing
‍
Announcements
‍
FAQ
© 2024 Sundial Capital Research Inc. All rights reserved.
Setsail Marketing
TermsPrivacyAffiliate Program
Risk Disclosure: Futures and forex trading contains substantial risk and is not for every investor. An investor could potentially lose all or more than the initial investment. Risk capital is money that can be lost without jeopardizing ones’ financial security or life style. Only risk capital should be used for trading and only those with sufficient risk capital should consider trading. Past performance is not necessarily indicative of future results.

Hypothetical Performance Disclosure: Hypothetical performance results have many inherent limitations, some of which are described below. No representation is being made that any account will or is likely to achieve profits or losses similar to those shown; in fact, there are frequently sharp differences between hypothetical performance results and the actual results subsequently achieved by any particular trading program. One of the limitations of hypothetical performance results is that they are generally prepared with the benefit of hindsight. In addition, hypothetical trading does not involve financial risk, and no hypothetical trading record can completely account for the impact of financial risk of actual trading. for example, the ability to withstand losses or to adhere to a particular trading program in spite of trading losses are material points which can also adversely affect actual trading results. There are numerous other factors related to the markets in general or to the implementation of any specific trading program which cannot be fully accounted for in the preparation of hypothetical performance results and all which can adversely affect trading results.

Testimonial Disclosure: Testimonials appearing on this website may not be representative of other clients or customers and is not a guarantee of future performance or success.