
What you need to know about the Nasdaq High/Low Ratio

Key Points
- The percentage of Nasdaq daily new highs to daily new lows has been mainly on the low end of the range since late November 2021
- The real question is, "what do I do with this information?"
- Some pundits claim this is a bearish sign of weakness, while others claim it is a contrarian bullish signal - unfortunately, these claims are often based on subjective interpretation
- Let's take a closer look at how this information might be utilized in an objective manner
Where things stand
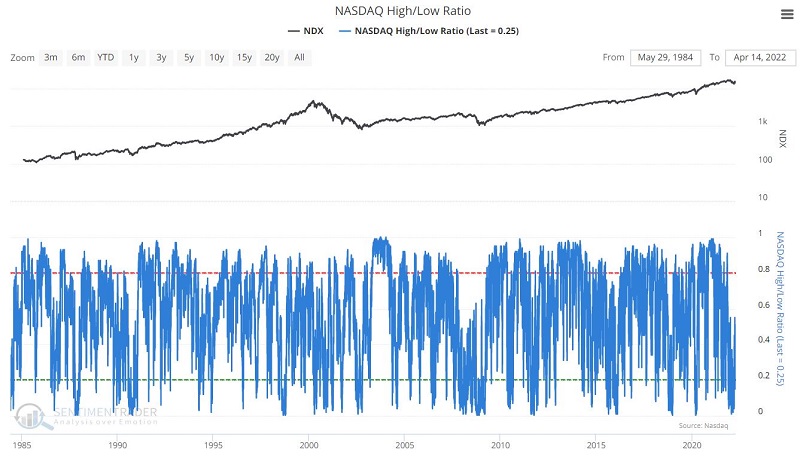
The indicator we will look at is the Nasdaq High/Low Ratio.
- New highs are the number of Nasdaq issues that closed at a new 52-week high today
- New lows are the number of Nasdaq issues that closed at a new 52-week low today
- The ratio is expressed as the number of issues that closed at a new high divided by new highs plus new lows
For example, if 100 Nasdaq issues closed at a new high and 30 Nasdaq issues closed at a new low, then the Nasdaq High/Low ratio for that day would be:
100 / (100 + 30) = 100 / 130 = 0.77
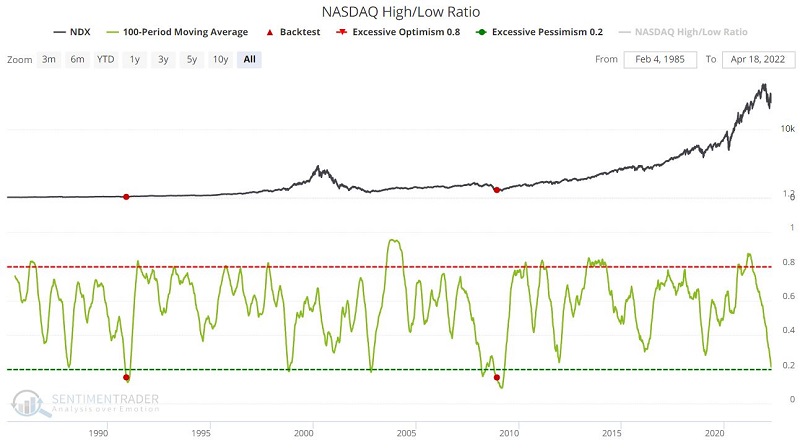
The chart below displays the daily indicator values since the late 1980s underneath the Nasdaq 100 Index graph.
This data series can be pretty volatile. The chart below displays a 100-day moving average of the daily Nasdaq High/Low Ratio to discern a longer-term trend. This creates a clearer picture of the long-term trend and highlights some meaningful highs and lows.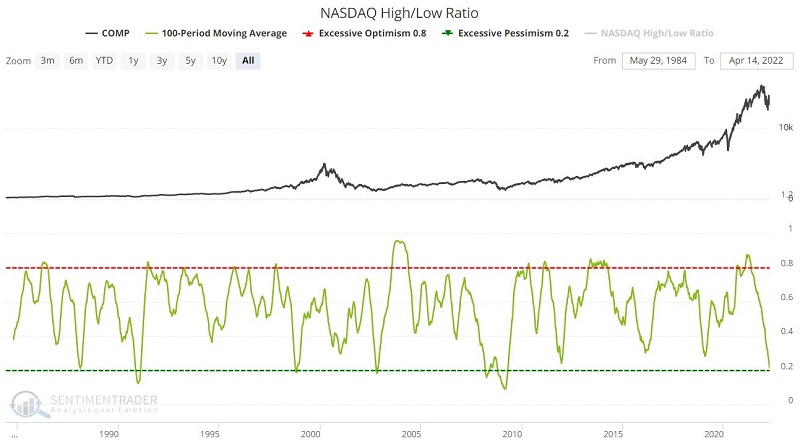
As you can see, the current reading is:
- In a clear downtrend
- Near the low end of the historical range
- But not extremely oversold
What can we do with this information? Some traders look for a given indicator as a "magic bullet" and try to find "one best way" to use it. However, the realities are:
- There are no infallible indicators
- Some indicators can be used in different ways
Let's illustrate these points.
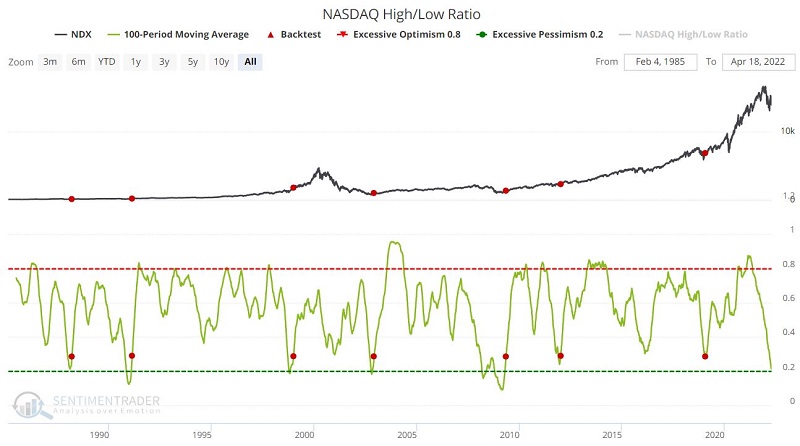
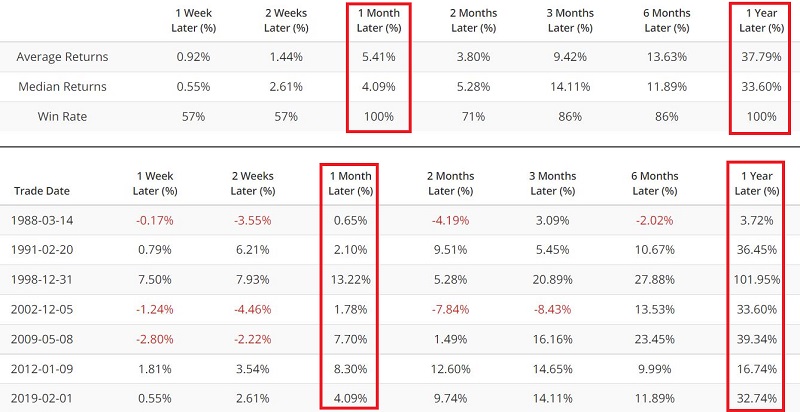
All readings below 0.20
The chart below displays all days when the Nasdaq High/Low Ratio 100-day average was below 0.20. You can run this test in the Backtest Engine.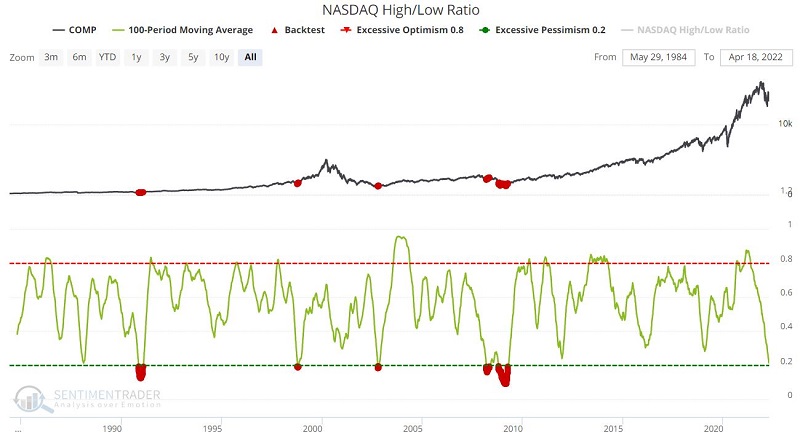
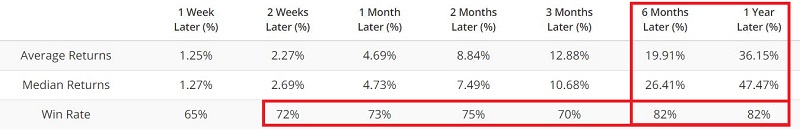
The performance results suggest that low readings present potential buying opportunities. However, sometimes an initial drop below 0.20 proves to be a prelude to a final plunge to the actual price low.
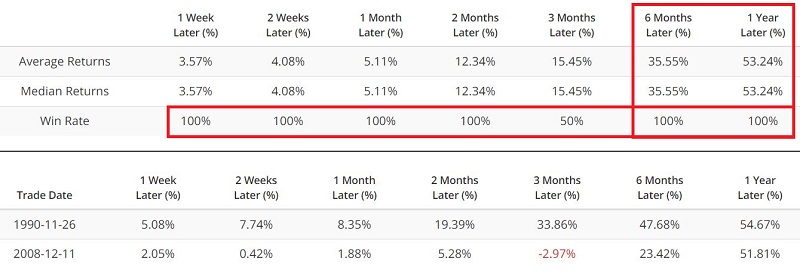
A cross below 0.15
Now let's look at an extreme reading. The chart below displays all days when the Nasdaq High/Low Ratio 100-day average crossed below 0.15. As you can see, this is extremely rare and has only happened twice. While this is not something you can base a trading strategy around, based on historical results (of an exceedingly low sample size of just two), any future such readings should get your attention as a potentially strong buying opportunity.
You can run this test in the Backtest Engine.
A crossed back above 0.28
The two methods above essentially involve using the indicator to "buy on weakness." But there are other alternatives for those who are not inclined to buy into a weak market.
The chart below displays all days when the Nasdaq High/Low Ratio 100-day average crossed above 0.28. In other words, the average first experiences significant weakness (i.e., the 100-day average drops below 0.28) and then shows signs of a meaningful rebound (i.e., crossing back above 0.28). You can run this test in the Backtest Engine.
While it might be an exaggeration to refer to this as an "All Clear" signal, it typically occurs when "the worst is over."
A cross above 0.80
Momentum and breadth are essential factors in the stock market. Many investors would intuitively assume that a cross above 0.80 by the 100-day average of the Nasdaq High/Low Ratio would serve as an "overbought" warning signal. However, this does not appear to be the case. A cross above 0.80 highlights an exceptionally strongly trending bull market, as shown in the numbers below.
The chart below displays all days when the Nasdaq High/Low Ratio 100-day average crossed above 0.80. You can run this test in the Backtest Engine.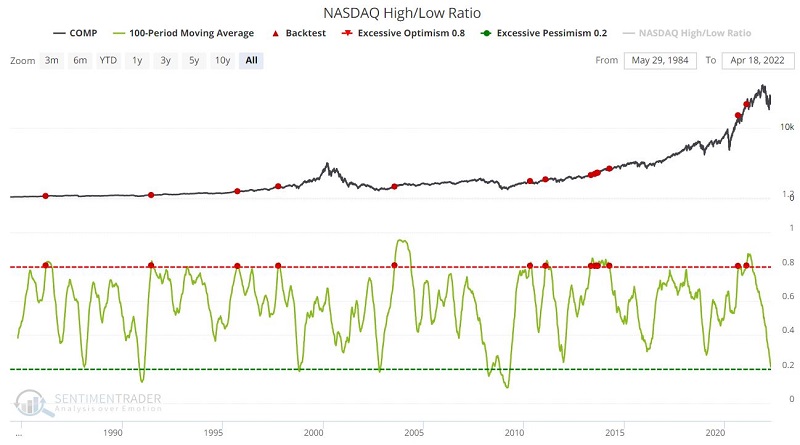
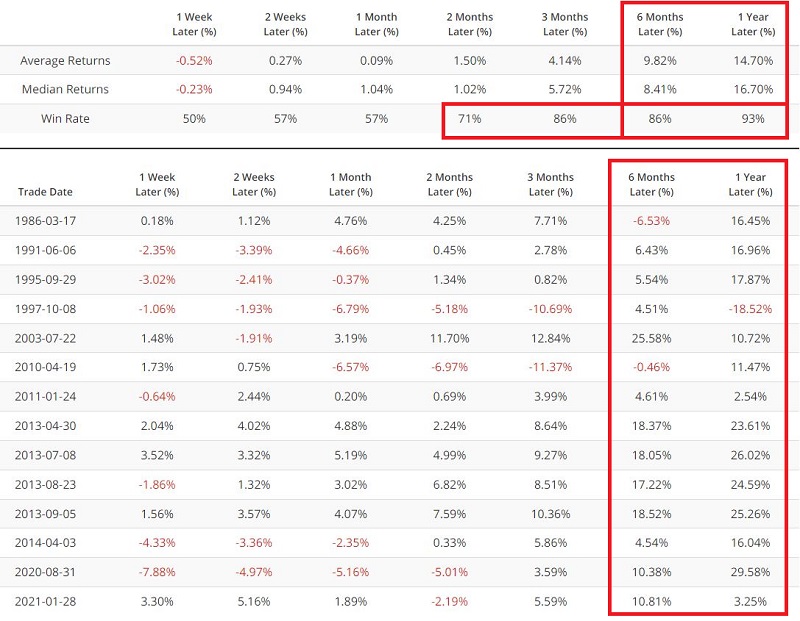 What the research tells us…
A high/low ratio downtrend typically accompanies periods of significant market weakness. However - and somewhat counterintuitively - a very low high/low typically marks the end of a bear market and can highlight an outstanding buying opportunity for investors willing to buy when fear is high. Fortunately for the more risk-averse investor, a rising high/low ratio can generate a potential "all clear" signal when it bounces off a significantly low reading.