
What to watch for in biotech

Key Points
- Biotech has been one of the hardest-hit sectors, down -59% since February 2021
- The sector will soon be entering the most critical seasonal time of year
- Sentiment is overdone to the bearish side
The Big Picture
The biotech sector today looks a lot like the energy sector several years ago - unwanted, unloved and in the midst of a punishing decline with seemingly no clear end in sight. And now here we are, a few years down the road and the stocks in the energy sector are about the only thing making new highs while the rest of the market declines.
The biotech sector is oversold enough that a sizeable rebound could unfold at any time. The reality though is that trying to catch the bottom in anything is a strategy fraught with peril. The main thing to remember is that nothing is in the doghouse forever. Given the growth potential and the current fear and loathing for this sector, it could certainly follow energy's lead in the years ahead, and once again become a market leader. For now, patient opportunism appears to be in order.
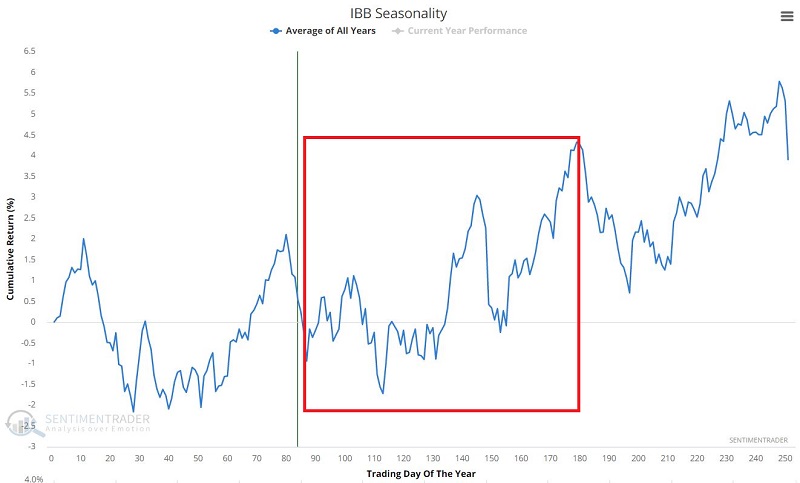
Biotech seasonality
The chart below displays the annual seasonal trend for ticker IBB (iShares Biotechnology ETF). A favorable portion of the year begins at the close of Trading Day of Year (TDY) #87 and extends through TDY #179. For 2022 this period extends from the close on 5/6/2022 through 9/27/2022.
For testing purposes, we will use:
- Ticker FBIOX (Fidelity Select Biotechnology mutual fund) from 1986 through 2000
- Ticker IBB (iShares Biotechnology ETF) from 2001 through 2005
- Ticker XBI (SPDR S&P Biotech ETF) since 2006
FBIOX is an actively managed index fund. IBB tracks the ICE Biotechnology Index, and XBI tracks the S&P Biotechnology Select Index. I favor XBI as it trades roughly five times as many shares and over 20 times as many options per day as ticker IBB.
The chart below displays the hypothetical cumulative % return from holding the biotech funds listed above only during the seasonally favorable period, each year since 1986.
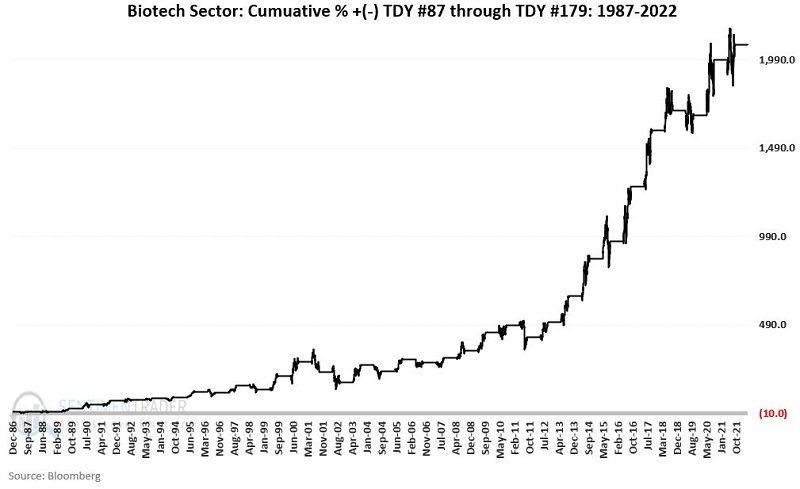
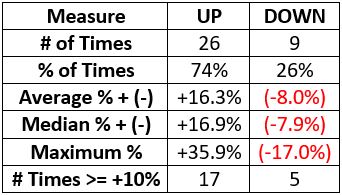
The table below displays a summary of performance.
Now consider the performance of biotech stocks for the rest of the year, i.e., all trading days NOT between #88 and #179.
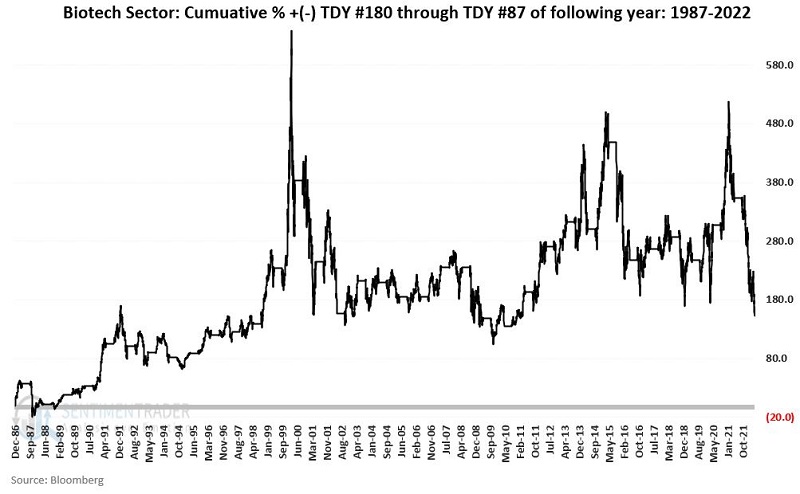
The difference in performance becomes more apparent when we overlay both charts into one graph.
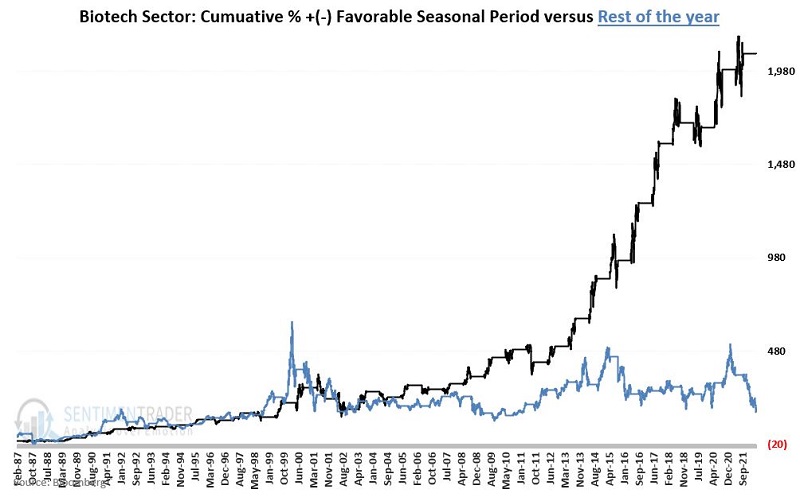
- The favorable period (TDY #88 through TDY #179) has gained +2,075%
- The rest of the year (TDY #1 through #87 and #180 through the end of the year) has gained +168%
Diving in based solely on seasonality is a risky play. Traders should keep an eye open for some sign of reversal in price and/or sentiment (as detailed next).
Waiting for sentiment to turn
Sentiment in the biotech sector appears to move in pretty long-term waves. Likewise, the price action in this sector is highly volatile, and prices can go to extremes very quickly, both to the upside and the downside. One of the better approaches involves waiting for sentiment to move to a long-term extreme and then reverse.
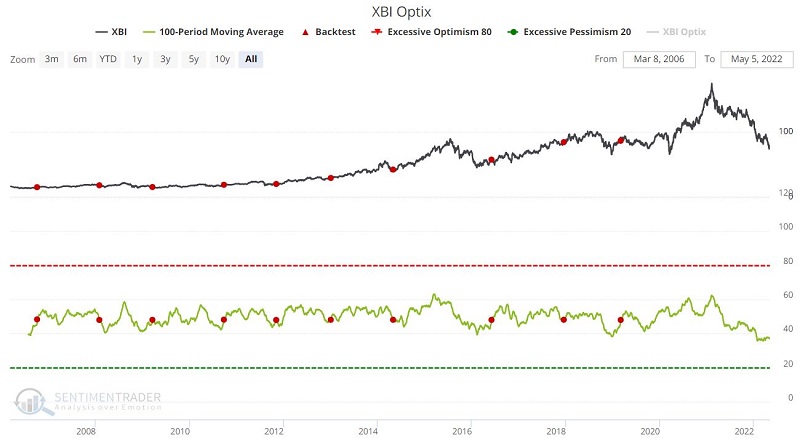
The chart below displays occasions when the 100-day average of XBI Optix crossed above 48 for the first time in a year. You can run this test in the Backtest Engine.
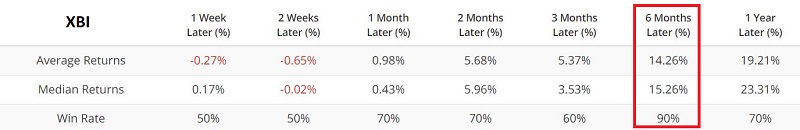
The table below displays a summary of XBI performance following previous signals.
Note that the 100-day moving average is still below 40%, so this signal is likely some time away from triggering.
One more sign of an unloved sector
The screen shot below (courtesy of Charles Schwab and @LizAnnSonders) displays the number of biotech stocks (in the Nasdaq Biotechnology Index) whose stocks trade for less than the value of the cash the companies have on hand. Presently, over 20% of the stocks in the index trade for less than cash on hand.
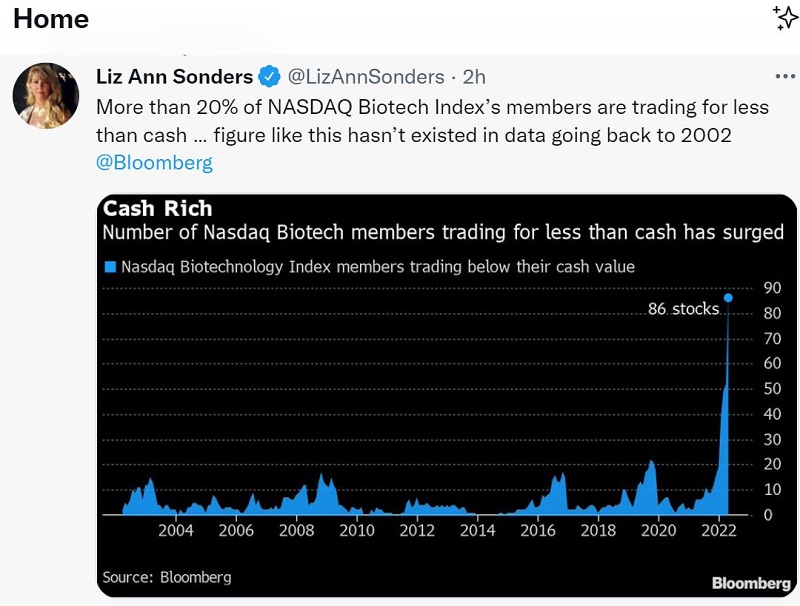
This is not a timing indicator per se and does not mean that a turnaround is imminent. It is however, an overwhelming indication of how unloved this sector is and offers proof that investors have thrown in the towel. This is the type of capitulation that typically sets the stage for an eventual turnaround, and offers one more reason why investors should keep an eye on the biotech sector.
What the research tells us…
The biotech sector is entering an important time of year that has historically accounted for the bulk of annual gains. However, it enters this period in something of a freefall, so the notion of piling in based only on seasonality is fraught with peril. While jumping in while shouting "YOLO" may not be the right move, another mistake would be turning your back completely on this sector.
Any bottom could trigger a fast and furious rally with deeply oversold prices and a looming favorable seasonal period. So, investors should keep a close eye on price action. Likewise, investors should monitor XBI Optix. If the 100-day average for Optix crosses back above 48 between now and September, it could signal that better days are finally ahead.