
What to make of PPI inflation

Key points
- The Producer Price Index (PPI) measures the average change over time in the selling prices received by domestic producers for their output
- Changes in the PPI can have a profound impact on the economy and, by extension, the stock market
- PPI is a significant negative for stocks when it reaches an extreme
- When PPI is not at an extreme, the implications are generally favorable for stocks
What the Producer Price Index measures
Per Investopdia.com: The Producer Price Index (PPI) measures the average change over time in the prices domestic producers receive for their output. It is a measure of inflation at the wholesale level that is compiled from thousands of indexes measuring producer prices by industry and product category. The U.S. Bureau of Labor Statistics (BLS) publishes the index monthly. The PPI is different from the consumer price index (CPI), which measures the changes in the price of goods and services consumers pay.
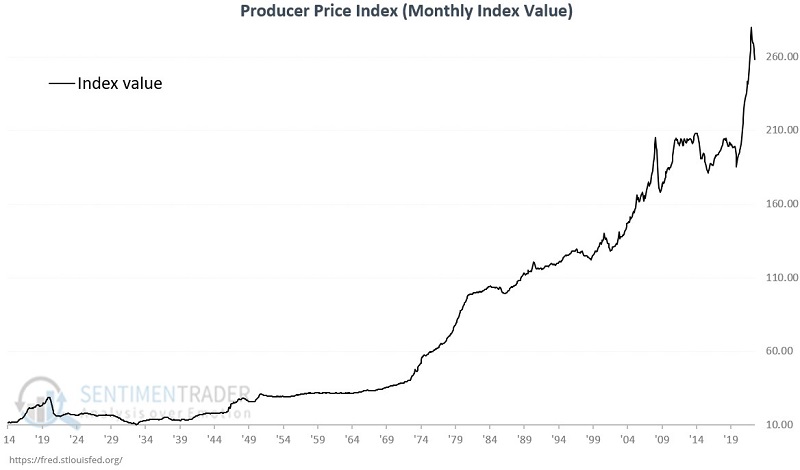
The chart below displays the raw monthly values for PPI since 1914. Notice that the value tends to rise over time primarily due to normal long-term inflation.
What really matters to the stock market is not the raw value but the rate of change. The rate-of-change in PPI identifies when inflation or deflation is accelerating and/or reaching an extreme level. The chart below displays the 12-month % rate-of-change for PPI since 1914.
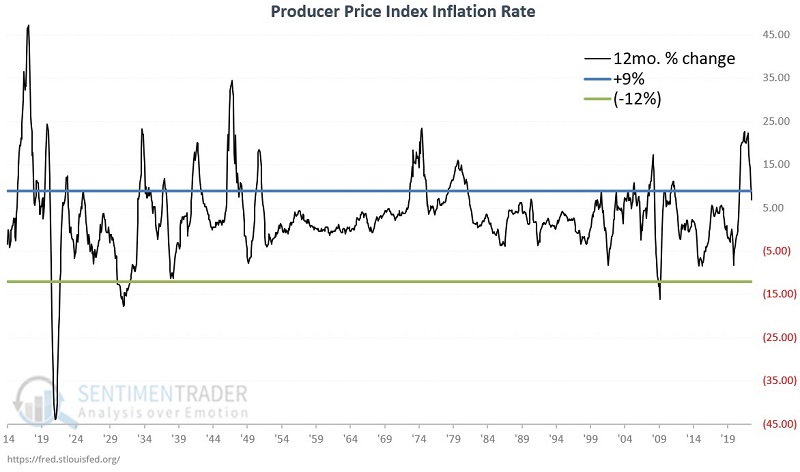
In the chart above, you can note extreme high and low readings. The higher the reading, the more extreme the rate of inflation, and the lower the reading, the more extreme the rate of deflation. Extreme inflation or deflation creates a great deal of uncertainty within the economy. During periods of high inflation, businesses and consumers must reassess their spending based on higher prices. During periods of deflation, spending tends to contract as people instinctively wait for an even lower price before buying (which can cause the economy to collapse - and is why severe deflation is worse than extreme inflation).
The simplest way to use PPI readings as an investor
For testing purposes, when we say "PPI," from here on, we are referring to the 12-month percentage rate of change in the raw monthly value. The time that PPI inflation really matters to the stock market is when it reaches an extreme level. Defining "extreme" is somewhat arbitrary, but for our purposes, we apply the following rules:
- 9% or above = Extreme inflation
- Below 9% and above -12% = Normal inflation
- -12% or below = Extreme deflation
Also, note I update this indicator - and measure stock market performance - only at the end of the month.
Stock market performance during extreme PPI inflation
The chart below displays the growth of $1 invested in the Dow Jones Industrial Average only during those months when the previous month ended, with PPI inflation above +9%.
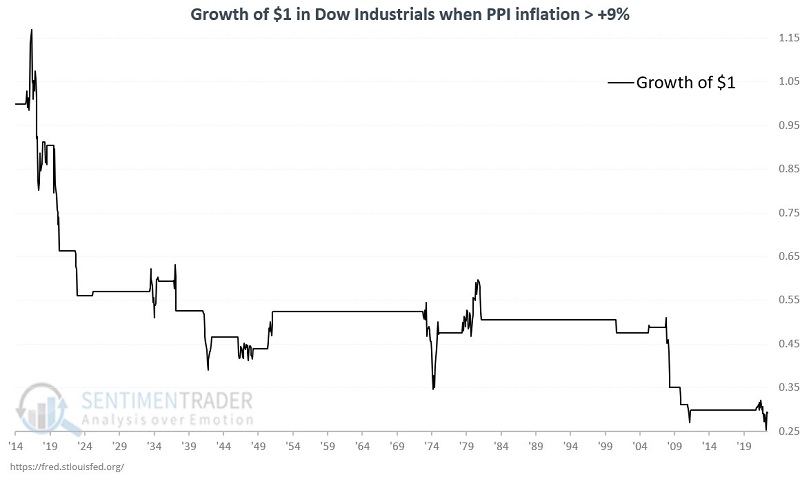
From 1914-07-31 through 2022-12-31, an investor who bought and held the Dow only when PPI inflation was above +9% would have lost -70.7%.
Stock market performance during extreme PPI deflation
The chart below displays the growth of $1 invested in the Dow Jones Industrial Average only during those months when the previous month ended, with PPI inflation below -12%.
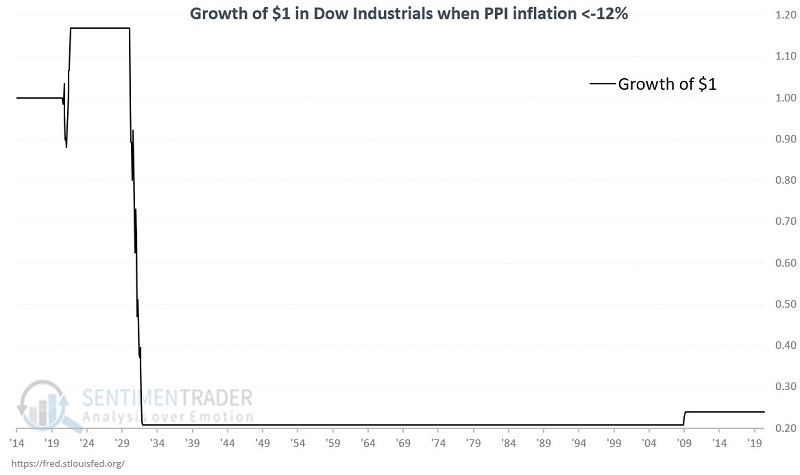
From 1914-07-31 through 2022-12-31, an investor who bought and held the Dow only when PPI inflation was below -12% would have lost -76.0%.
Combining extreme PPI inflation and deflation
The chart below (drawn on a logarithmic scale) displays the growth of $1 invested in the Dow Jones Industrial Average only during those months when the previous month ended, with PPI inflation either above +9% or below -12%.
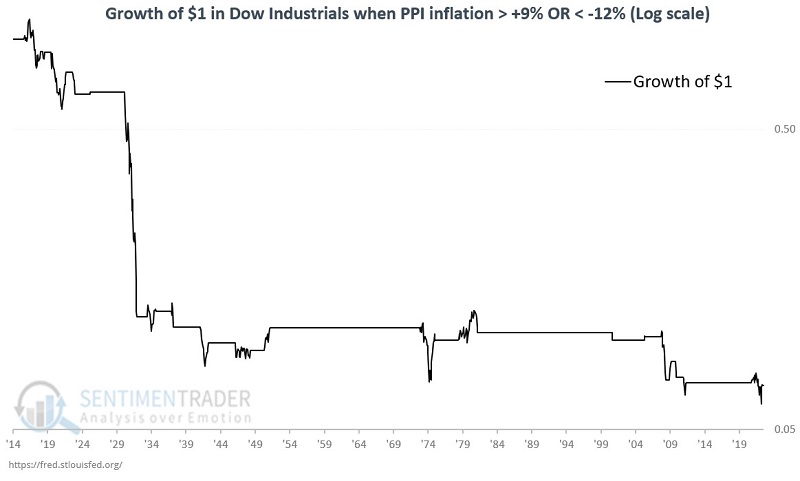
From 1914-07-31 through 2022-12-31, an investor who held the Dow only when PPI inflation was above +9% or below -12% would have lost a staggering -93.0%.
Stock market performance during normal inflation
Now let's look at stock market performance when PPI inflation is not at an extreme level. The chart below (drawn on a logarithmic scale) displays the growth of $1 invested in the Dow Jones Industrial Average only during those months when the previous month ended with PPI inflation at or below +9% and at or above -12%.
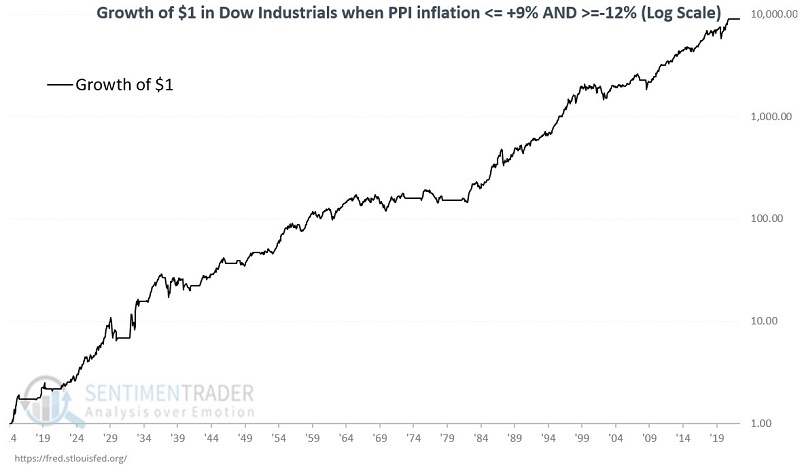
From 1914-07-31 through 2022-12-31, an investor who bought and held the Dow only when PPI inflation was at or below +9% and at or above would have gained +925,100% - versus +64,833% for a buy-and-hold investor.
Comparing results
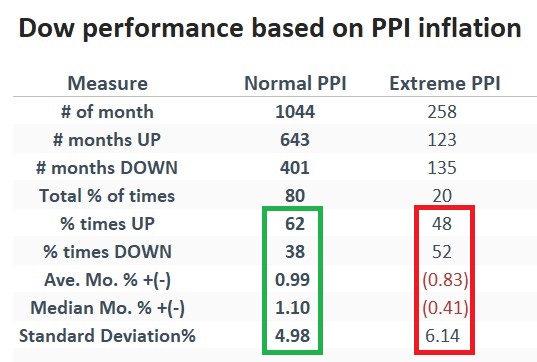
The table below summarizes monthly Dow performance depending on whether PPI inflation is normal or extreme.
PPI inflation is back in the normal range
During December 2022, PPI inflation fell from +10.3% to +8.2%. While +8.2% is still a high inflation rate, that reading pushed our indicator back into the "normal" range. So this indicator is now considered favorable (or, at the very least, "not unfavorable") for stocks.
What the research tells us…
The stock market hates uncertainty. Few things cause more uncertainty than extreme inflation or extreme deflation. As shown in the charts and tables above, there is no guarantee that the stock market will advance if inflation is normal. Likewise, it is not a sure thing that the market will decline if PPI inflation or deflation reaches an extreme. But the disparity in stock market performance highlighted above suggests that investors play defense when PPI exits the normal range and give the market the bullish benefit of the doubt when it re-enters that range.