
What to expect in natural gas

Key points:
- Natural gas has a history of moving in a highly cyclical fashion
- Being aware of the current seasonal status can help keep traders on the right side of this volatile market
- The strongest seasonal period of the year begins in mid-September and will last until late October
Natural gas seasonality
Natural gas is about to enter its most favorable time of the year.
The chart below shows the annual seasonal trend for natural gas futures. The green and red boxes highlight alternating favorable and unfavorable seasonal periods. There are two favorable periods (green boxes) and two unfavorable periods (red boxes).
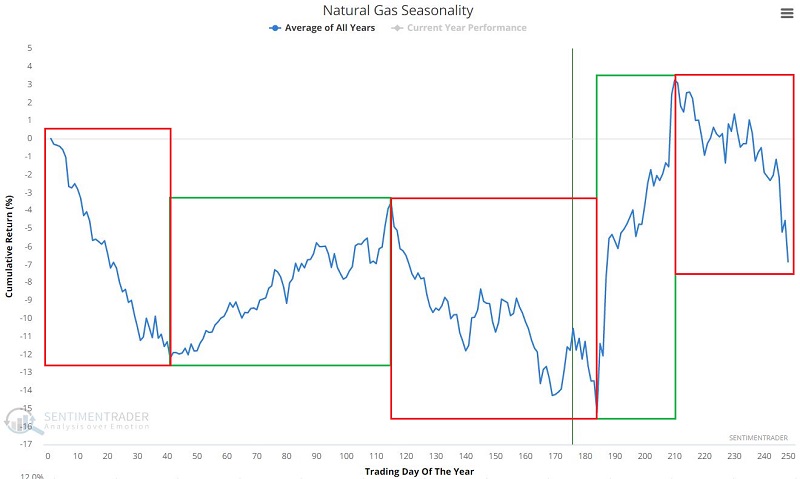
In the tests below, each period is referenced by its "Trading Days of the Year" (or TDY for short). Each period begins or ends at the close of trading for the TDY referenced. Our data counts any day on which electronic trading occurs.
The two favorable periods for natural gas are:
- TDY #41 through TDY #115
- TDY #184 through TDY #210
The two unfavorable periods for natural gas are:
- TDY #115 through TDY #184
- TDY #210 through TDY #41 of the following year
The current unfavorable period began at the close on July 13 and ends on September 16. The next favorable period - historically, the strongest period of the year - starts then and ends on October 24.
Natural gas favorable periods
The chart below displays the hypothetical return achieved by holding a long position in natural gas futures only during the favorable periods marked by green boxes in the chart above.
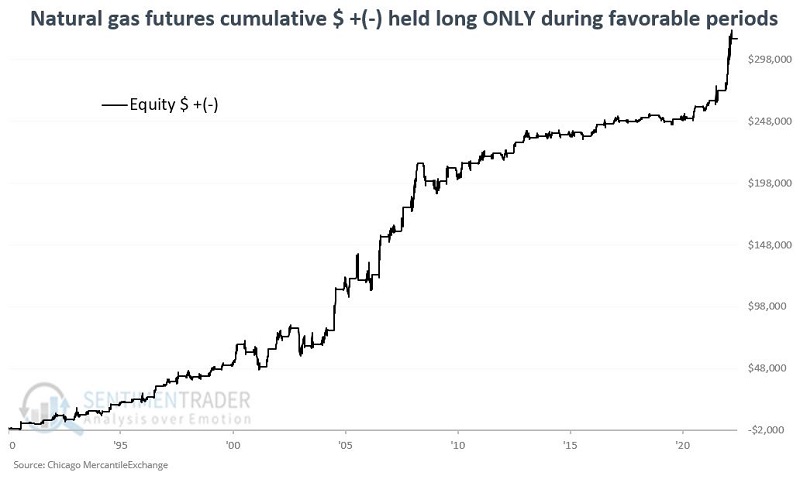
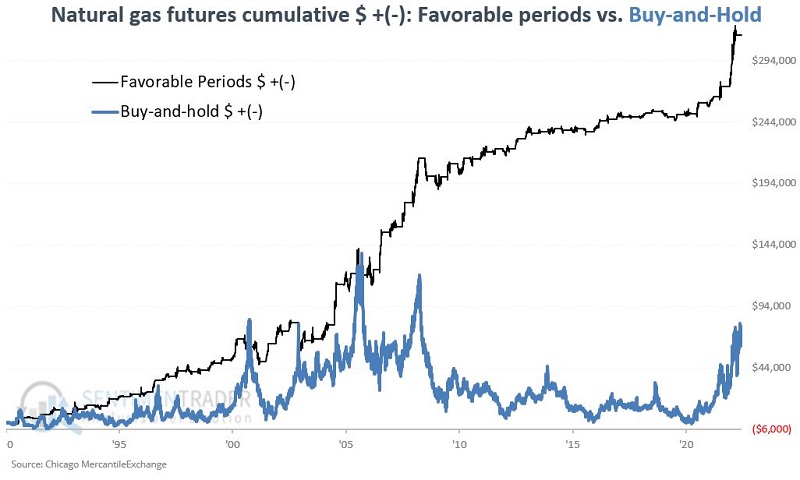
From 1990-04-03 through 2022-09-07, the cumulative gain for natural gas futures was +$314,890 versus +$62,020 for a buy-and-hold approach. The chart below displays the performance during favorable periods versus buying and holding natural gas.
Natural gas unfavorable periods
The chart below displays the hypothetical return achieved by holding a long position in natural gas futures only during the unfavorable periods marked by red boxes in the chart above.
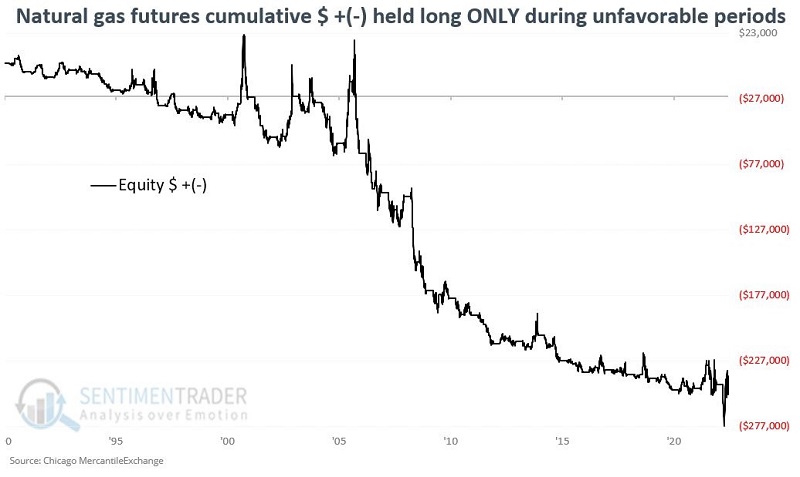
From 2006-07-03 through 2022-09-07, the cumulative loss during the red box unfavorable periods was -$252,870 versus +$62,020 for a buy-and-hold approach. Nevertheless, it is crucial to take careful note of the sharp spikes that can occur from time to time and be prepared to play defense when necessary.
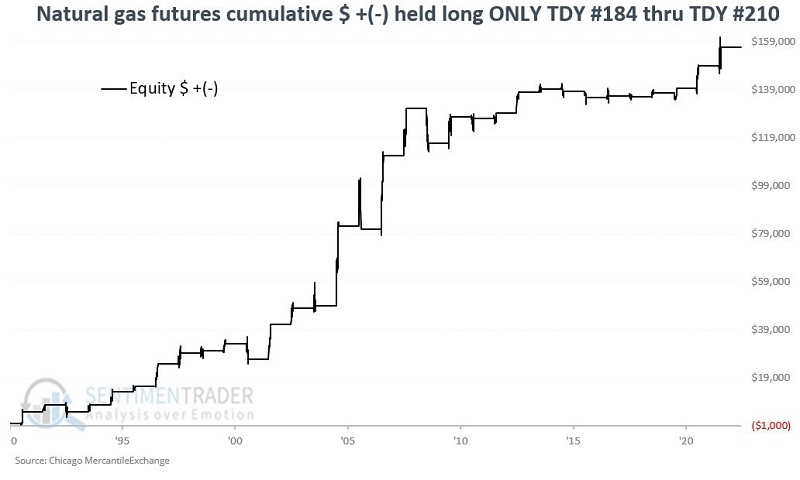
The upcoming favorable period
The next favorable period - historically, the strongest period of the year - starts on 2022-09-16 and ends on 2022-10-24. The chart below displays the cumulative $ loss for natural gas futures held long only during this period each year.
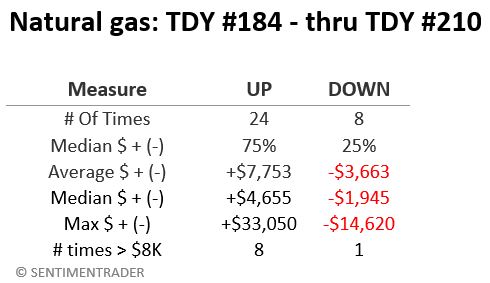
The table below displays a summary of performance during this particularly favorable period.
What the research tells us…
At the very least, the results above indicate that natural gas is indeed a highly cyclical commodity. The caveat is that with seasonality, there is no guarantee that future results will emulate those in the past. It should also be noted that natural gas futures can be highly volatile and should only be traded by well-capitalized traders.
With that in mind, a trader might consider holding a long position in this market if the calendar is within one of the favorable periods and one's preferred indicators confirm a bullish trend. A trader might also consider holding a short position if the calendar is within one of the unfavorable periods indicators confirm a bearish trend.