Data &
Technology
Research
Reports
Report Solutions
Reports Library
Actionable
Strategies
Free
Resources
Simple Backtest Calculator
Simple Seasonality Calculator
The Kelly Criterion Calculator
Sentiment Geo Map
Public Research Reports
Free Webinar
Pricing
Company
About
Meet Our Team
In the News
Testimonials
Client Success Stories
Contact
Log inLoginSign up
< BACK TO ALL REPORTS

What this model is saying about a new bear market

Jason Goepfert
2020-11-16
A bear market probability model has climbed above 50% again, as fundamental, valuation, and price-based inputs recover.

For the first time in half a year, there is more than a 50% probability that stocks will fall into a bear market in the coming months.

The Bear Market Probability Model climbed to a 50-year high in August 2018, then plunged to a 7-year low by May of this year. This is a model outlined by Goldman Sachs using five inputs covering fundamental, valuation, and price-based metrics.

The model will drop as conditions deteriorate until it reaches a trough during bear markets (usually). It will rise as conditions improve. This seems counter-intuitive, but a rising probability of a bear market tends to be a good thing, until it reaches a very high level.

Bear market probability model

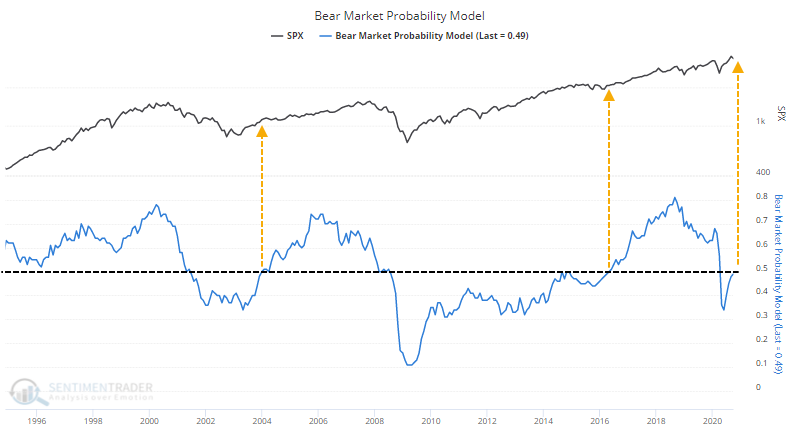
When the model had been below 50% for at least 6 months and then recovered, forward returns were mostly positive. Over the next 1-3 years, 10 of the 12 signals sported a positive return, though the average returns weren't very impressive.


What else is happening

These are topics we explored in our most recent research. For immediate access with no obligation, sign up for a 30-day free trial now.

  • Full results after Bear Market Probability rises above 50%
  • A look at the percentage of stocks, industries, sectors, and global indexes in bear markets
  • Forward returns over the past 50 years when global markets cycle from mostly bear markets to not

Stat Box

Even with the jump in stock indexes, there are at least a handful of stocks that show pessimism. Our database shows 10 stocks within the S&P 1500 that are currently trading above their 200-day moving averages and yet have a 5-day Optimism Index below 25.


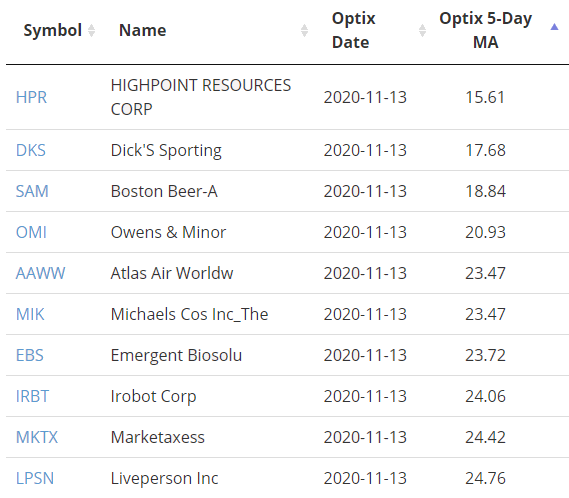
Sentiment from other perspectives

We don't necessarily agree with everything posted here - some of our work might directly contradict it - but it's often worth knowing what others are watching.

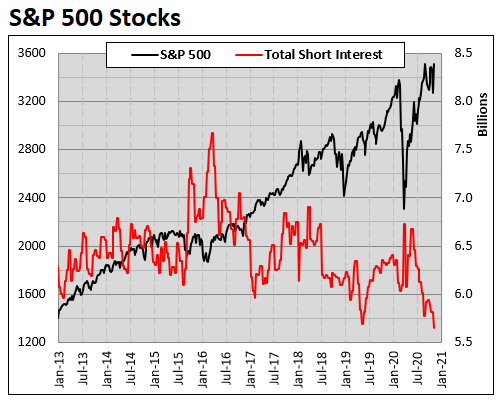
1. After taking some losses due to a rising market, short sellers have tucked in their collective tails. Short interest among stocks in the S&P 500 has dropped below 6 billion shares. Sounds like a lot, but it's the lowest amount since the summer of 2019. High short interest tends to be a boon for stocks, while low short interest is...not, but it's less reliable as an indicator. [Schaeffer's Investment Research]

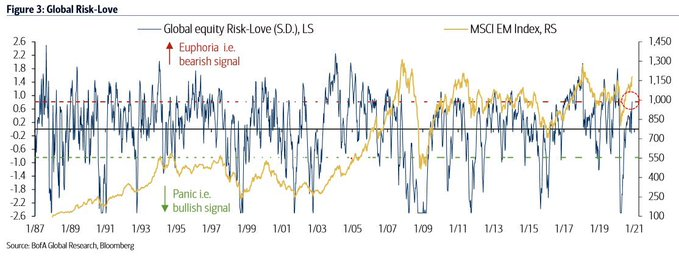
2. Global investors are back to loving stocks. An aggregate measure of sentiment has rebounded sharply from its pandemic lows and is now the highest in months, nearing the "euphoria" threshold. [Bank of America]

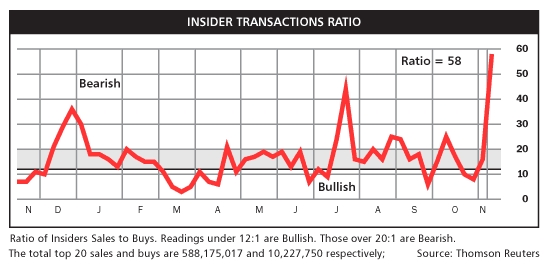
3. Who's not hot on stocks? Corporate insiders. According to Thomas Reuters, insider sales outnumber buys by nearly 60-to-1 in the latest week. But beware - there are seasonal influences on this data, and spikes in insider sales have not been effective at consistently leading to equity market declines. [Barron's]

DATA &
TECHnologies
IndicatorEdge
‍
BackTestEdge
‍
Other Tools
‍
DataEdge API
RESEARCH
reports
Research Solution
‍
Reports Library
‍
actionable
Strategies
Trading Strategies
‍
Smart Stock Scanner
‍
FREE
RESOUrCES
Simple Backtest
Calculator
Simple Seasonality
Calculator
The Kelly Criterion
Calculator
Sentiment Geo Map
‍
Public Research Reports
‍
Free Webinar
COMPANY
‍
About
‍
Meet our Team
‍
In the News
‍
Testimonials
‍
Client Success Stories
Pricing
Bundle pricing
‍
Announcements
‍
FAQ
© 2024 Sundial Capital Research Inc. All rights reserved.
Setsail Marketing
TermsPrivacyAffiliate Program
Risk Disclosure: Futures and forex trading contains substantial risk and is not for every investor. An investor could potentially lose all or more than the initial investment. Risk capital is money that can be lost without jeopardizing ones’ financial security or life style. Only risk capital should be used for trading and only those with sufficient risk capital should consider trading. Past performance is not necessarily indicative of future results.

Hypothetical Performance Disclosure: Hypothetical performance results have many inherent limitations, some of which are described below. No representation is being made that any account will or is likely to achieve profits or losses similar to those shown; in fact, there are frequently sharp differences between hypothetical performance results and the actual results subsequently achieved by any particular trading program. One of the limitations of hypothetical performance results is that they are generally prepared with the benefit of hindsight. In addition, hypothetical trading does not involve financial risk, and no hypothetical trading record can completely account for the impact of financial risk of actual trading. for example, the ability to withstand losses or to adhere to a particular trading program in spite of trading losses are material points which can also adversely affect actual trading results. There are numerous other factors related to the markets in general or to the implementation of any specific trading program which cannot be fully accounted for in the preparation of hypothetical performance results and all which can adversely affect trading results.

Testimonial Disclosure: Testimonials appearing on this website may not be representative of other clients or customers and is not a guarantee of future performance or success.