Data &
Technology
Research
Reports
Report Solutions
Reports Library
Actionable
Strategies
Free
Resources
Simple Backtest Calculator
Simple Seasonality Calculator
The Kelly Criterion Calculator
Sentiment Geo Map
Public Research Reports
Free Webinar
Pricing
Company
About
Meet Our Team
In the News
Testimonials
Client Success Stories
Contact
Log inLoginSign up
< BACK TO ALL REPORTS

What the violent rotation out of Growth stocks means for Value

Jason Goepfert
2022-01-12
Investors have rotated violently from Growth to Value stocks over the past few months. A low-stress way to bet on positive silver seasonality.

Value sees a violent rotation from Growth

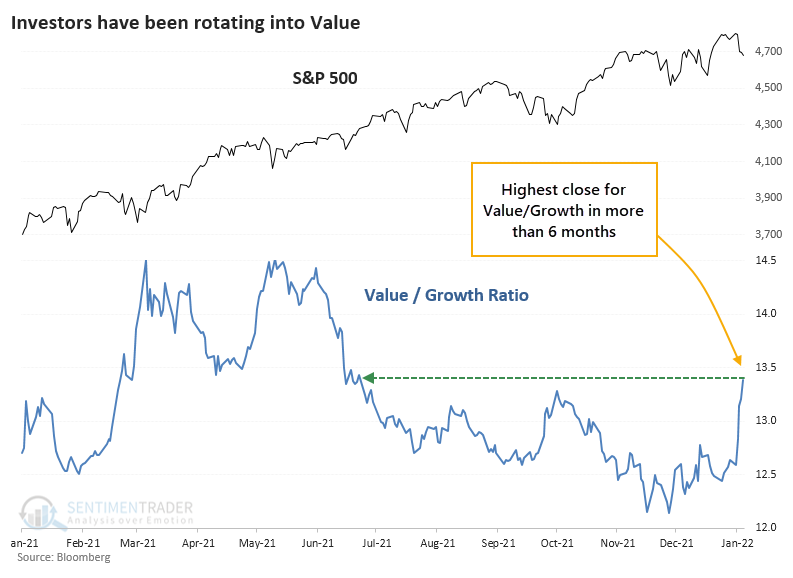
One of the most vicious reversals of the new year has been the rotation out of Growth and into Value. After plunging to nearly a 20-year low late last year, the ratio between Value and Growth factors has soared. On Monday, it reached a 6-month high, surpassing its peak from October.

Investors have rotated out of Growth into Value

This is yet the latest temptation for Value investors. Previous rallies were nothing but siren songs, but hope springs eternal. At some point, valuations have to matter. Right?

There may be a silver lining here for those who insist on actual profit-earning businesses that aren't absurdly speculative. After the Value/Growth ratio cycled from a 1-year low to a 6-month high within 3 months, Value continued to outperform in the months ahead. 

For the broader market, it was a mixed blessing. One might reasonably assume that a sudden shift toward Value would be a dire warning for the S&P 500, but that wasn't really the case. 

Stat box

More than 50% of Energy stocks closed at a 52-week high on Tuesday. Over the past 20 years, our Backtest Engine shows that the XLE fund gained further during the next 2 weeks after 24 of the 61 previous days.


A low-stress bet on silver seasonality

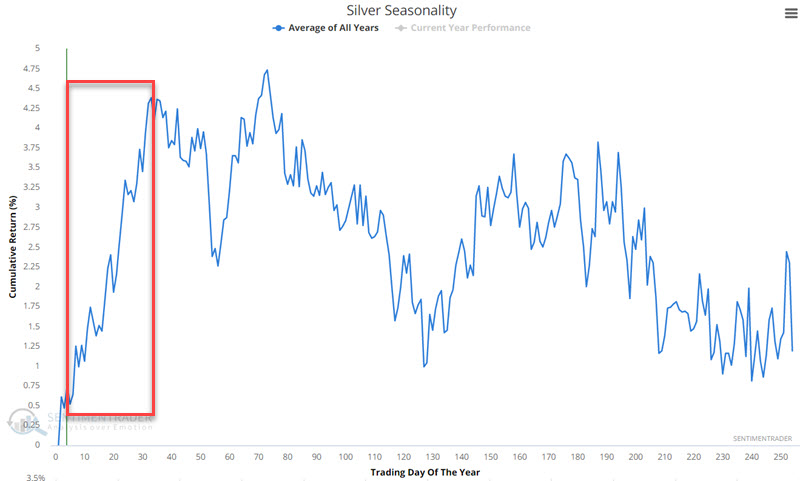
Jay showed that silver is presently within a seasonally favorable period. Specifically, this favorable period lasts through mid-February. 

Silver's positive seasonality window

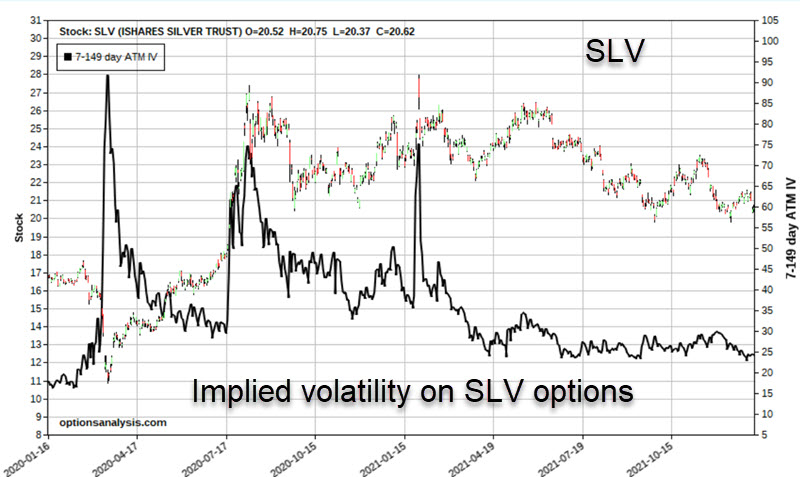
The chart below shows that the implied volatility (IV) for options on SLV is presently towards the low end of the historical range. In layman's terms, this means that the amount of time premium built into SLV options is relatively low, i.e., SLV options are "cheap" (remember, the higher the IV, the more time premium built into the options, and the lower the IV, the less time premium built into the options). 

Low implied volatility on SLV silver options

Jay then showed a way for a trader to construct a low-stress way to bet on the positive seasonal window without a lot of capital commitment.

DATA &
TECHnologies
IndicatorEdge
‍
BackTestEdge
‍
Other Tools
‍
DataEdge API
RESEARCH
reports
Research Solution
‍
Reports Library
‍
actionable
Strategies
Trading Strategies
‍
Smart Stock Scanner
‍
FREE
RESOUrCES
Simple Backtest
Calculator
Simple Seasonality
Calculator
The Kelly Criterion
Calculator
Sentiment Geo Map
‍
Public Research Reports
‍
Free Webinar
COMPANY
‍
About
‍
Meet our Team
‍
In the News
‍
Testimonials
‍
Client Success Stories
Pricing
Bundle pricing
‍
Announcements
‍
FAQ
© 2024 Sundial Capital Research Inc. All rights reserved.
Setsail Marketing
TermsPrivacyAffiliate Program
Risk Disclosure: Futures and forex trading contains substantial risk and is not for every investor. An investor could potentially lose all or more than the initial investment. Risk capital is money that can be lost without jeopardizing ones’ financial security or life style. Only risk capital should be used for trading and only those with sufficient risk capital should consider trading. Past performance is not necessarily indicative of future results.

Hypothetical Performance Disclosure: Hypothetical performance results have many inherent limitations, some of which are described below. No representation is being made that any account will or is likely to achieve profits or losses similar to those shown; in fact, there are frequently sharp differences between hypothetical performance results and the actual results subsequently achieved by any particular trading program. One of the limitations of hypothetical performance results is that they are generally prepared with the benefit of hindsight. In addition, hypothetical trading does not involve financial risk, and no hypothetical trading record can completely account for the impact of financial risk of actual trading. for example, the ability to withstand losses or to adhere to a particular trading program in spite of trading losses are material points which can also adversely affect actual trading results. There are numerous other factors related to the markets in general or to the implementation of any specific trading program which cannot be fully accounted for in the preparation of hypothetical performance results and all which can adversely affect trading results.

Testimonial Disclosure: Testimonials appearing on this website may not be representative of other clients or customers and is not a guarantee of future performance or success.