
What the Silver/Gold Ratio tells us about Silver right now

Key points
- Silver has been on a tear recently, yet remains relatively low-priced relative to Gold
- The Silver/Gold Ratio (SGR) remains within a historically low range
- History suggests that Silver may still have significant upside potential in the year ahead
The Silver/Gold Ratio
We will use weekly closing prices for silver and gold rather than daily data for our purpose. At the end of each week, the closing price for silver is divided by the price of gold. My data involves a continuous futures contract from Bloomberg for silver and the London PM fix price for gold. Some may argue that this is not "apples to apples," but for better or worse, it is what I use.
The chart below displays the Silver/Gold Ratio since the first week of 1975. This ratio has swooped and soared dramatically over the years. In the tests below, we will focus on whether the ratio was above or below the 0.12 level, which is highlighted as a horizontal blue line.
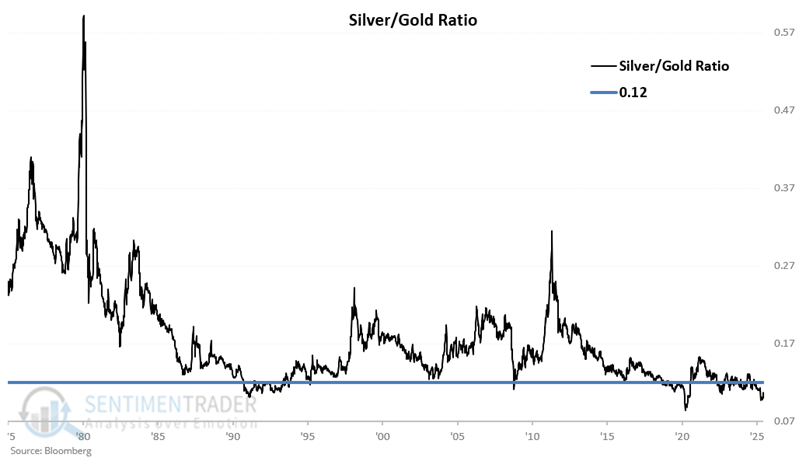
Let's examine silver performance depending on whether the Silver/Gold Ratio (SGR) is below or above 0.12.
Applying trading "rules" to achieve objective results
For the record, what follows is not intended to be viewed or used as a standalone trading model. However, for our purpose, we will apply trading rules to make the interpretation objective/systematic.
The rules:
- Buy silver if the SGR drops to 0.12 or below
- Hold for 52 weeks
- If the SGR is below 0.12 during the original 52-week holding period, then extend the holding period for an additional 52 weeks.
To be clear, for this test, if the SGR drops below 0.12, we buy silver and hold it for 52 weeks. If it remains or drops back below 0.12 during that original 52-week holding period, we extend the holding period an additional 52 weeks.
So if, for example, the SGR drops below 0.12 and stays there for 26 weeks, our total holding period would ultimately be 78 weeks. After 52 weeks have passed since the most recent SGR reading below 0.12, this "strategy" would sell silver and wait for another SGR drop below 0.12 before buying again.
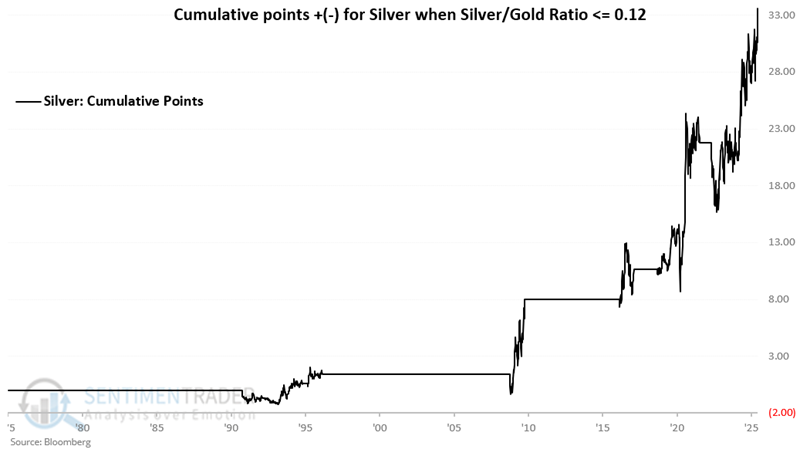
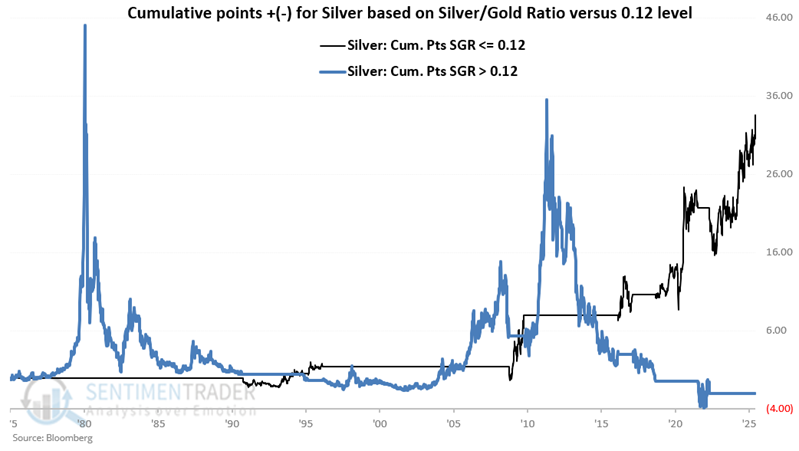
The chart below shows the cumulative gain in silver points if held for 52 weeks after any weekly SGR reading of 0.12 or below.
The table below displays the hypothetical performance for silver during the holding periods created by the rules above.
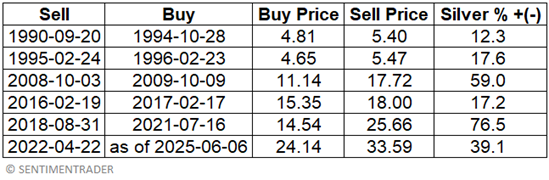
The cumulative gain for silver during the holding periods using the rules above was +31.20 points through 2025-06-06. To better appreciate these results, let's examine silver performance when the SGR exceeds 0.12.
Silver price action while the Silver/Gold Ratio > 0.12 for 52 or more weeks
Now, let's look at silver performance during periods when the SGR was not below 0.12 for at least 52 weeks.
The chart below displays the cumulative points gained or lost by silver if held only when the SGR had not been below 0.12 for at least 52 weeks.
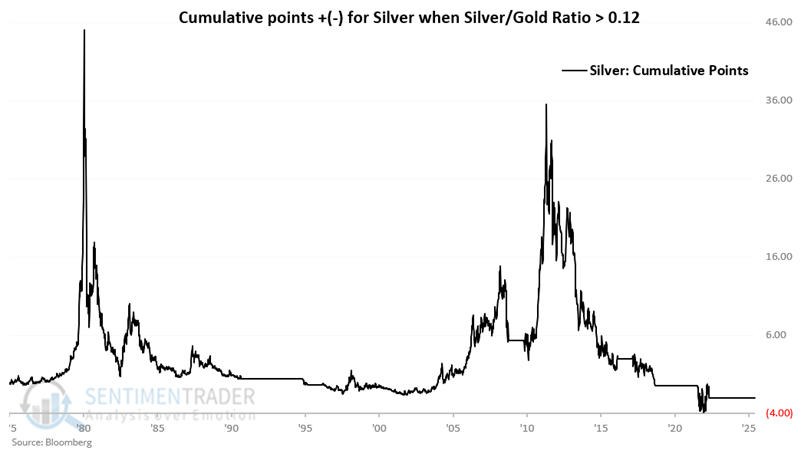
Ultimately, from 1975-01-03 through 2025-06-06, the cumulative performance was a loss of -1.96 points. This meager number belies the incredible roller coaster performance along the way.
No one suggests entering and maintaining a short position in silver based solely on this rule. The key point to note is the disparity in performance from that above. The chart below overlays the two hypothetical equity curves from above to better illustrate.
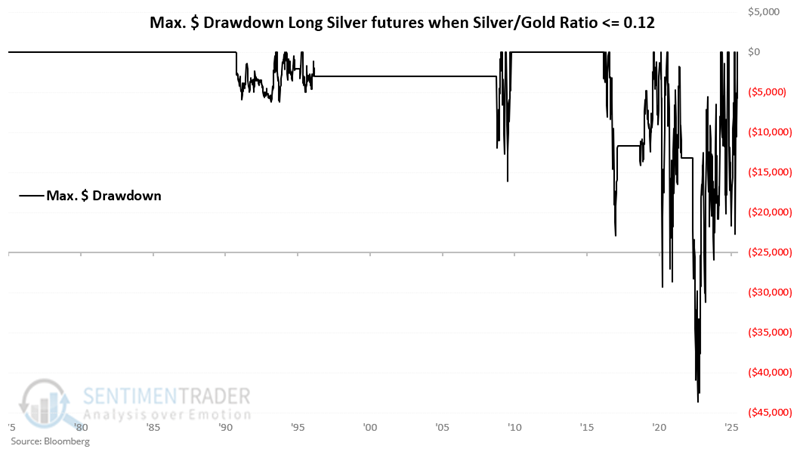
The odds favor silver when it is undervalued relative to gold. However, please note that there is no "smooth sailing" involved. The chart below displays the hypothetical maximum dollar drawdown experienced from holding a long position in silver futures during the favorable periods detailed above. The results in the chart below are a big part of why we suggest traders view this "strategy" as weight of the evidence and not as an automated trading system.
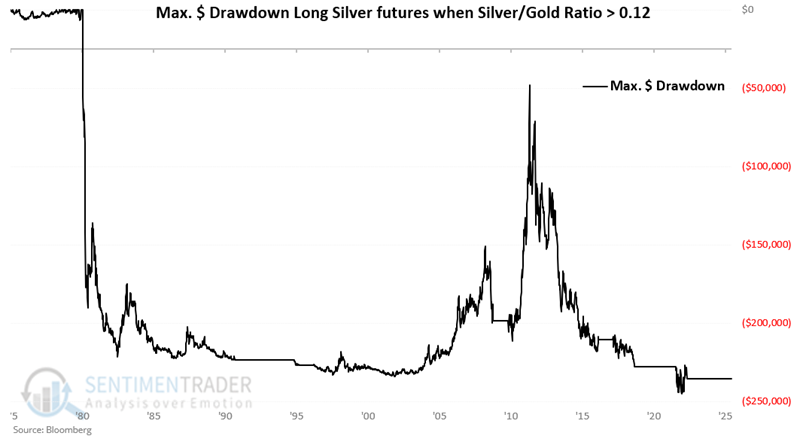
The chart below displays the hypothetical maximum $ drawdown experienced by holding a long position during unfavorable periods, i.e., when the SGR was above 0.12 for 52 or more weeks.
ETFs as an alternative
Let's consider an ETF as an alternative to trading silver futures. The chart below displays the hypothetical growth of $1 invested in iShares Silver Trust (SLV) only during the favorable periods starting in 2006 (SLV inception). Since 2006, a hypothetical $1 invested in this manner has grown to $4.82 through 2025-06-09.
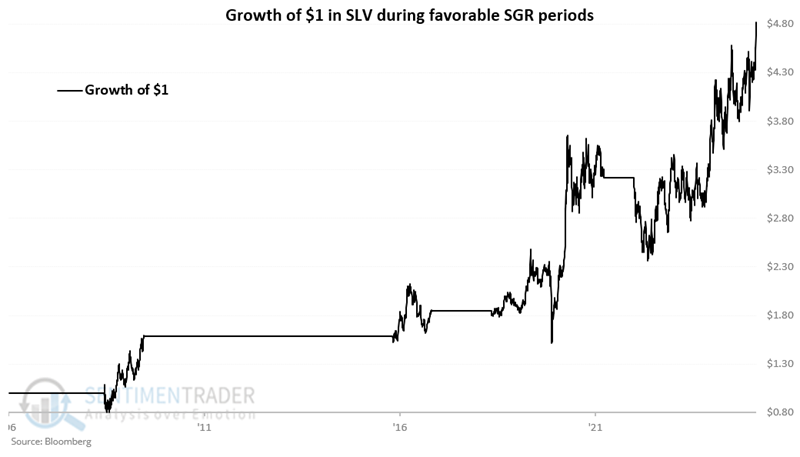
The table below summarizes hypothetical SLV performance during favorable periods since 2006.
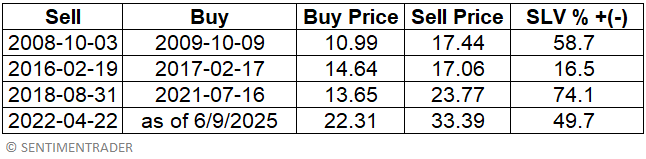
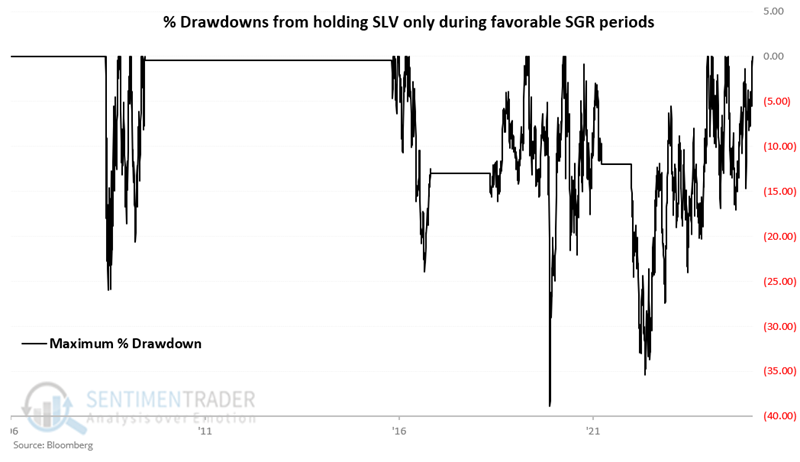
Lest anyone wants to use this as a mechanical, standalone system to trade SLV, please note the hypothetical percentage drawdowns in the chart below. There have been five unique drawdowns over -20%, two over -30%, and a maximum drawdown of -38.8%.
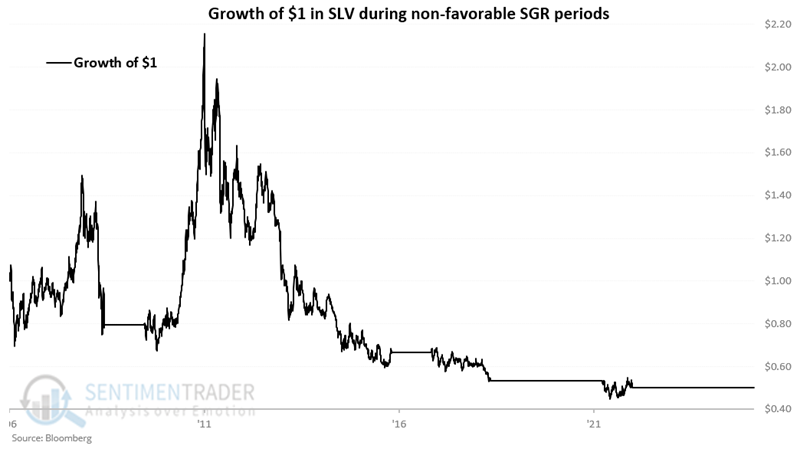
By contrast, the chart below shows the hypothetical growth of $1 in SLV during all "non-favorable" periods. A hypothetical $1 declined in value to $0.50
What the research tells us…
So is silver guaranteed to continue to rise over the next 52 weeks solely because the Silver/Gold Ratio (as we calculate it) is still below 0.12? Not at all. The bottom line is simply that the current status of the SGR falls on the favorable side of the "weight of the evidence" ledger for silver.