Data &
Technology
Research
Reports
Report Solutions
Reports Library
Actionable
Strategies
Free
Resources
Simple Backtest Calculator
Simple Seasonality Calculator
The Kelly Criterion Calculator
Sentiment Geo Map
Public Research Reports
Free Webinar
Pricing
Company
About
Meet Our Team
In the News
Testimonials
Client Success Stories
Contact
Log inLoginSign up
< BACK TO ALL REPORTS

What the Record Run in Transports Meant for Stocks

Jason Goepfert
2021-05-03
The Dow Jones Transportation Average has suffered no weekly losses for the past 13 weeks, a 120-year record. It has tended to be a better signal for Industrial stocks than Transportation stocks going forward.

Even in a market that can't seem to go down for more than a couple of days, one index stands out. Among all major indexes and sectors, few can match the persistence of stocks that haul stuff.

A RECORD STREAK WITH NO LOSSES

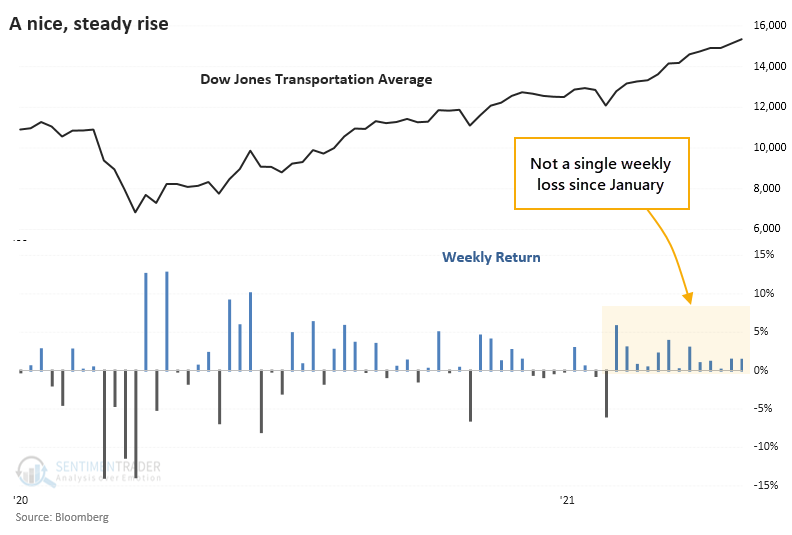
The Dow Jones Transportation Average just completed its 13th straight week with a gain. None of them were tremendous, but the persistence is incredible.

The Transports set a 122-year record for weekly persistence a couple of weeks ago. Last week just added to the gains.

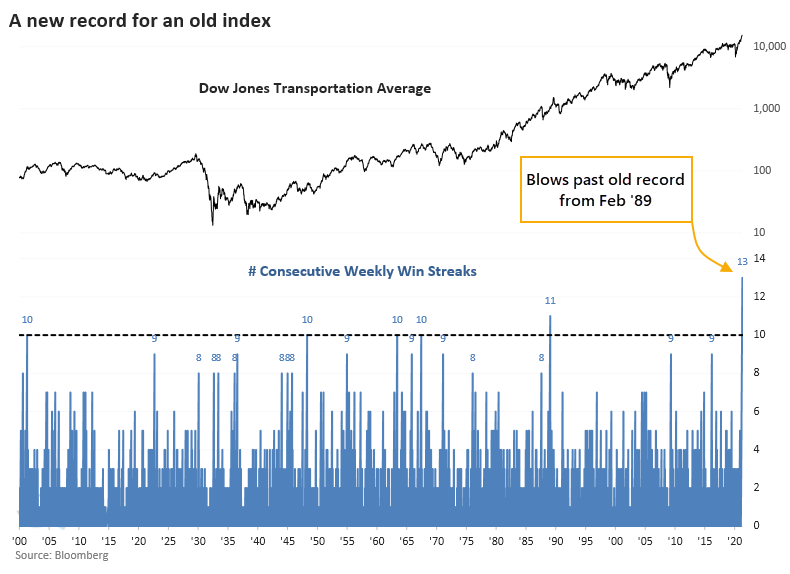
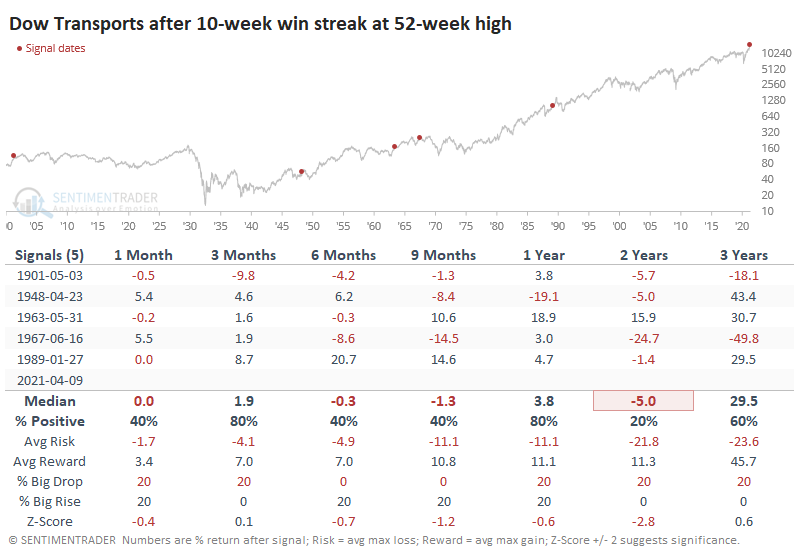
There weren't many streaks of 10 weeks of gains or longer, only 5 others when the index was trading at a 52-week high. So we're dealing with a tiny sample size and all the challenges it brings with it if trying to form any conclusion.

WHAT LONG STREAKS MEANT FOR FUTURE RETURNS

The handful of times Transports managed to do this, forward returns were sketchy over the next 6-24 months. Only 1 out of the 5 other signals managed to show a profit even 2 years later.

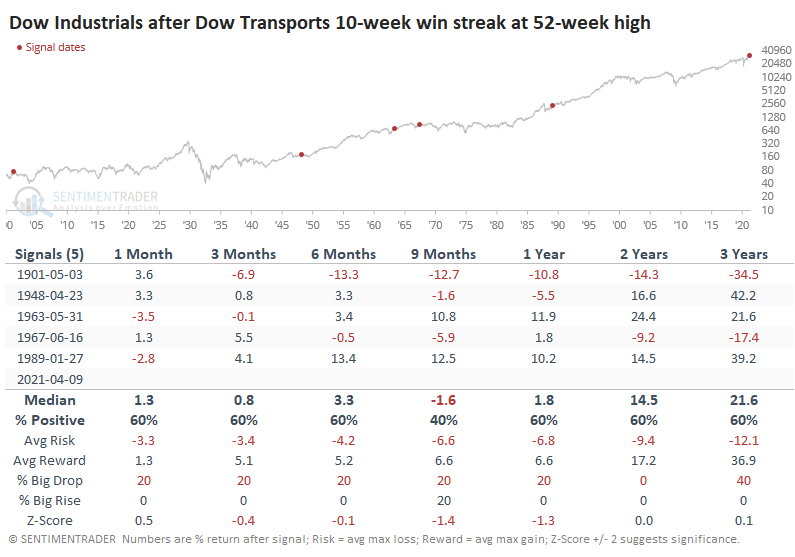
Presumably, such a run in stocks that should benefit from a strong economy should also be good for Industrial stocks. Indeed, the Dow Industrials performed better than Transports did after these signals.

In terms of sectors and factors, Industrials were not the strongest performers.

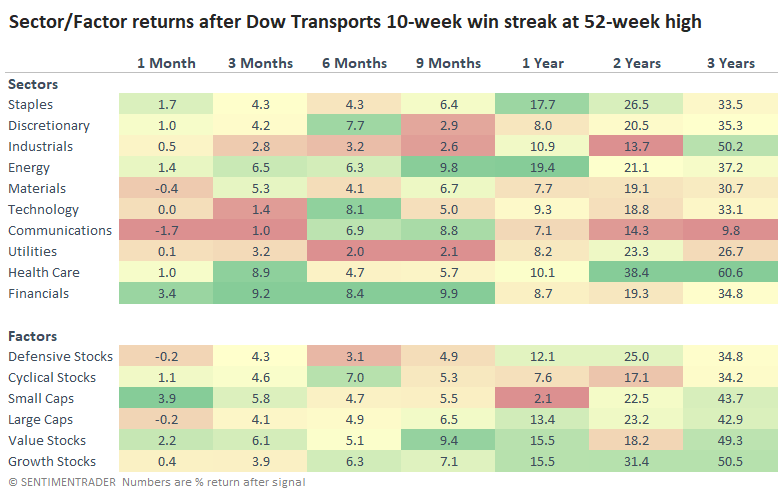
Health Care and Financial stocks had the best returns overall, followed by Staples and Energy. The laggards were Communications, Utilities, and Industrials.

Among factors, Growth stocks tended to show the strongest returns across time frames, though Value wasn't too far behind on most of them or even exceeded the returns on shorter time frames. The other factors also see-sawed on performance depending on the time frame, with Defensive and Large-Cap stocks doing best over the next 1-2 years.

It's tough to put too much weight on something that's happened only a handful of times in 120 years. Perhaps the biggest takeaway would be that Transports seem unlikely to continue to run like this much longer and would likely underperform other indexes and sectors. For the months ahead, it should be a relatively good sign for Value stocks.

Sorry, you don't have access to this report

Upgrade your subscription plan to get access
Go to Dasboard
DATA &
TECHnologies
IndicatorEdge
‍
BackTestEdge
‍
Other Tools
‍
DataEdge API
RESEARCH
reports
Research Solution
‍
Reports Library
‍
actionable
Strategies
Trading Strategies
‍
Smart Stock Scanner
‍
FREE
RESOUrCES
Simple Backtest
Calculator
Simple Seasonality
Calculator
The Kelly Criterion
Calculator
Sentiment Geo Map
‍
Public Research Reports
‍
Free Webinar
COMPANY
‍
About
‍
Meet our Team
‍
In the News
‍
Testimonials
‍
Client Success Stories
Pricing
Bundle pricing
‍
Announcements
‍
FAQ
© 2024 Sundial Capital Research Inc. All rights reserved.
Setsail Marketing
TermsPrivacyAffiliate Program
Risk Disclosure: Futures and forex trading contains substantial risk and is not for every investor. An investor could potentially lose all or more than the initial investment. Risk capital is money that can be lost without jeopardizing ones’ financial security or life style. Only risk capital should be used for trading and only those with sufficient risk capital should consider trading. Past performance is not necessarily indicative of future results.

Hypothetical Performance Disclosure: Hypothetical performance results have many inherent limitations, some of which are described below. No representation is being made that any account will or is likely to achieve profits or losses similar to those shown; in fact, there are frequently sharp differences between hypothetical performance results and the actual results subsequently achieved by any particular trading program. One of the limitations of hypothetical performance results is that they are generally prepared with the benefit of hindsight. In addition, hypothetical trading does not involve financial risk, and no hypothetical trading record can completely account for the impact of financial risk of actual trading. for example, the ability to withstand losses or to adhere to a particular trading program in spite of trading losses are material points which can also adversely affect actual trading results. There are numerous other factors related to the markets in general or to the implementation of any specific trading program which cannot be fully accounted for in the preparation of hypothetical performance results and all which can adversely affect trading results.

Testimonial Disclosure: Testimonials appearing on this website may not be representative of other clients or customers and is not a guarantee of future performance or success.