
what the four-year cycle means for gold

Key Points
- Gold has demonstrated a history of surprising cyclicality in price movement
- No cycle is ever perfect, and any cycle should be used as weight of the evidence and not as a trading system
- One cycle suggests that investors should give gold the benefit of the doubt over the next four years
The Four-Year Cycle in Gold
Many investors are familiar with the stock market's four-year cycle or "Election Cycle." But does it apply to precious metals as well? The answer appears to be "Yes, but differently." Whereas the stock market tends to exhibit strength or weakness during specific times within each four-year cycle, gold tends to treat each alternating four-year period differently.
We will designate each successive four-year period as "Favorable" and then "Unfavorable." So 12/31/1976 to 12/31/1980 is deemed "favorable," and 12/31/1980 to 12/31/1984 is considered "unfavorable." And so on. The chart below highlights the "favorable" four-year periods since 1976 in green.
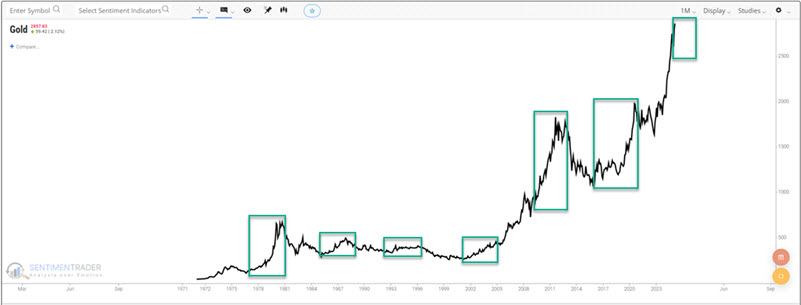
The latest "favorable" four-year cycle began at the close on 2024-12-31 and extends through 2028-12-31. So, do gold investors merely need to "sit back and wait for the profits to roll in" for the next four years? Not exactly. Should they at least give the bullish case for gold the benefit of the doubt? Let's examine the history a little more closely so you can draw your own conclusions.
Favorable Four-Year Periods
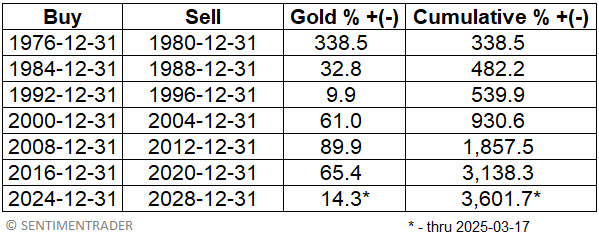
The table below displays the four-year return for gold during each "favorable" 4-year period and the cumulative % +(-) for gold combined during all favorable four-year periods.
The chart below displays the hypothetical cumulative growth of $1 invested in gold bullion only during the 4-year periods listed in the table above.
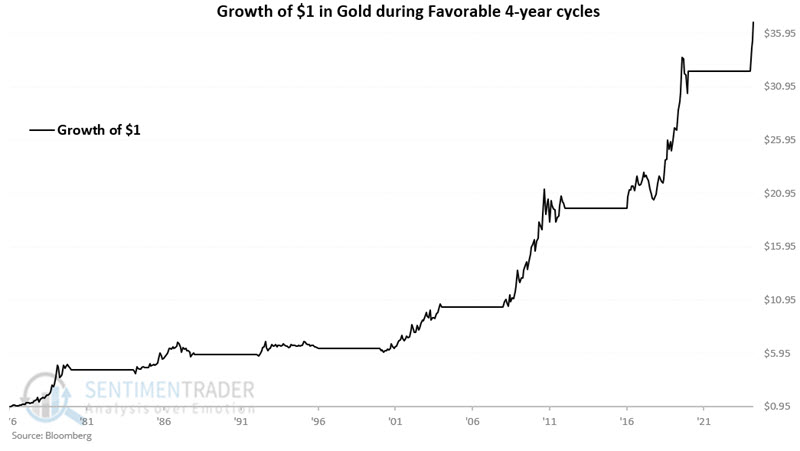
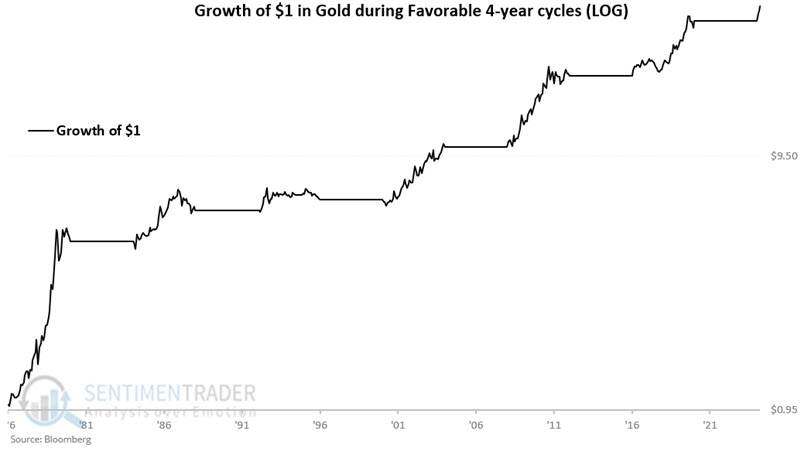
The cumulative gain through 2025-03-17 is +3,602%. The chart below displays the same information on a logarithmic scale.
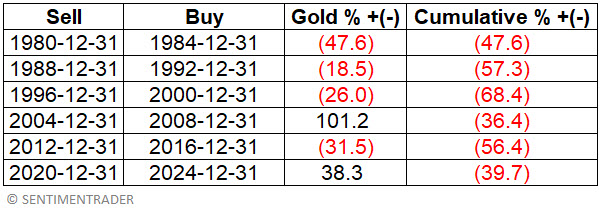
Unfavorable Four-Year Periods
The table below displays the four-year return for gold during each "unfavorable" 4-year period and the cumulative % +(-) for gold combined during all unfavorable four-year periods. While the results have not been uniformly bearish, they have been decidedly weaker overall than those shown above for favorable periods.
The chart below displays the hypothetical cumulative growth of $1 invested in gold bullion only during the 4-year periods listed in the table above. Again, this is not " straight-line bearish," but it is a far cry from the much more consistent gains in previous favorable periods.
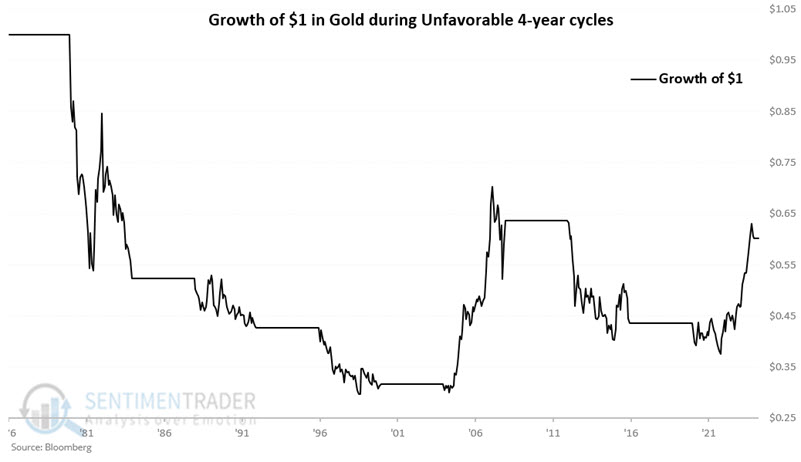
The cumulative return for all "unfavorable" periods through 2024-12-31 is -39.7%.
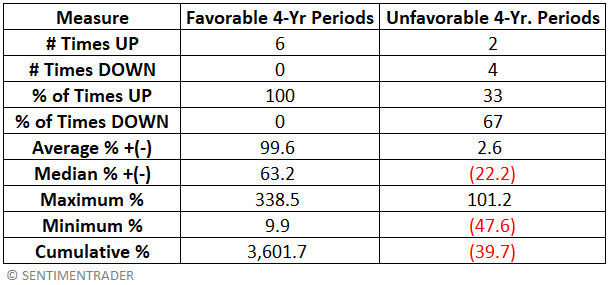
Comparing favorable and unfavorable four-year periods
The table below summarizes performance during four-year "favorable" and "unfavorable" periods.
What the research tells us
Less than three months into the latest "favorable" four-year period (which will run through 2028), gold is already up over 14%. The other good news is that historically, gold has tended to vastly outperform during favorable four-year periods versus unfavorable ones. This historical tendency suggests that investors give the bullish case for gold the benefit of the doubt in the years directly ahead. The bad news is that historical results guarantee nothing, and cycles are never guaranteed to work "this time around." Given the advance that gold has already seen in the last year, it could easily suffer a significant correction at any time. The bottom line is that the four-year cycle presently falls on the favorable side of the weight of the evidence ledger and bodes well for gold in the coming years. Nevertheless, investors are never relieved of their responsibility to allocate capital intelligently and to manage risk ruthlessly.