Data &
Technology
Research
Reports
Report Solutions
Reports Library
Actionable
Strategies
Free
Resources
Simple Backtest Calculator
Simple Seasonality Calculator
The Kelly Criterion Calculator
Sentiment Geo Map
Public Research Reports
Free Webinar
Pricing
Company
About
Meet Our Team
In the News
Testimonials
Client Success Stories
Contact
Log inLoginSign up
< BACK TO ALL REPORTS

What the Bear Flattener in Treasuries means for stocks

Jason Goepfert
2022-01-28
The Treasury yield curve is in a Bear Flattener regime, which has not been great for equity returns. Utility stocks are responding to bond pessimism.

What the Bear Flattener in Treasuries means for stocks

The move in 2-year Treasury notes after the FOMC meeting on Wednesday seemed to significantly dampen investor sentiment in stocks.

The gyration in Treasuries has been dramatic, with a bearish (for prices) bias. Yields have skyrocketed, especially on the short end of maturities, and especially especially on Wednesday, with the biggest jump in 2-year yields in almost a year.

2 year vs 10 year Treasury yield

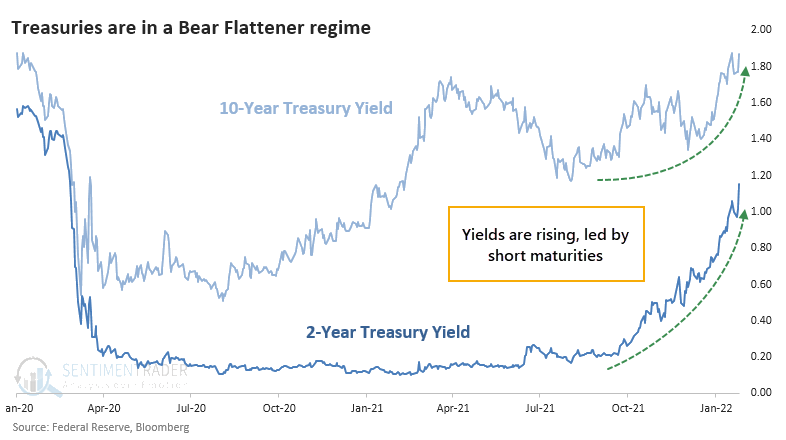
The fact that 2-year yields rose more than 10-year yields means that the yield curve got flatter. When a flattening curve happens because short-term maturities rise faster than longer-term maturities, it's considered to be a Bear Flattener. This is considered to be a negative for stocks because it means that money is getting more expensive for consumers and businesses, and the Federal Reserve may be on the cusp of making it even more expensive.

There are an innumerable number of ways to measure this, using different parts of the curve and different time frames. For our purposes, we looked at 2-year and 10-year Treasury yields and their changes from 3 months ago.

The difference in next-day returns in the S&P 500 depending on the Treasury yield regime was significant, and not necessarily encouraging.

Stat box

Traders pulled more than $2.9 billion from the QQQ Nasdaq 100 fund on Wednesday, the 3rd-largest outflow in 15 years next to two days in September 2020.


Bond pessimism and Utility stock returns

Ticker XLU (Utilities Select Sector SPDR Fund) serves as an investment proxy for the utility sector as a whole. With the possibility that the major stock market indexes may be dead money for a while, defensive sectors such as utilities may enjoy a stronger appeal, thanks to their below-average volatility and above-average dividend yield.

Few investors are aware of the relationship between the utility sector and bond investor sentiment. The chart below displays XLU and those times when the 10-day average for 10-year treasury Optix dropped below 8 for the first time in a month. 

XLU utility sector versus bond sentiment

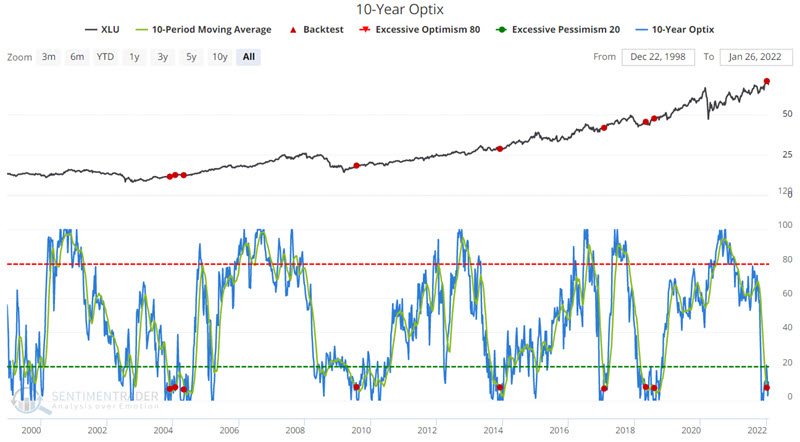
The two weeks after the 1/4/2022 signal witnessed significant weakness in the utility sector, which was par for the course after the other signals. If history proves an accurate guide, performance may steadily improve in the months ahead.

DATA &
TECHnologies
IndicatorEdge
‍
BackTestEdge
‍
Other Tools
‍
DataEdge API
RESEARCH
reports
Research Solution
‍
Reports Library
‍
actionable
Strategies
Trading Strategies
‍
Smart Stock Scanner
‍
FREE
RESOUrCES
Simple Backtest
Calculator
Simple Seasonality
Calculator
The Kelly Criterion
Calculator
Sentiment Geo Map
‍
Public Research Reports
‍
Free Webinar
COMPANY
‍
About
‍
Meet our Team
‍
In the News
‍
Testimonials
‍
Client Success Stories
Pricing
Bundle pricing
‍
Announcements
‍
FAQ
© 2024 Sundial Capital Research Inc. All rights reserved.
Setsail Marketing
TermsPrivacyAffiliate Program
Risk Disclosure: Futures and forex trading contains substantial risk and is not for every investor. An investor could potentially lose all or more than the initial investment. Risk capital is money that can be lost without jeopardizing ones’ financial security or life style. Only risk capital should be used for trading and only those with sufficient risk capital should consider trading. Past performance is not necessarily indicative of future results.

Hypothetical Performance Disclosure: Hypothetical performance results have many inherent limitations, some of which are described below. No representation is being made that any account will or is likely to achieve profits or losses similar to those shown; in fact, there are frequently sharp differences between hypothetical performance results and the actual results subsequently achieved by any particular trading program. One of the limitations of hypothetical performance results is that they are generally prepared with the benefit of hindsight. In addition, hypothetical trading does not involve financial risk, and no hypothetical trading record can completely account for the impact of financial risk of actual trading. for example, the ability to withstand losses or to adhere to a particular trading program in spite of trading losses are material points which can also adversely affect actual trading results. There are numerous other factors related to the markets in general or to the implementation of any specific trading program which cannot be fully accounted for in the preparation of hypothetical performance results and all which can adversely affect trading results.

Testimonial Disclosure: Testimonials appearing on this website may not be representative of other clients or customers and is not a guarantee of future performance or success.