Data &
Technology
Research
Reports
Report Solutions
Reports Library
Actionable
Strategies
Free
Resources
Simple Backtest Calculator
Simple Seasonality Calculator
The Kelly Criterion Calculator
Sentiment Geo Map
Public Research Reports
Free Webinar
Pricing
Company
About
Meet Our Team
In the News
Testimonials
Client Success Stories
Contact
Log inLoginSign up
< BACK TO ALL REPORTS

What rising rates mean for market breadth

Jason Goepfert
2021-03-01
When the yield on 10-year Treasury notes rises from a 1-year low to a 1-year high, internal breadth of the S&P 500 tends to decline.

The 10-year yield registered a 252-day high on late last week. This is the first occurrence since the last 252-day low in August.

Typically, rising interest rates reflect positive trends in the economy and operate with a lag on future growth. Out of all cycles from a one-year low to one-year high in yield, this one is showing one of the smallest net changes in yield, because of its low starting level.

While forward returns in indexes were fine, there is a notable wrinkle - breadth tended to deteriorate.

The table below shows the percentage of S&P 500 members with a rising 200-day moving average after the 10-year yield cycled from a one-year low to one-year high. Please note, the numbers in the breadth table reflect the net change in the percentage of members with a rising 200-day moving average.

Change in S&P 500 breadth after yield rise

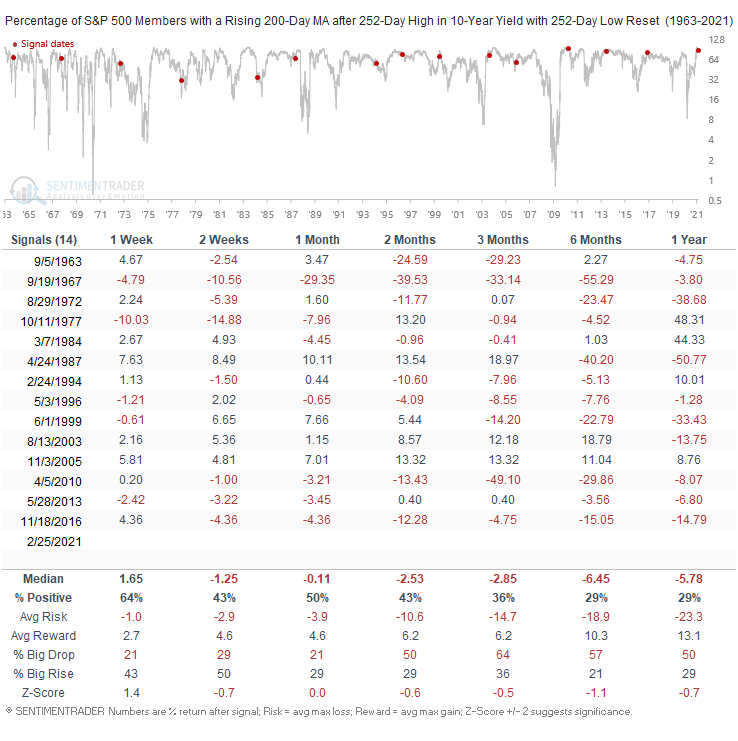
While most of the instances started from a high level, higher rates will impact certain industries. With policy rates on hold and the Fed conducting QE, it will be fascinating to see what happens with rates and the yield curve over the next 6-12 months. The implications for asset allocation could be profound.  

What else we're looking at

  • Full returns in major stock indexes, assets, and sectors following a full cycle in the 10-year yield
  • An in-depth look at a "quick and dirty" hedge in QQQ
  • What happens after gold suffers a loss like last week's

Stat Box

For the first time in more than 70 days, there were more securities hitting a 52-week low on the NYSE than a 52-week high. It's unusual to see this happen so soon after indexes hit record highs - it's happened only 10 other times since 1965.


Sentiment from other perspectives

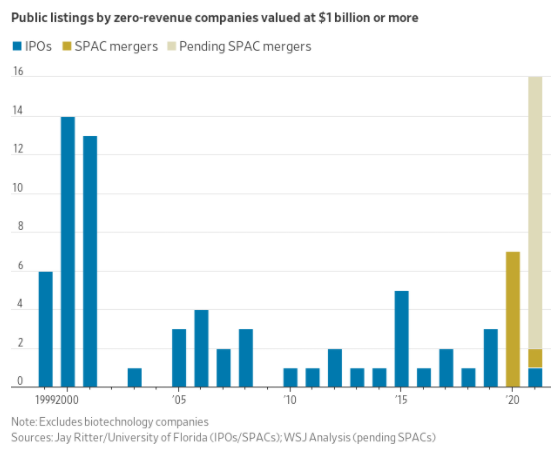
Mo' money, mo' problems. If that's still the case, then recent public offerings are in the clear, because they're not making any money. More than any time in history, investors are willing to swallow gigantic IPOs with absolutely no record of ever turning a profit. Or sales. Source: Wall Street Journal

spac ipos no revenue

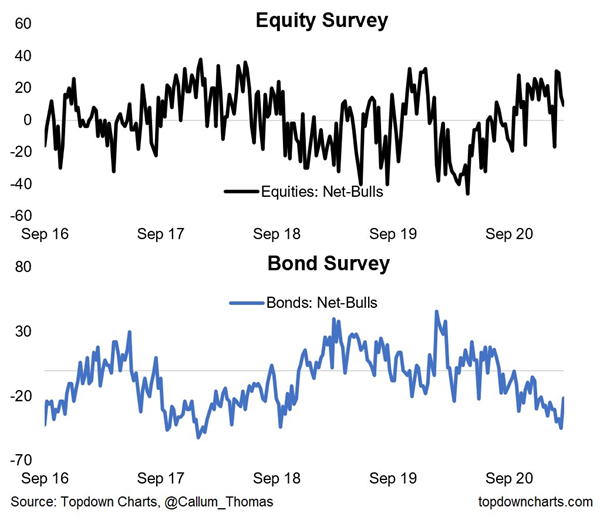
Not bullish on bonds, though. Twitter users are very optimistic on stocks (obv) which usually means they're less optimistic on other assets like bonds, which certainly seems to be the case. Source: Topdown Charts

equity and bond sentiment

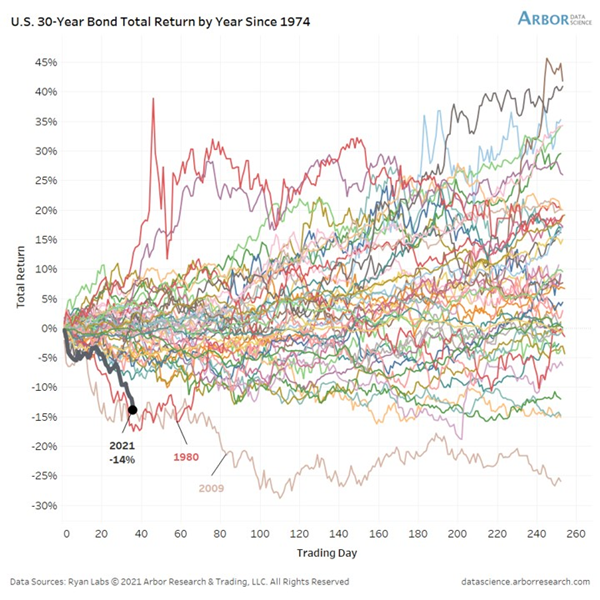
That's because they've had one of the worst starts, ever. Losses on bonds so far in 2021 are challenging some of the worst starts to a year in history. Source: Arbor Research via Jeroen Blokland

bond losses 2021

DATA &
TECHnologies
IndicatorEdge
‍
BackTestEdge
‍
Other Tools
‍
DataEdge API
RESEARCH
reports
Research Solution
‍
Reports Library
‍
actionable
Strategies
Trading Strategies
‍
Smart Stock Scanner
‍
FREE
RESOUrCES
Simple Backtest
Calculator
Simple Seasonality
Calculator
The Kelly Criterion
Calculator
Sentiment Geo Map
‍
Public Research Reports
‍
Free Webinar
COMPANY
‍
About
‍
Meet our Team
‍
In the News
‍
Testimonials
‍
Client Success Stories
Pricing
Bundle pricing
‍
Announcements
‍
FAQ
© 2024 Sundial Capital Research Inc. All rights reserved.
Setsail Marketing
TermsPrivacyAffiliate Program
Risk Disclosure: Futures and forex trading contains substantial risk and is not for every investor. An investor could potentially lose all or more than the initial investment. Risk capital is money that can be lost without jeopardizing ones’ financial security or life style. Only risk capital should be used for trading and only those with sufficient risk capital should consider trading. Past performance is not necessarily indicative of future results.

Hypothetical Performance Disclosure: Hypothetical performance results have many inherent limitations, some of which are described below. No representation is being made that any account will or is likely to achieve profits or losses similar to those shown; in fact, there are frequently sharp differences between hypothetical performance results and the actual results subsequently achieved by any particular trading program. One of the limitations of hypothetical performance results is that they are generally prepared with the benefit of hindsight. In addition, hypothetical trading does not involve financial risk, and no hypothetical trading record can completely account for the impact of financial risk of actual trading. for example, the ability to withstand losses or to adhere to a particular trading program in spite of trading losses are material points which can also adversely affect actual trading results. There are numerous other factors related to the markets in general or to the implementation of any specific trading program which cannot be fully accounted for in the preparation of hypothetical performance results and all which can adversely affect trading results.

Testimonial Disclosure: Testimonials appearing on this website may not be representative of other clients or customers and is not a guarantee of future performance or success.