What I'm looking at - ZEW, yield curve, USD spike, S&P's intraday range, commodities collapse
Here's what I'm looking at:
ZEW
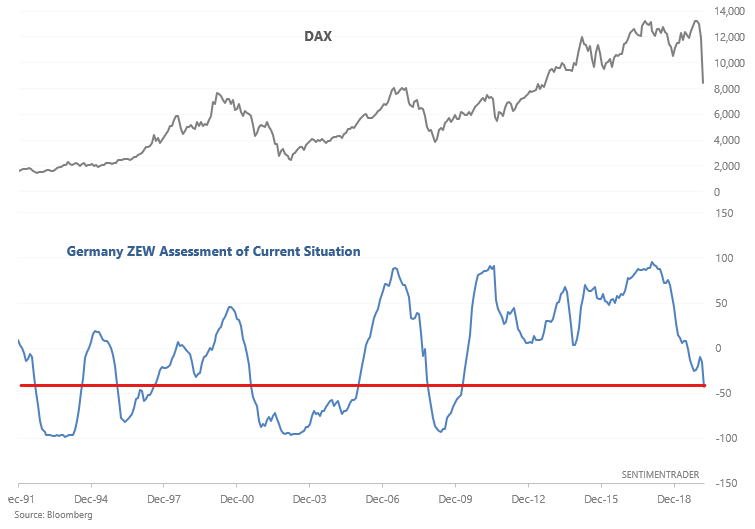
The longest economic expansion in U.S. history has probably been ended by the coronavirus pandemic. U.S. and ex-U.S. economic data over the next 1-2 months will probably be incredibly weak. The latest reading for Germany ZEW assessment of current situation, which asks participants about their assessment of the current economic environment, reveals that a net 43% are pessimistic.
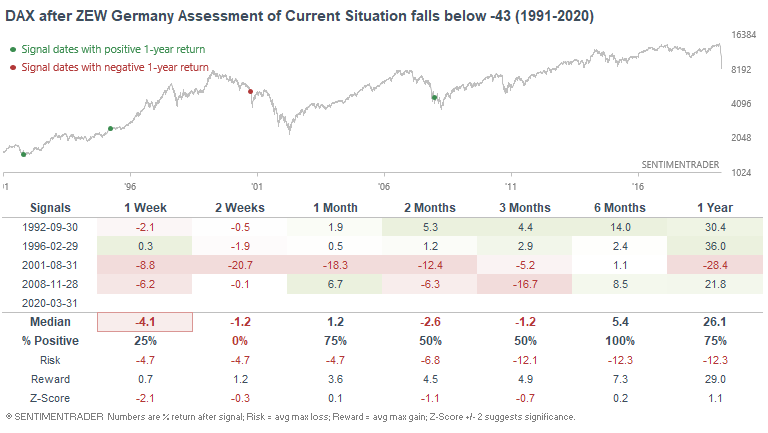
When things were this pessimistic in the past, it wasn't a great idea to join the crowd and panic. While the DAX could face short term weakness (it's impossible to consistently and accurately predict the EXACT bottom in a panic), the DAX typically rallied over the next 6 months.
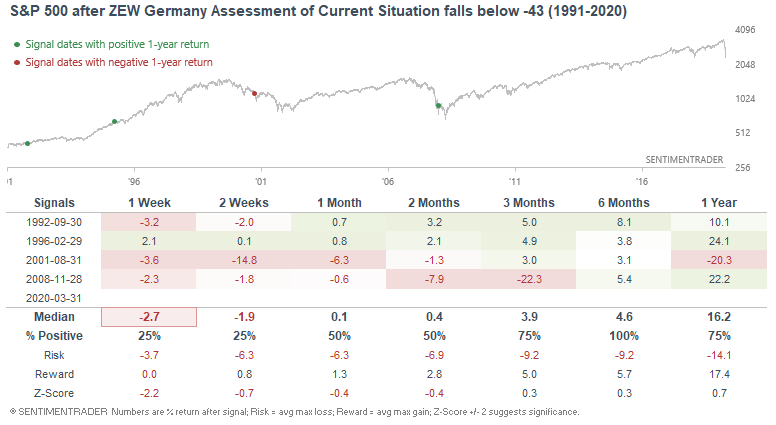
Here's what the S&P 500 did next:
Panic moves
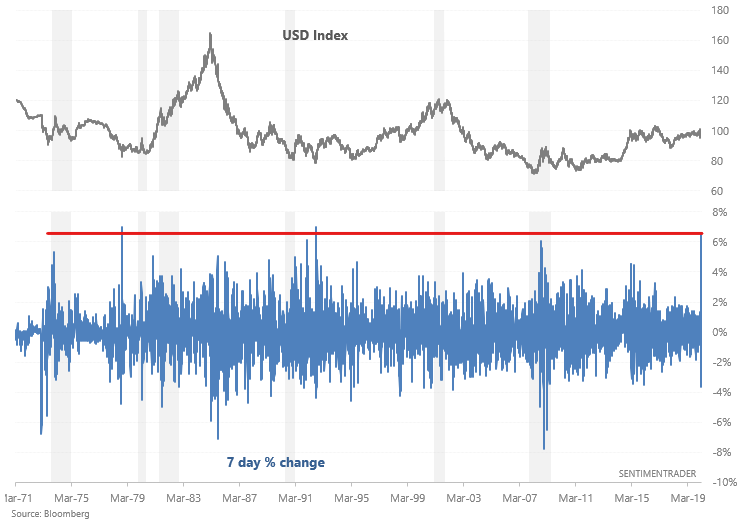
There's a palpable amount of panic in almost all markets. For example, the U.S. Dollar made one of the largest 7-day spikes in history, while the yield curve spiked higher.
Many bears were focusing on the inverted yield curve last year to support their bearish case. And while this looked premature at the time, historical analysis demonstrates that the yield curve can invert up to a year before there are any major market consequences. Meanwhile, Unemployment is extremely low, something that I have warned about for the past 2 years. Long term tops and bottoms are incredibly hard to predict, which is why it's better to focus on long term risk:reward.
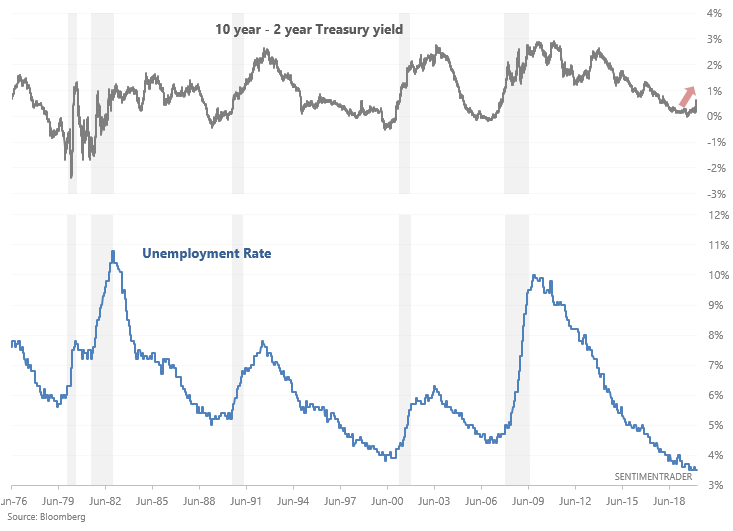
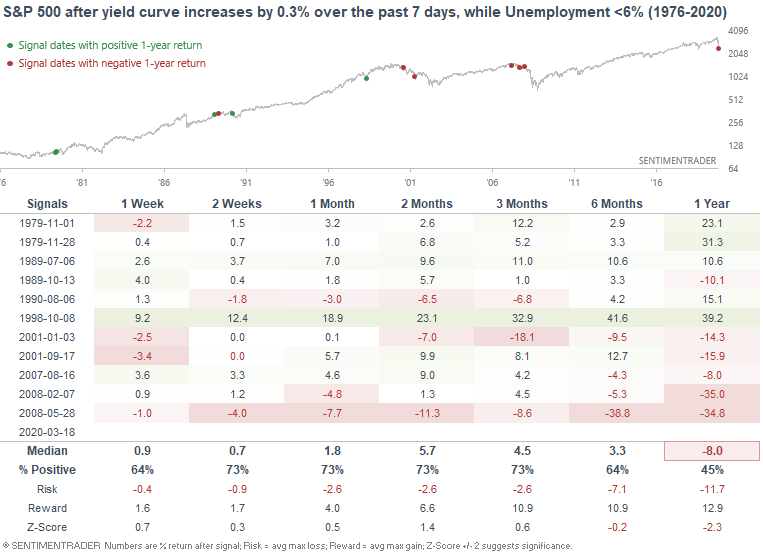
When the 10 year - 2 year Treasury yield curve steepened by more than 0.3% in the past 7 days while the economic expansion was late cycle or in an early-recession, the S&P 500's returns over the next year were dangerous. The only case in which markets escaped unscathed was in 1998, when investors and traders panicked 2 years too early. Otherwise, this typically happened during or just before a recession and bear market.
- 1979 case: recession and sudden stock market decline in early-1980
- 1989: recession and stock market decline in 1990
- 2001: recession & major bear market
- 2007-2008: recession & major bear market
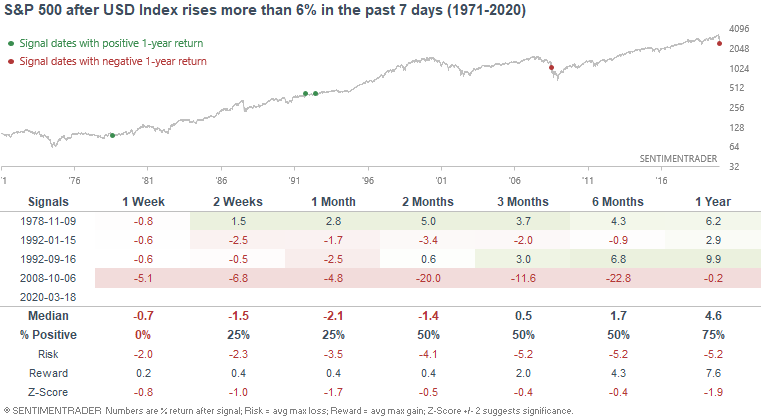
The U.S. Dollar Index spiked over the past 7 days as investors and traders scramble for cash. The spike we just saw was even larger than during the worst of the 2008 crisis.
When the USD Index spiked more than 6% in the past 7 days, it sometimes rallied further before peaking.
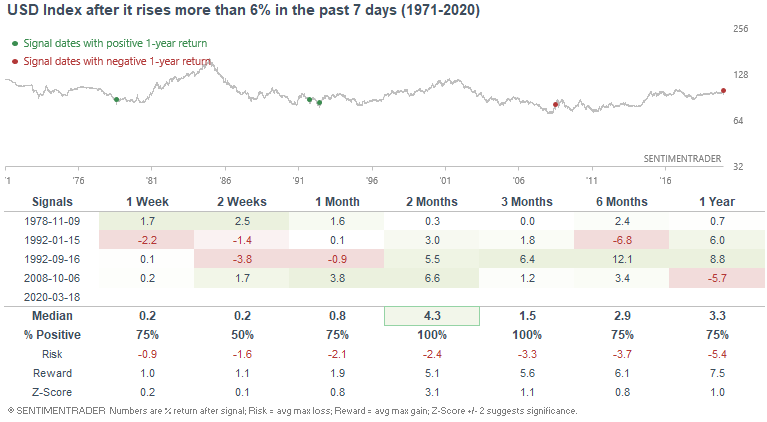
Here's what the S&P 500 did next:
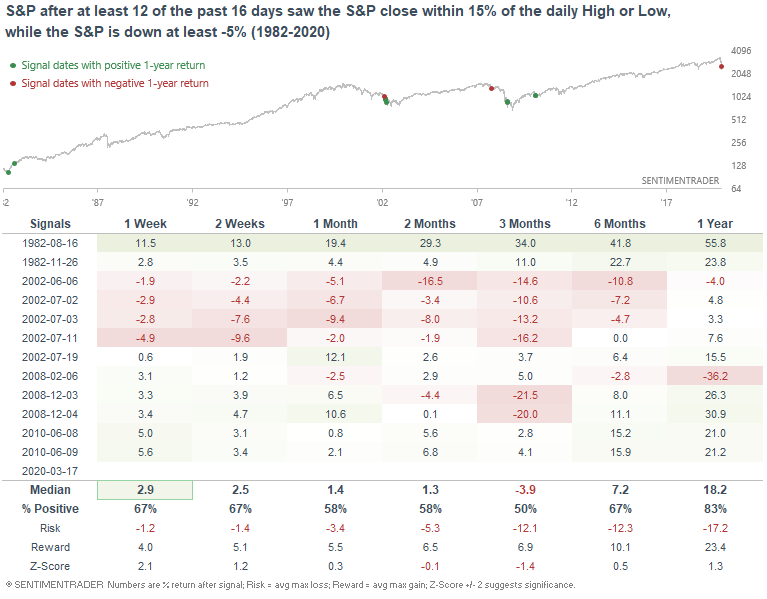
Daily high/low
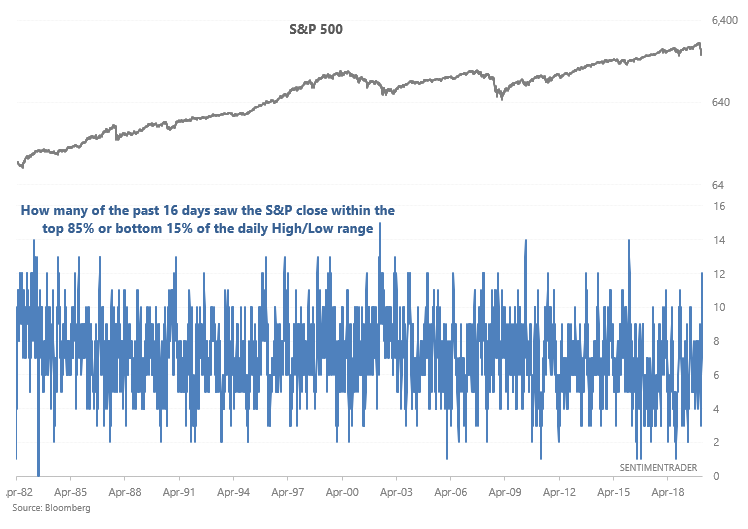
The past few weeks have seen massive daily moves with the S&P closing either near the high or low of the day.
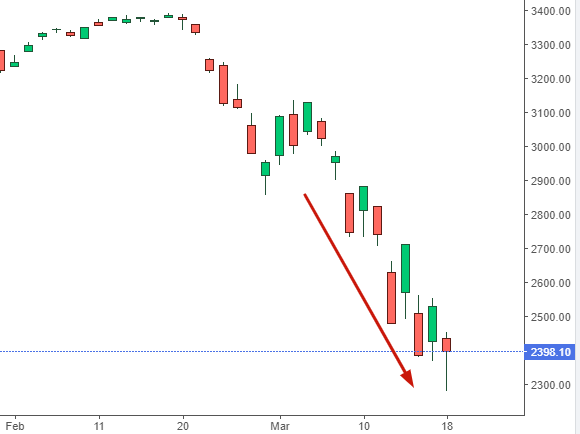
While it's common for the S&P to do so when the market isn't very volatile (since daily swings are so small anyways), it's incredibly rare for the market to do so while it's crashing. Such price action indicates extreme anxiety in the market as dip buyers rush back in, only to see staggering losses the next day as the market crash continues.
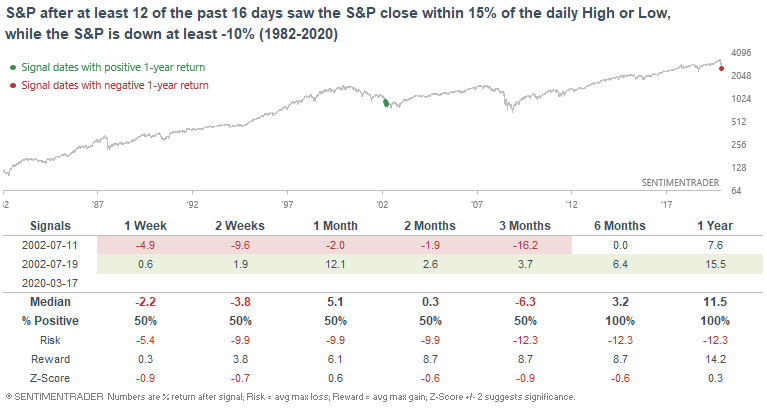
There's only 1 comparable historical case in which the S&P consistently closed near the high or low of its daily range while crashing. That was July 2002 during the last major crash of the 2000-2002 bear market. Stocks bounced up and down over the next several months before putting in a major bottom.
If we loosen the parameters, it's clear that this price action only happens near major periods of market turmoil.
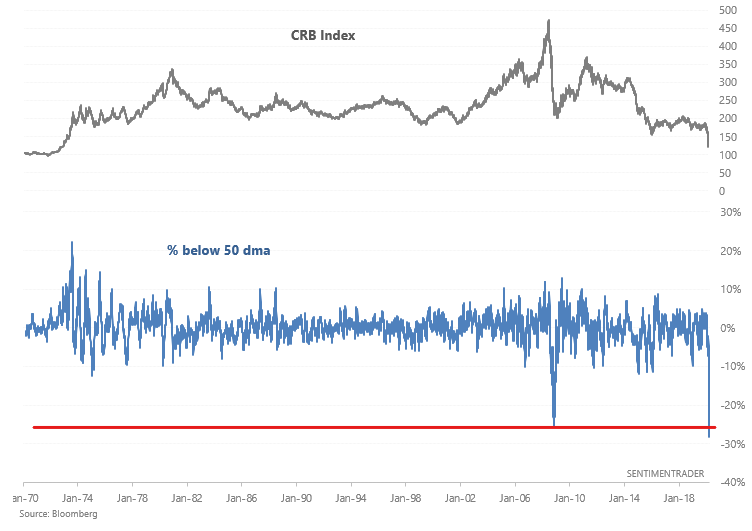
Commodities
And lastly, commodities have been crushed. The CRB Index's distance from its 50 dma is more extreme than what we saw in 2008.