What I'm looking at - volatility is back, breadth, tech plunge, gold:silver ratio
Now that the U.S. stock market's complacency has snapped, here's what I'm looking at:
Volatility is back
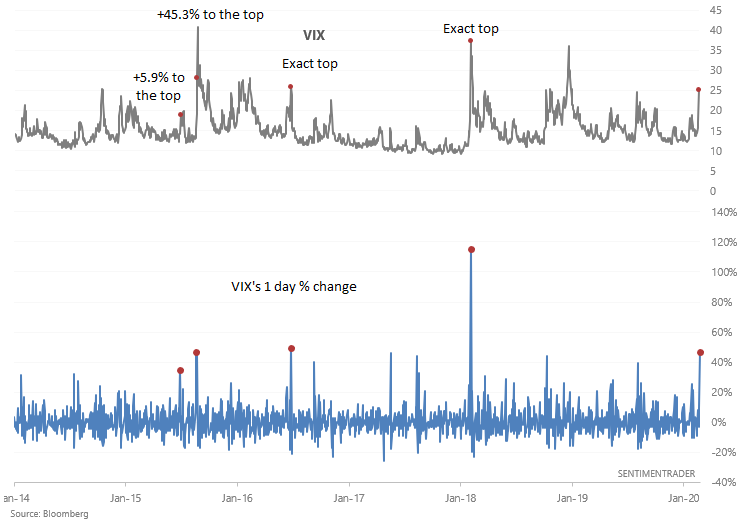
As Bloomberg noted, VIX's spike was the largest one day spike in more than 2 years (since 2018's Volmageddon). Such large spikes may or may not see 1-2 additional days of volatility spikes, but from a risk:reward perspective, going long volatility now is not a good idea.
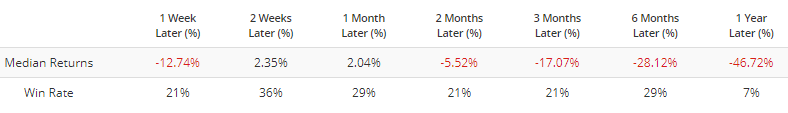
When VIX's daily spike was the largest in more than 2 years, its returns over the next few weeks and months were consistently weak:
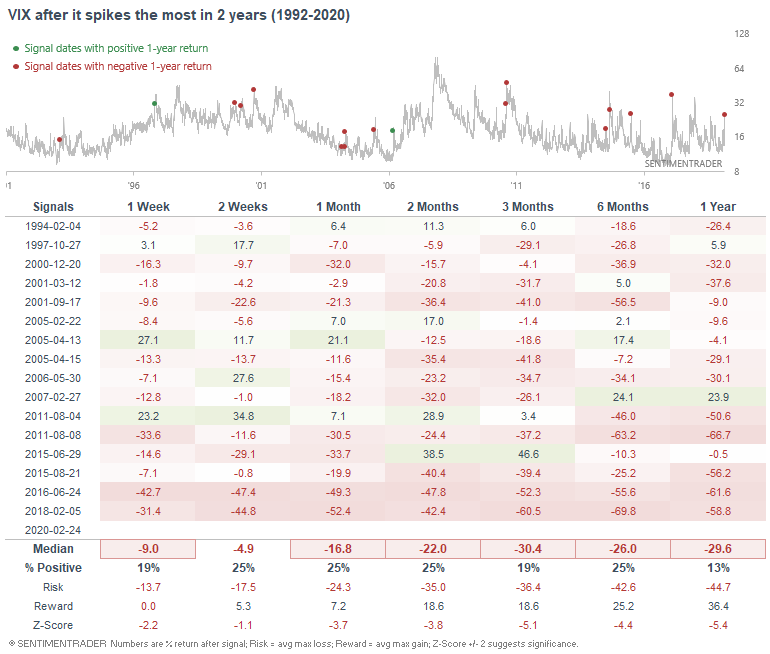
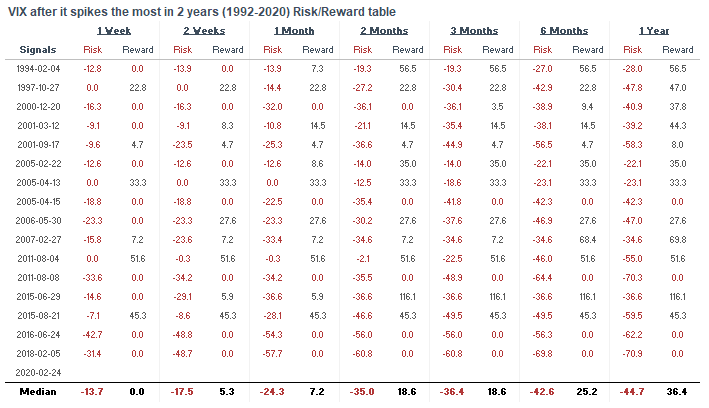
For those who are interested, the "Reward" columns demonstrate VIX's maximum spike over the coming weeks/months.
Moreover, VIX's Term Structure is extremely high:
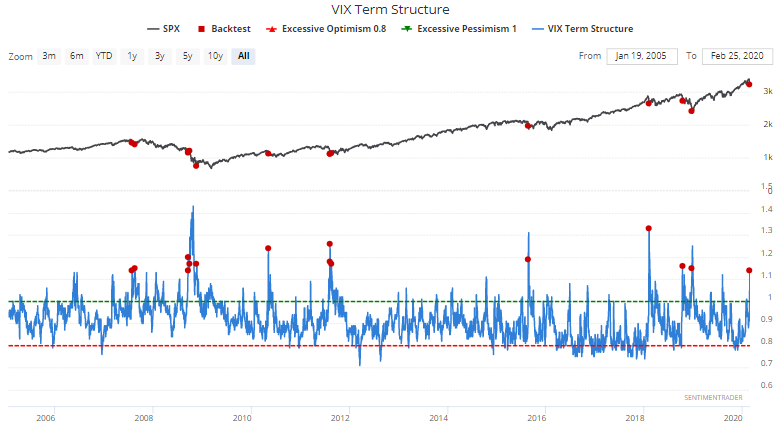
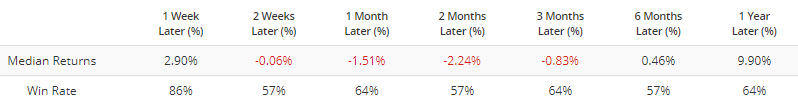
Similar readings in the past were mostly bullish for the S&P 1 week later (even though the S&P often swung up and down over the next few weeks):
And was short term bearish for VIX.
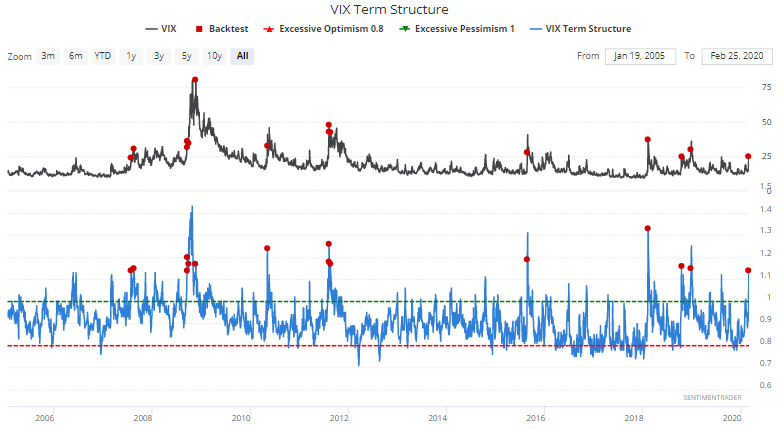
*Many VIX spikes come in pairs, even if the 2nd spike does not exceed the first spike.
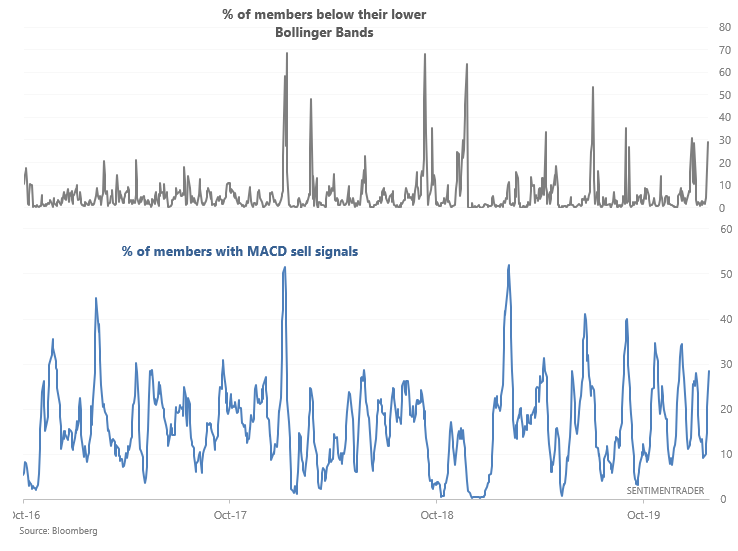
Breadth
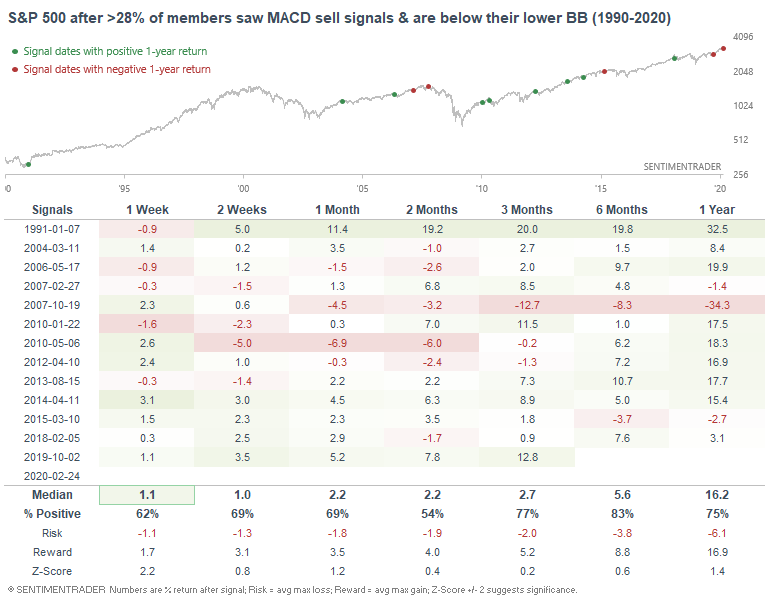
Monday's stock market rout saw a jump in S&P 500 members below their lower Bollinger Bands and a jump in members with MACD sell signals in the past 10 days:
When this happened in the past, the S&P's returns over the next week were slightly more bullish than random, but not extremely so. Historical cases in this bull market were mostly bullish over the next week. But prior to this bull market, this study's track record wasn't consistently bullish over the next week:
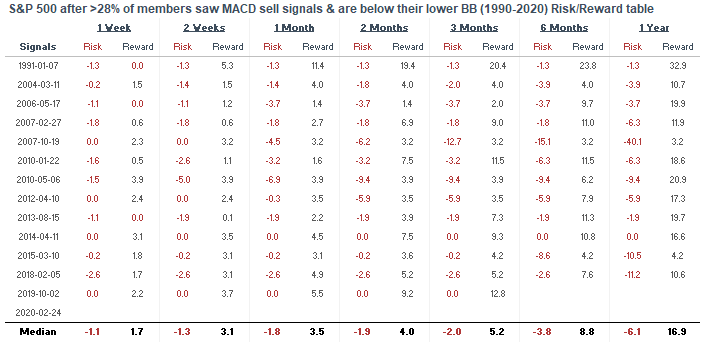
For what it's worth here's the risk:reward table.
Tech's downturn
Tech - a more volatile sector than the broader stock market - has ended its uptrend, at least by one definition.
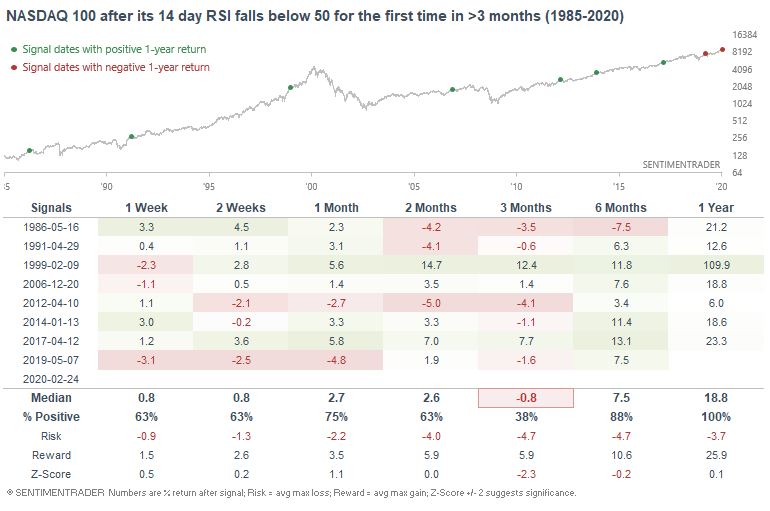
Some traders use the market's RSI and whether the RSI is above or below 50 to determine trend. The NASDAQ 100's RSI is no longer above 50 after the longest streak ever above 50:
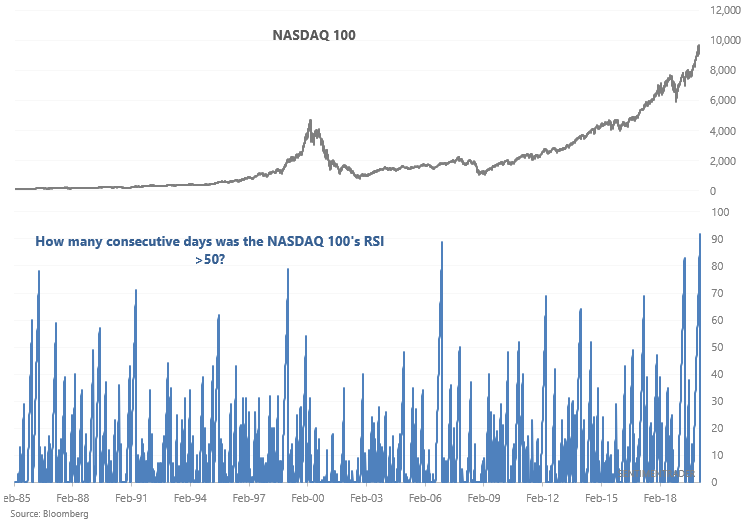
When similar streaks of bullish momentum ended, the NASDAQ 100 usually chopped sideways or fell over the next 3 months. But after that, strong momentum usually beget more gains.
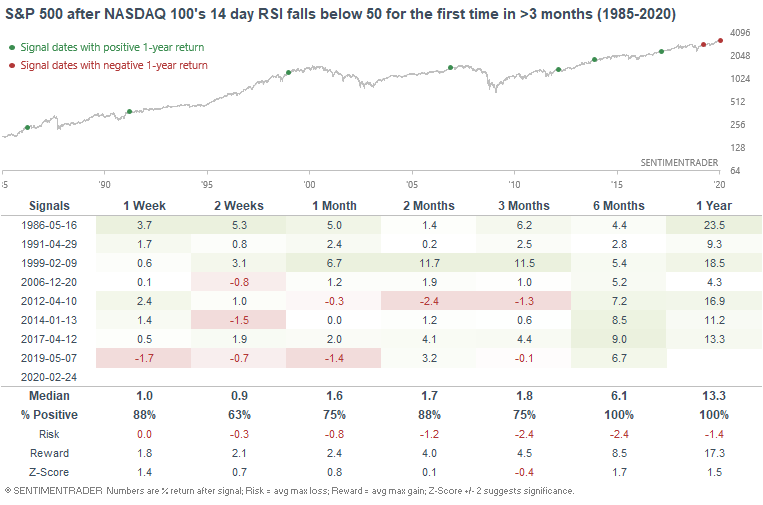
Here's what the S&P 500 did next:
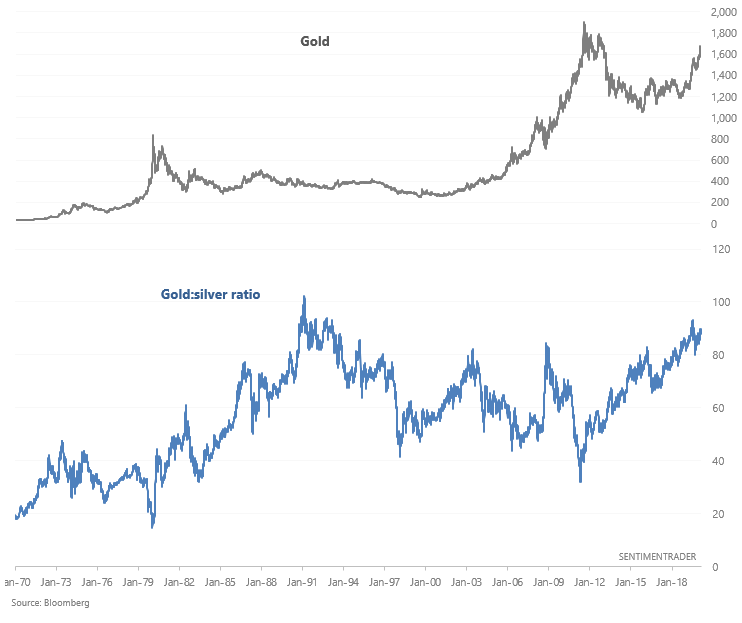
Gold:silver ratio
The recent rally in precious metals has not been accompanied by a decline in the gold:silver ratio.
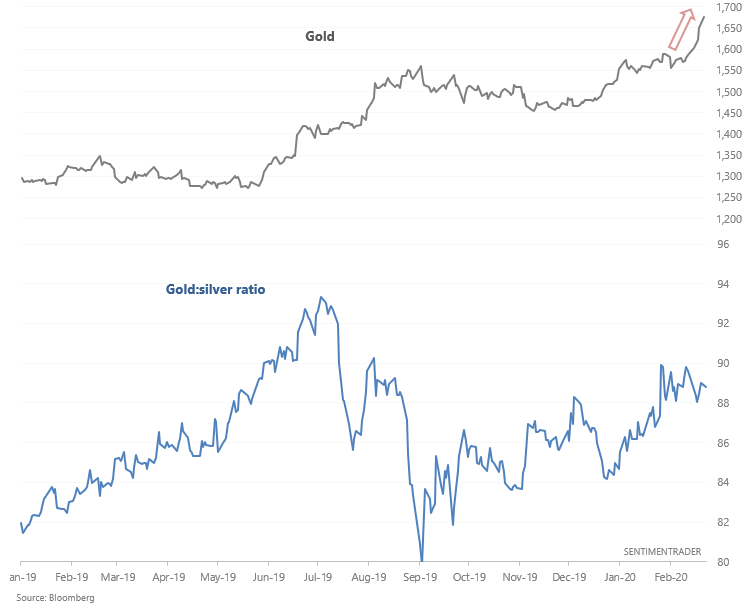
Is this a potentially worrisome sign for the precious metals rally, given that (historically) gold and silver usually move inversely with the gold:silver ratio? Shouldn't a healthy precious metals rally see silver outperform gold, and hence see the gold:silver ratio fall?
The following table looks at cases in which gold rallied more than 7% over the past 12 days while the gold:silver ratio went up, and gold is at a >1 year high:
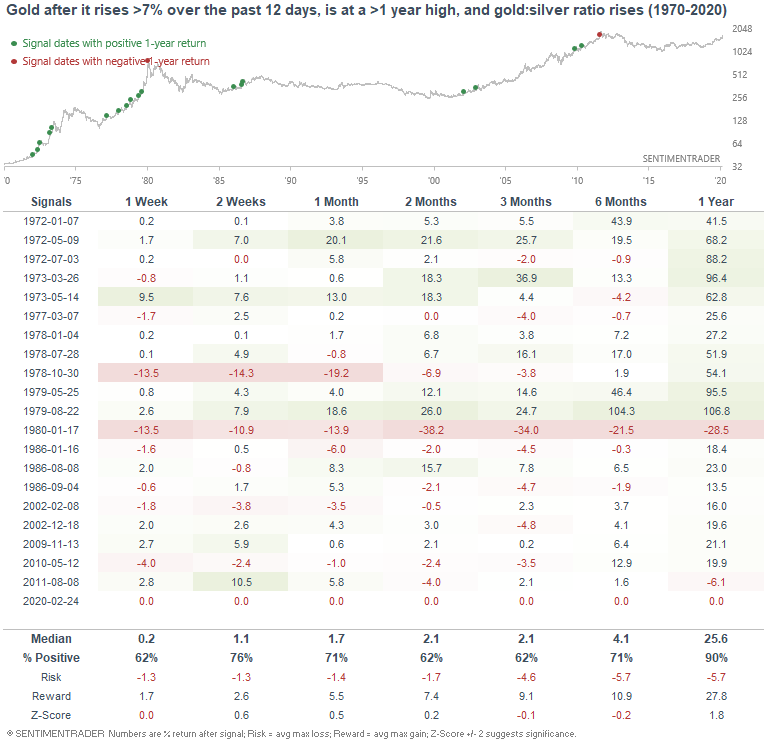
This wasn't a consistently bearish factor for gold on any time frame, and 1 year forward returns were more bullish than random. While silver does tend to outperform gold during the overall course of a precious metals bull market, it is entirely normal for gold to outperform silver from time to time.
How I allocate my assets
Instead of sharing how I manage my own trading portfolio, here's how I allocate all my assets for the sake of full transparency. Some of these percentages are approximate, particularly for private assets (since private assets don't have a value on a day to day basis).
- 40% emerging market real estate.
- 20% trading portfolio. My trading portfolio is allocated 50% in the Macro Index Model and 50% in the Simple Trading Model With Fundamentals. At the moment I have instituted a discretionary override and gone 100% long bonds (instead of long stocks) due to the extreme nature of many of our core indicators, even though some of these core indicators aren't in the models.
- 20% is a buy and hold position for the S&P 500 which I won't sell unless I see better opportunities in private markets. This IS NOT a trading position - here I care about the earnings yield.
- 20% in short term Treasury bond ETFs. This is a temporary placeholder. When opportunities arise I will sell these cash-like instruments to fund private market investments.
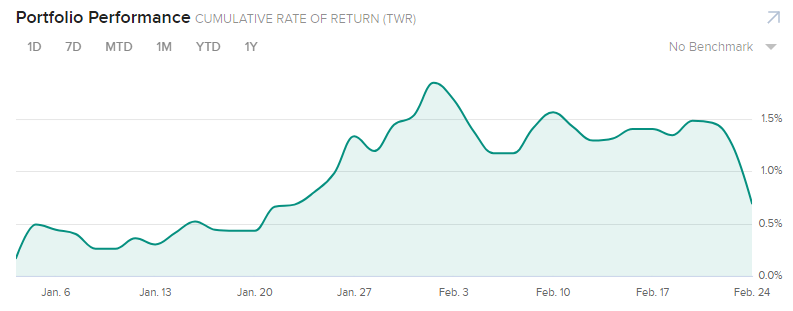
YTD 2020 performance for my public markets portfolio (trading portfolio, buy and hold position, temporary placeholder):
- 0.73%