
What I'm looking at - utilities vs. tech, Yardeni, short term trend, REITs, small caps
Here's what I'm looking at:
Rotation (continued)
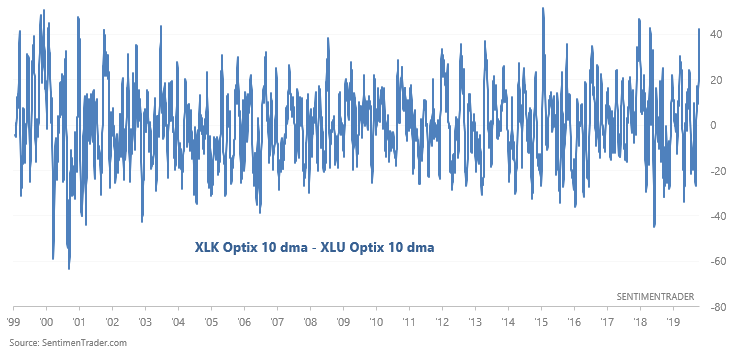
Looking at sector sentiment, it's clear that there's been a shift away from defensive sectors like utilities and a rotation into cyclical sectors (as Jason also mentioned)
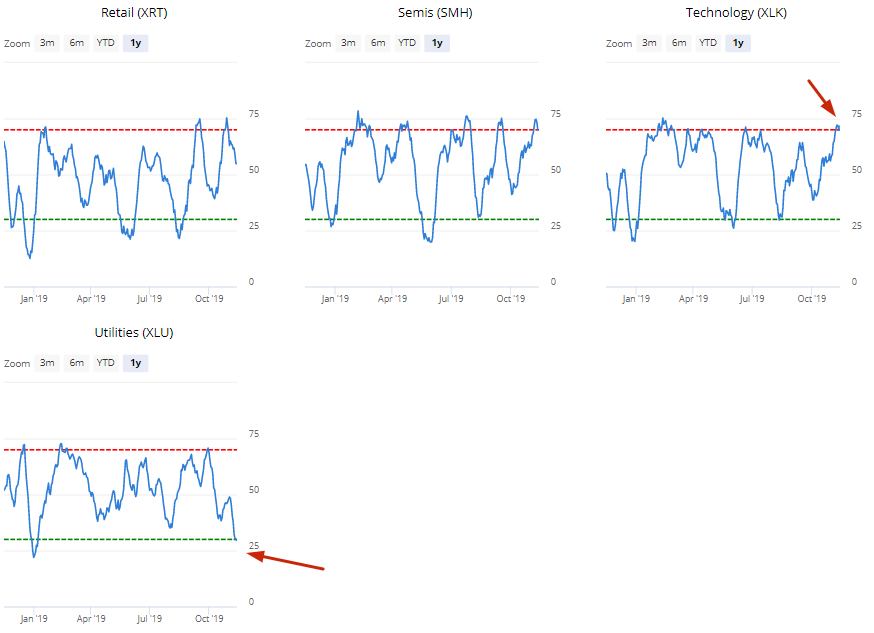
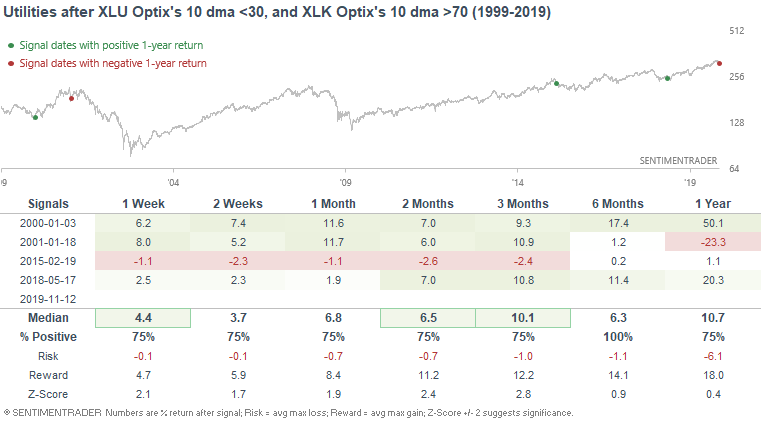
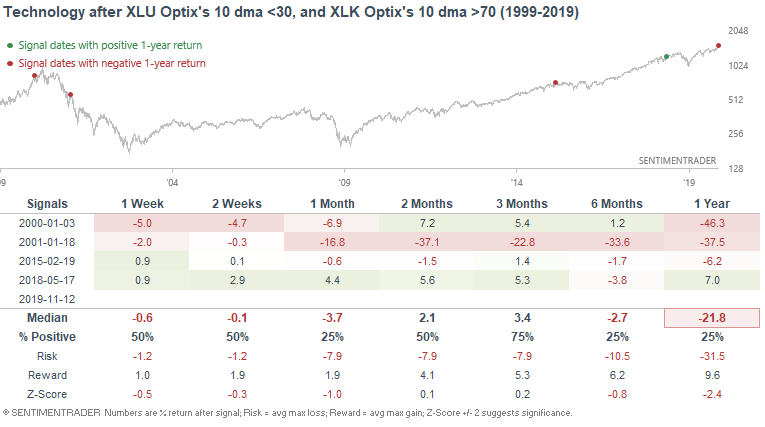
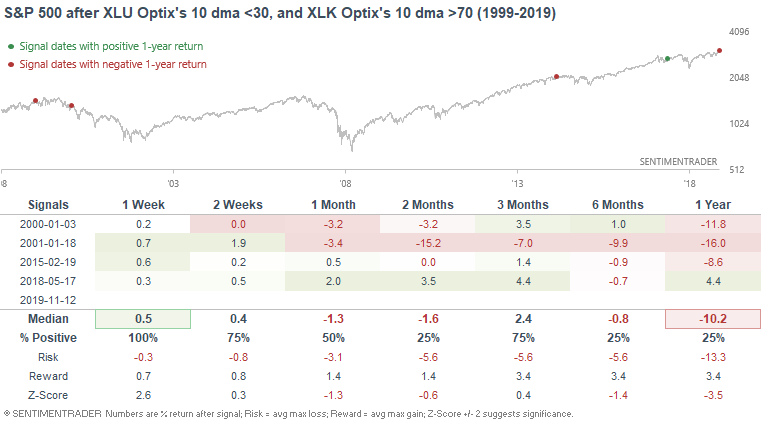
XLU Optix's 10 dma is now below 30, while XLK Optix's 10 dma is now above 70. This is quite a spread. The 4 other times this has happened from 1999-present, it has generally be bullish for utilities and bearish for tech (including the broad U.S. equity market).
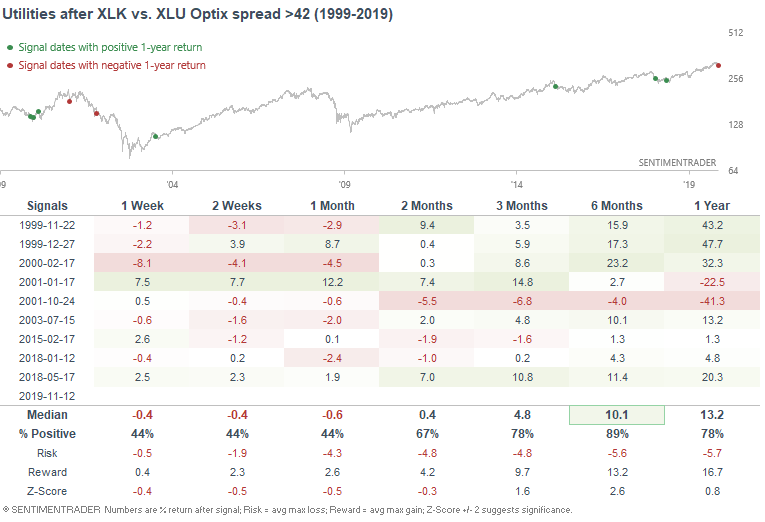
Here's what the S&P 500 utilities sector did next:
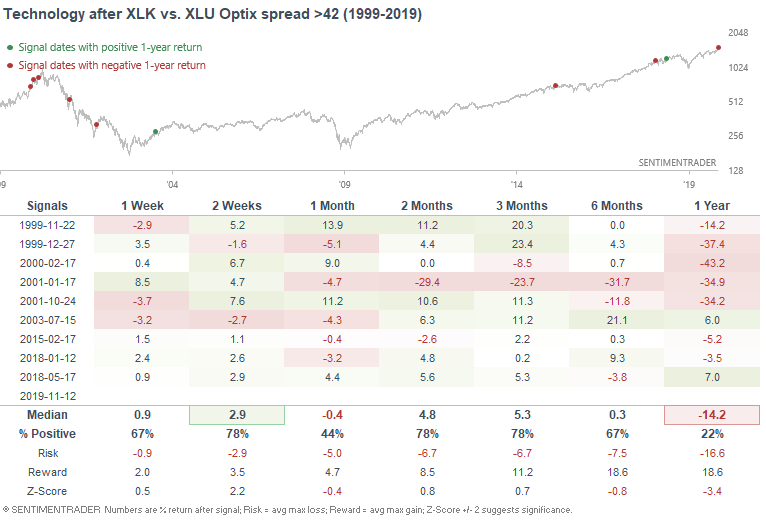
Here's what the S&P 500 technology sector did next:
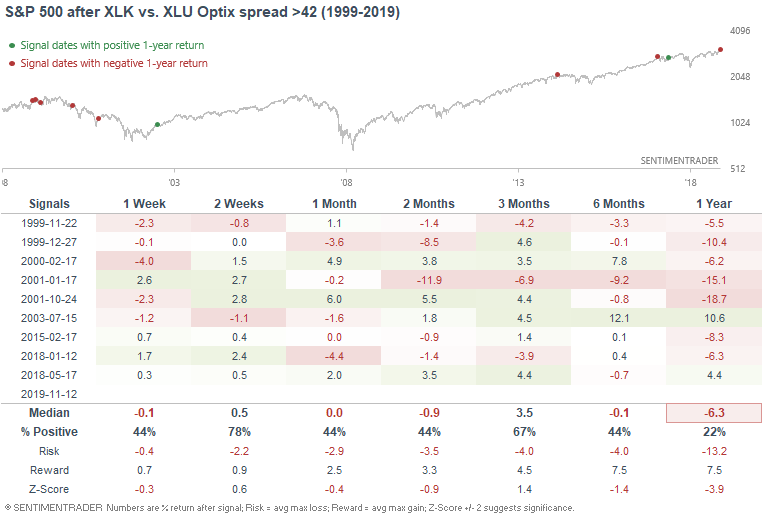
Here's what the S&P 500 did next:
To increase the small sample size, we can look at this from another angle. The following table demonstrates the spread between XLK Optix's 10 dma - XLU Optix's 10 dma:
When this spread reached 42 in the past, utilities often did well over the next 6 months...
...whereas tech and the broad S&P performed poorly over the next year.
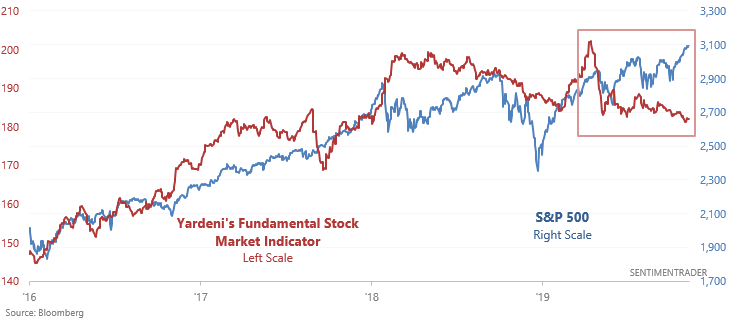
Yardeni's Fundamental Stock Market Indicator
A few days ago Zerohedge posted a chart that demonstrates the divergence between the S&P 500 and Yardeni's Fundamental Stock Market Indicator. This indicator looks at Consumer Comfort, commodities, and initial claims.
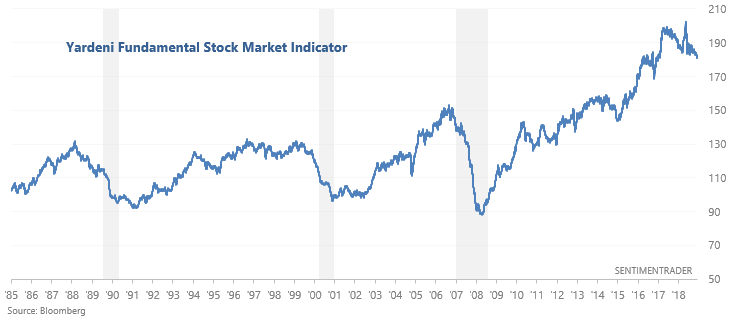
Looking at a long term chart, it's clear that this indicator tends to decline during recessions. However, this wasn't quite a leading indicator: declines tended to occur along with stock market declines.
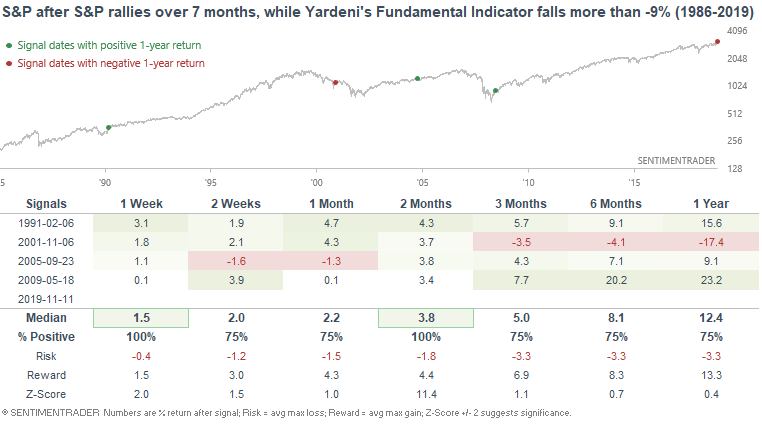
With that being said, are these divergences bearish? The following table looks at cases in which the S&P went up over the past 7 months, while Yardeni's Fundamental Indicator fell more than -9%:
To increase the sample size, we can look at cases in which the indicator fell by more than -5%:
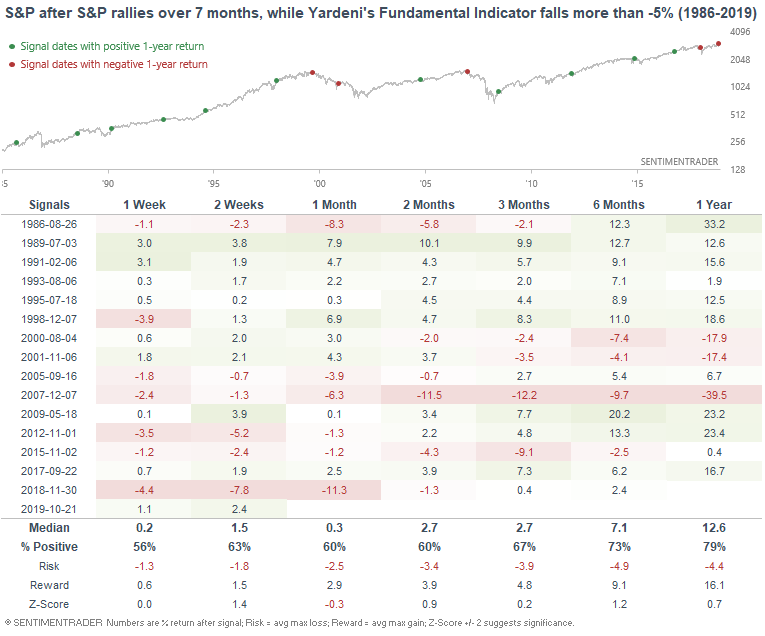
Overall, this is not consistently bearish for the S&P. As I said, the Fundamental Indicator tends to fall along with the S&P 500. Its decline does not usually precede declines in the S&P 500.
Strong short term trend
As Luke Kawa noted, the S&P 500 hasn't touched its 10 dma in 23 days (no daily LOW $ below the 10 dma). This is quite a rare demonstration of short term uptrend persistency, and has only happened 2 other times from 1962-present:
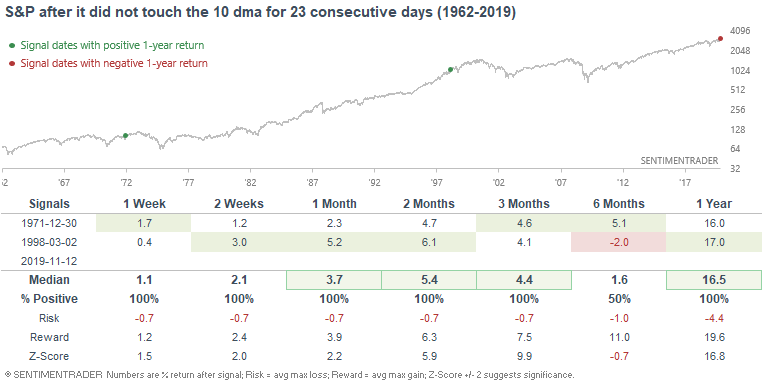
A sample size of 2 is quite small, so to increase the sample size we can relax the parameters and look at cases in which the S&P did not CLOSE below its 10 dma for 23 consecutive days:
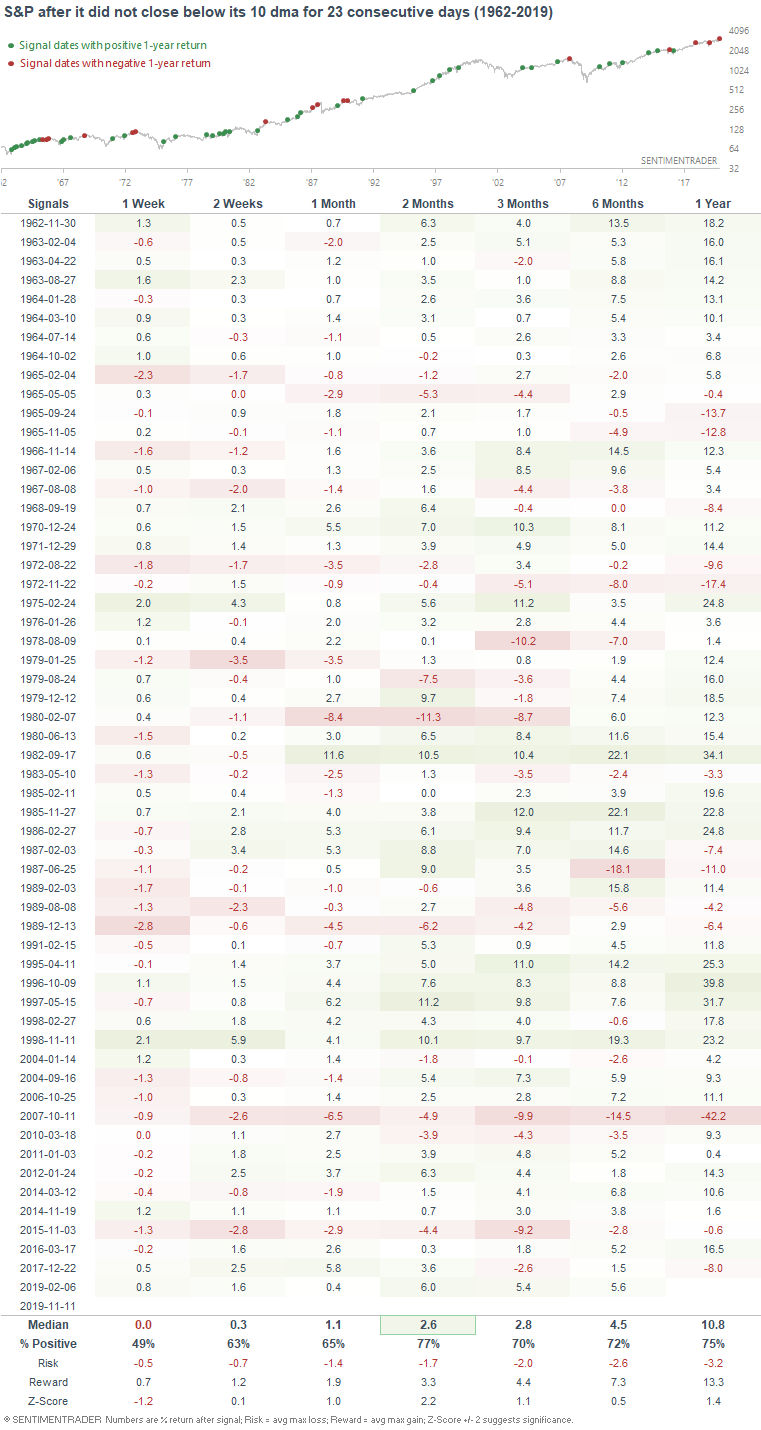
The most recent case was in February, when the streak reached 40 days. Strong short term uptrends can see temporary pullbacks, but are often followed by more gains ahead over the next 2 months.
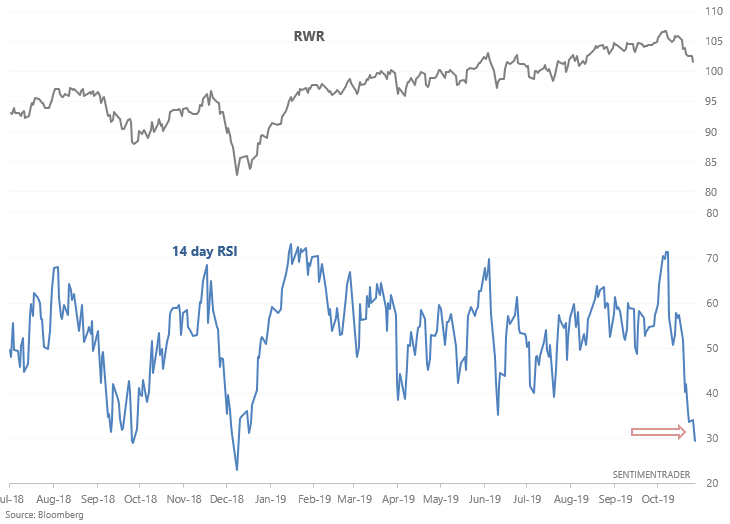
RWR
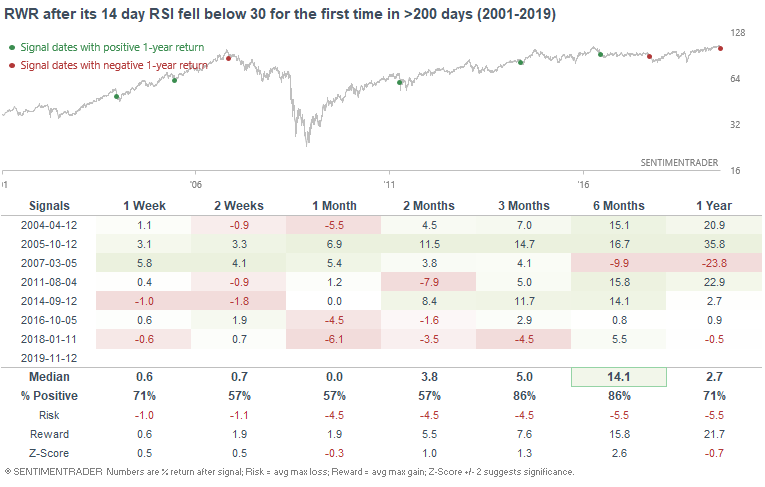
After a strong rally this year (aided by falling interest rates), U.S. REIT's are coming under fire as interest rates rise and investors shift into cyclicals. This has caused RWR (U.S. REIT ETF) to become oversold for the first time since December 2018:
When RWR became oversold for the first time in a long time, it had a tendency to bounce over the next week.
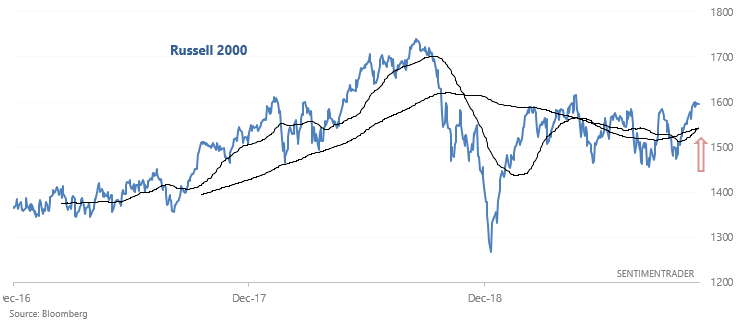
Russell 2000
And lastly, the Russell 2000 has made a golden cross, whereby its 50 dma crossed above its 200 dma:
When it did so in the past, the Russell 2000 was more bullish than random over the next 6 months:
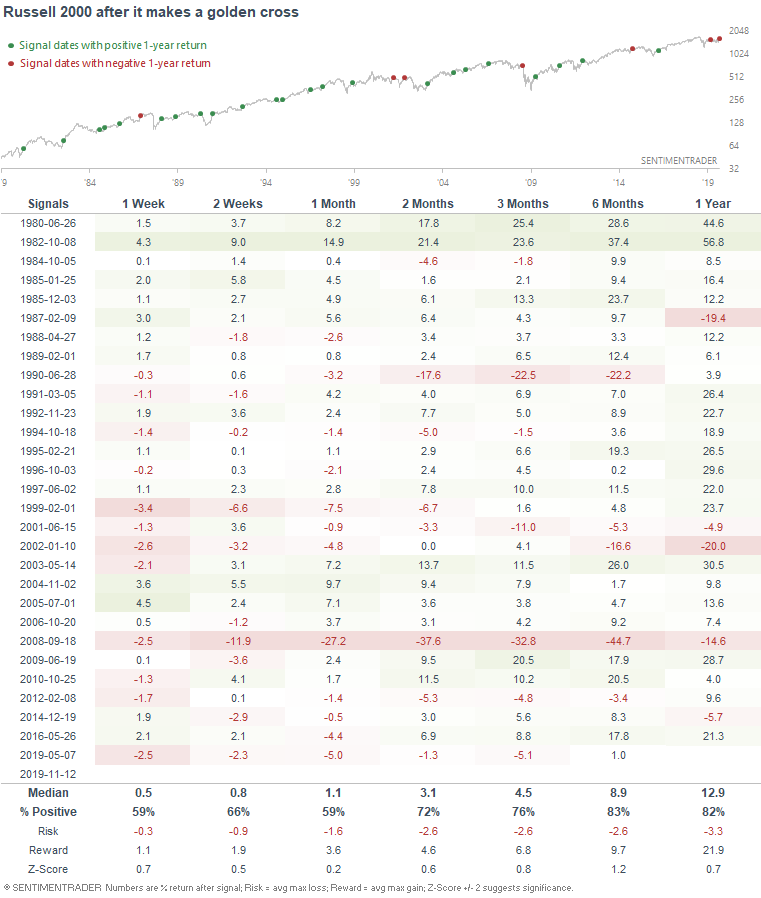
Right now, the primary trend for U.S. equities is UP.