Data &
Technology
Research
Reports
Report Solutions
Reports Library
Actionable
Strategies
Free
Resources
Simple Backtest Calculator
Simple Seasonality Calculator
The Kelly Criterion Calculator
Sentiment Geo Map
Public Research Reports
Free Webinar
Pricing
Company
About
Meet Our Team
In the News
Testimonials
Client Success Stories
Contact
Log inLoginSign up
< BACK TO ALL REPORTS

What I'm looking at - tech correlations, everything rally, utilities, USD

Troy Bombardia
2020-02-19
As the stock market trends higher, more traders are comparing today vs. 1999. Are things really that similar? Meanwhile, "everything is rallying". Here's what this means for markets.

Here’s what I’m looking at:


Tech rally

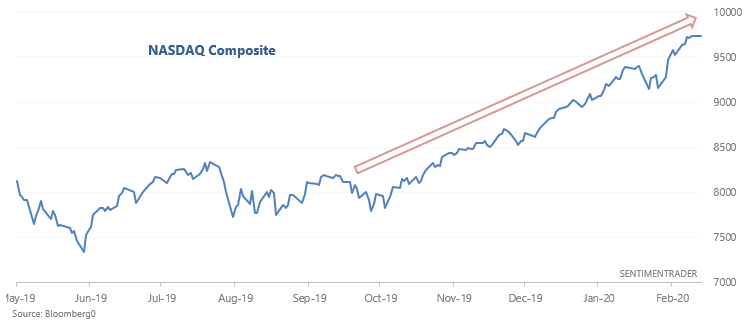
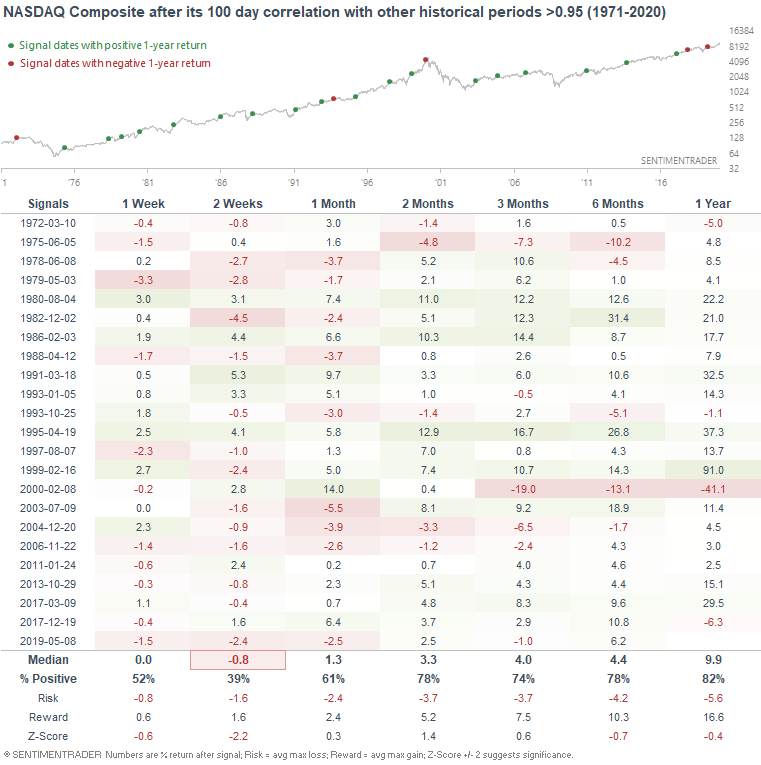
Without a shadow of a doubt, the stock market's rally has been driven by tech. The NASDAQ Composite, NASDAQ 100, and S&P 500 tech sector have surged since October, prompting bears to compare today vs. historical melt-ups that were followed by crashes (e.g. "today is just like 1999"). But as I've said before, the problem with overlapping 2 charts on top of eachother is that you tend to see what you want to see. If you're bearish, you're always going to "spot" the similarities between today vs. 1999. So in the interest of bias-free analysis, let's compare the NASDAQ Composite's rally over the past 100 days against other historical 100 day periods, and look at cases in which the correlation exceeded 0.95

1999-2000 was an extreme case. Looking at all the historical cases which were similar to today, the NASDAQ Composite's returns over the next 2 weeks were poor:

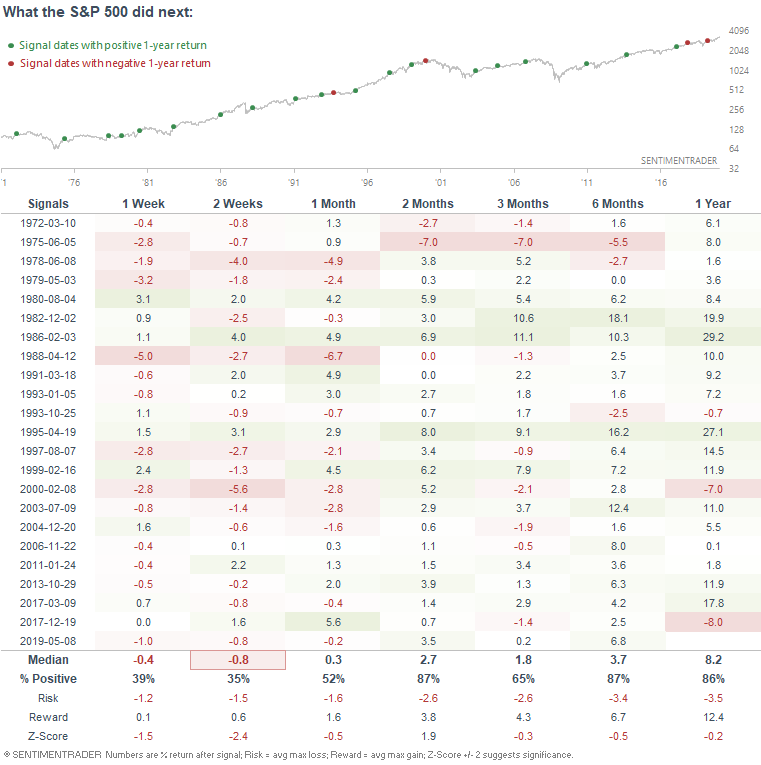
As were the S&P 500's returns over the next 2 weeks.


YTD - everything rallies

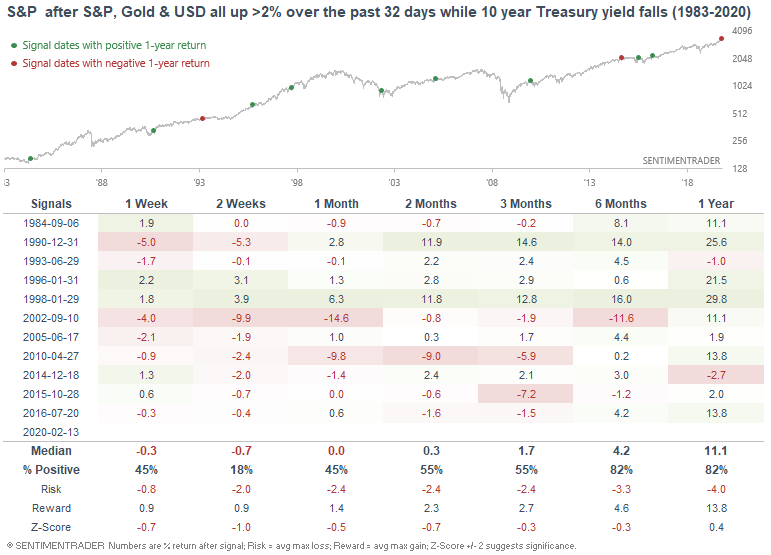
As the WSJ noted, everything has rallied this year so far. The S&P, gold, U.S. Dollar Index, and Treasury bonds are all up. Over the past 32 trading days (approximately 1.5 months), the S&P 500, gold, and USD Index have all rallied more than 2% while the 10 year Treasury yield has fallen.

When this happened in the past, the S&P's returns over the next 2 weeks were poor. This always led to a decline from 2002-present:

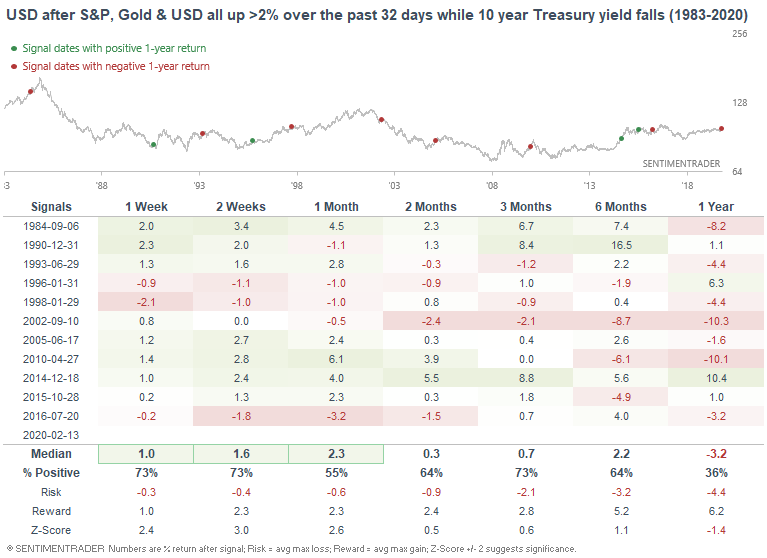
In the meantime, it usually led to more short term gains for the USD Index:

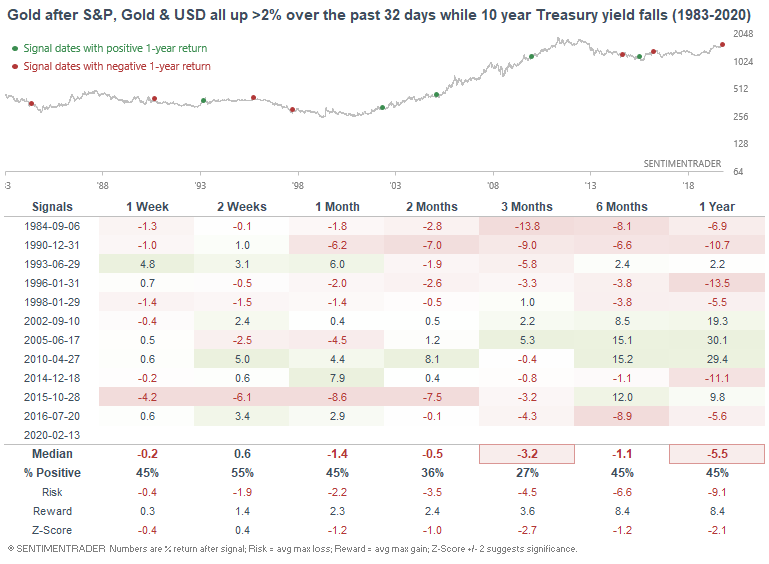
And gold's returns over the next few months were poor:


Utilities

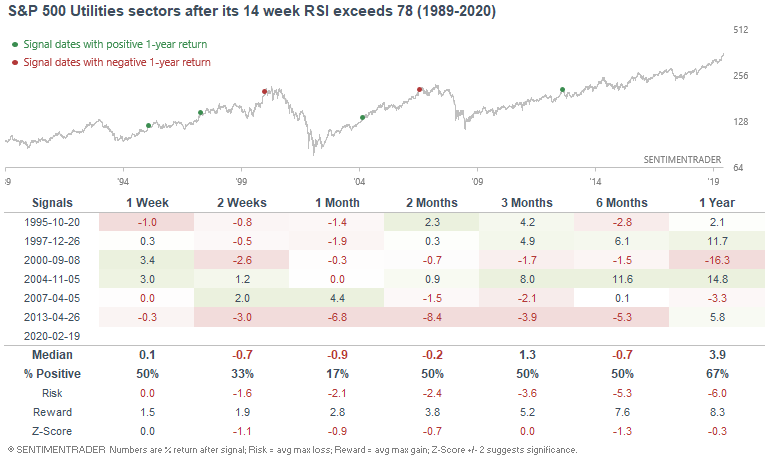
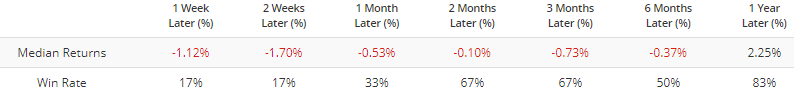
Aside from tech, one of the strongest S&P 500 sectors is utilities. The utilities sector's 14 week RSI is at one of its highest levels in history:

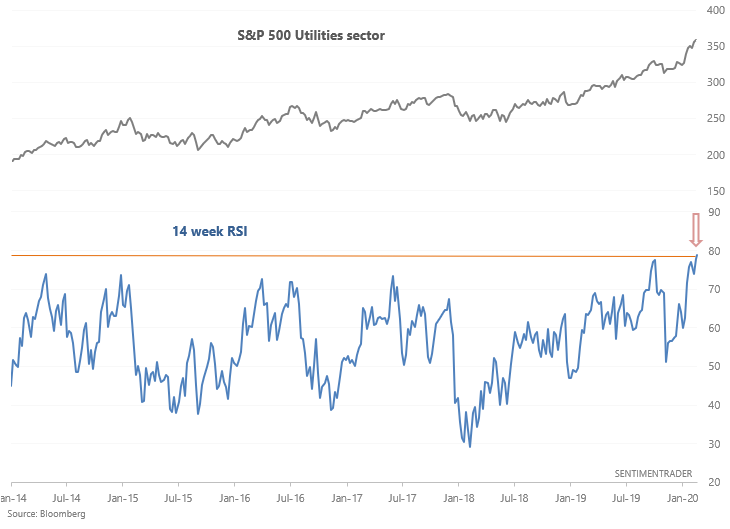
When utilities' momentum was this extreme in the past, the S&P 500 utilities sector usually suffered over the next 2-4 weeks:

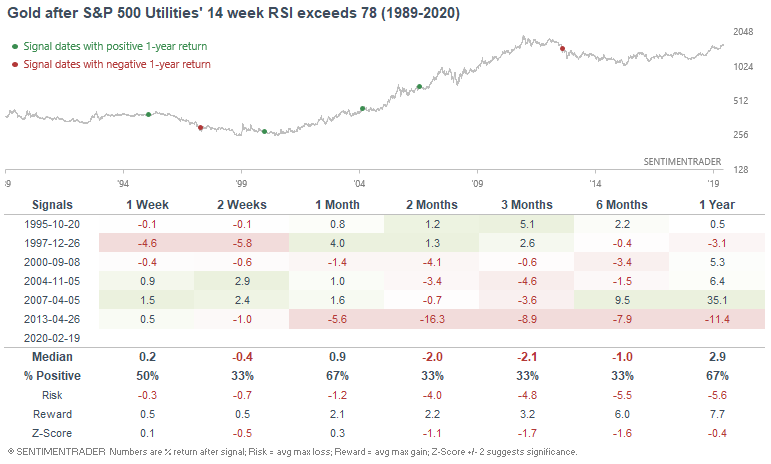
Meanwhile, gold didn't do too well either 2-3 months later.


Currency

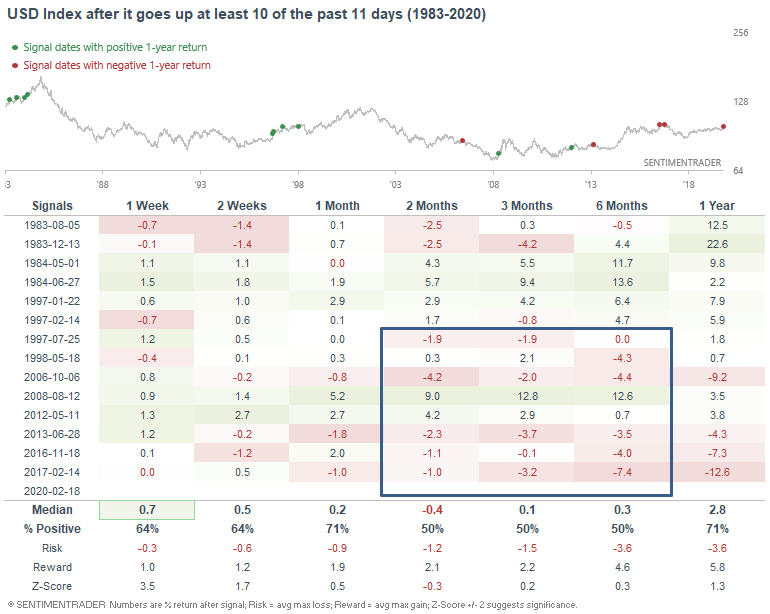
And finally, the USD Index has rallied 10 of the past 11 days. This usually led to more short term gains for the USD, followed by losses over the next 2-3 months, particularly over the past 20 years:

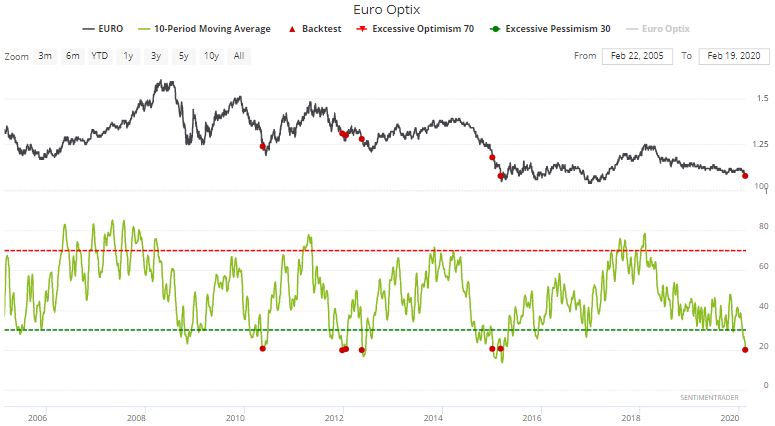
In addition, Euro Optix's 10 dma is extremely low. When this happened in the past, the Euro often fell a little more before bottoming.


*Take my currency thoughts with a grain of salt. I don't trade currencies in my portfolio right now, so I have no skin in the game.


My trading portfolio

My trading portfolio is allocated 50% in the Macro Index Model and 50% in the Simple Trading Model With Fundamentals. At the moment I have instituted a discretionary override and gone 100% long bonds (instead of long stocks) due to the extreme nature of many of our core indicators, even though some of these core indicators aren't in the models.

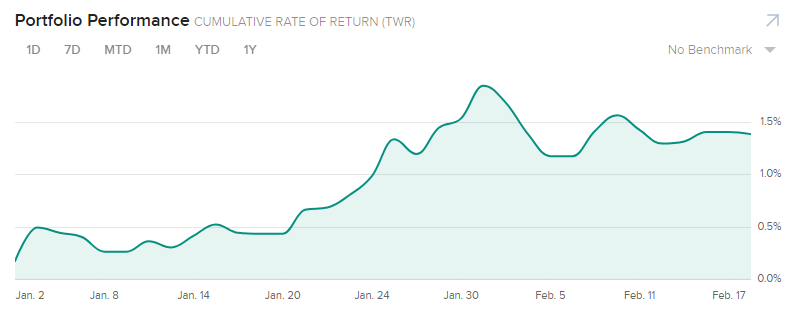
Performance YTD 2020:

  1. My trading account is up 1.38%

  2. Currently 100% in bonds

Sorry, you don't have access to this report

Upgrade your subscription plan to get access
Go to Dasboard
DATA &
TECHnologies
IndicatorEdge
‍
BackTestEdge
‍
Other Tools
‍
DataEdge API
RESEARCH
reports
Research Solution
‍
Reports Library
‍
actionable
Strategies
Trading Strategies
‍
Smart Stock Scanner
‍
FREE
RESOUrCES
Simple Backtest
Calculator
Simple Seasonality
Calculator
The Kelly Criterion
Calculator
Sentiment Geo Map
‍
Public Research Reports
‍
Free Webinar
COMPANY
‍
About
‍
Meet our Team
‍
In the News
‍
Testimonials
‍
Client Success Stories
Pricing
Bundle pricing
‍
Announcements
‍
FAQ
© 2024 Sundial Capital Research Inc. All rights reserved.
Setsail Marketing
TermsPrivacyAffiliate Program
Risk Disclosure: Futures and forex trading contains substantial risk and is not for every investor. An investor could potentially lose all or more than the initial investment. Risk capital is money that can be lost without jeopardizing ones’ financial security or life style. Only risk capital should be used for trading and only those with sufficient risk capital should consider trading. Past performance is not necessarily indicative of future results.

Hypothetical Performance Disclosure: Hypothetical performance results have many inherent limitations, some of which are described below. No representation is being made that any account will or is likely to achieve profits or losses similar to those shown; in fact, there are frequently sharp differences between hypothetical performance results and the actual results subsequently achieved by any particular trading program. One of the limitations of hypothetical performance results is that they are generally prepared with the benefit of hindsight. In addition, hypothetical trading does not involve financial risk, and no hypothetical trading record can completely account for the impact of financial risk of actual trading. for example, the ability to withstand losses or to adhere to a particular trading program in spite of trading losses are material points which can also adversely affect actual trading results. There are numerous other factors related to the markets in general or to the implementation of any specific trading program which cannot be fully accounted for in the preparation of hypothetical performance results and all which can adversely affect trading results.

Testimonial Disclosure: Testimonials appearing on this website may not be representative of other clients or customers and is not a guarantee of future performance or success.