What I'm looking at - surging volume, copper's warning, pessimism
Here's what I'm looking at:
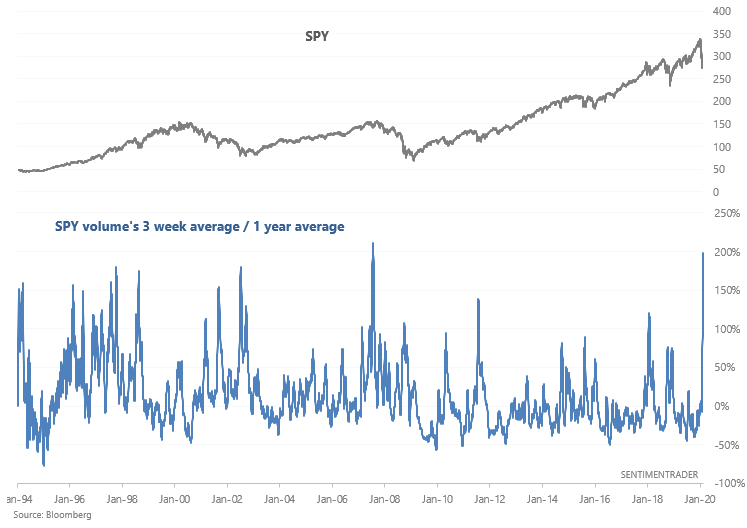
Volume
The stock market continues to swing massively from day to day. On days when the S&P spikes, all stocks go up. On days when the S&P tanks, all stocks go down. This type of manic up-down-up-down behavior has caused our Liquidity Premium indicators to spike and has caused volume to soar. SPY volume's 3 week average is almost 200% more than its 1 year average:
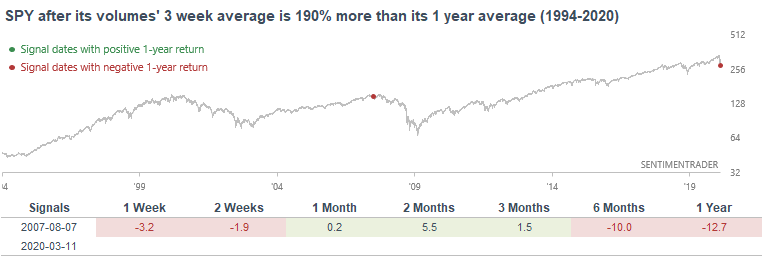
The only other similar historical case occurred during August 2007 when fears of a financial sector meltdown first began. That historical case saw a decent rally over the next few months:
If we loosen the parameters, we can look at historical cases in which SPY volume's 3 week average was more than 150% greater than its 1 year average:
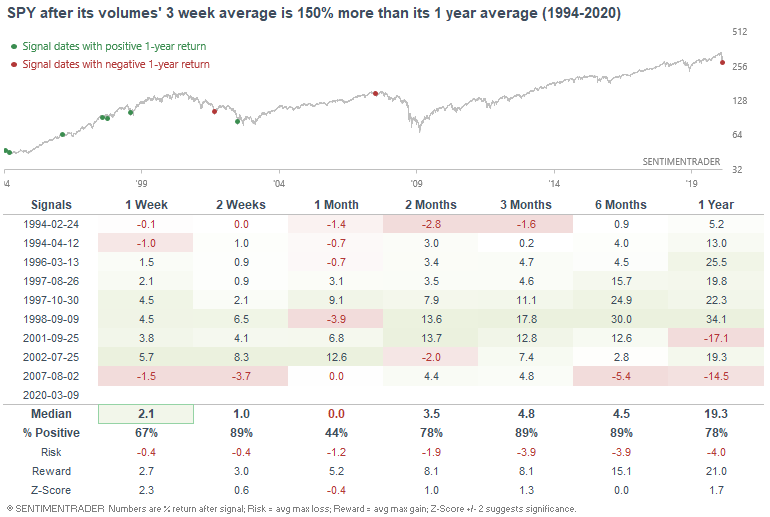
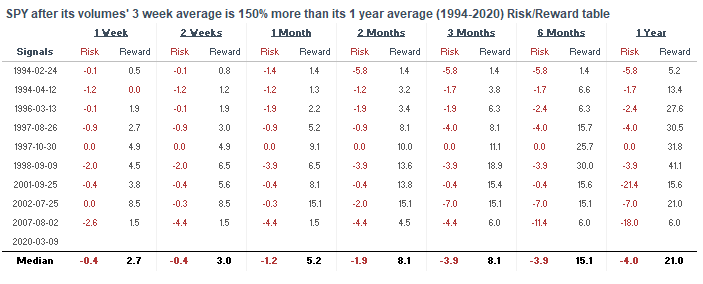
When this happened in the past, SPY (and the S&P 500) often rallied over the next 3 months. Here's the risk:reward table:
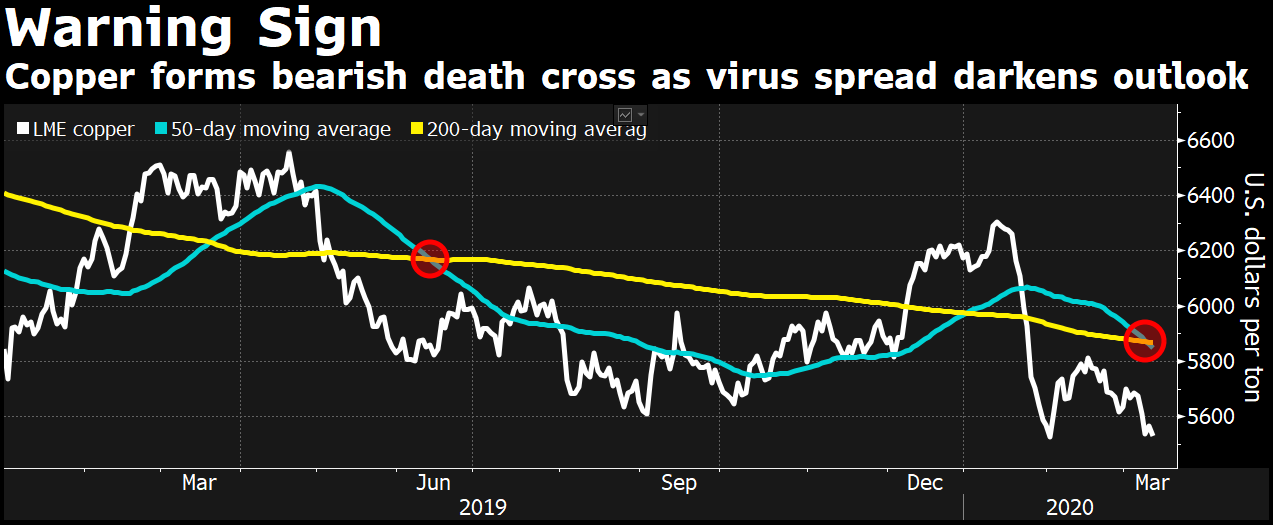
Copper's warning sign?
As Bloomberg noted, copper formed a bearish cross (50 dma fell below 200 dma). While this is often seen as a bearish sign for equities ("Dr. Copper is telling us that something isn't right in the economy"), plenty of studies here at SentimenTrader have proven that isn't always the case.
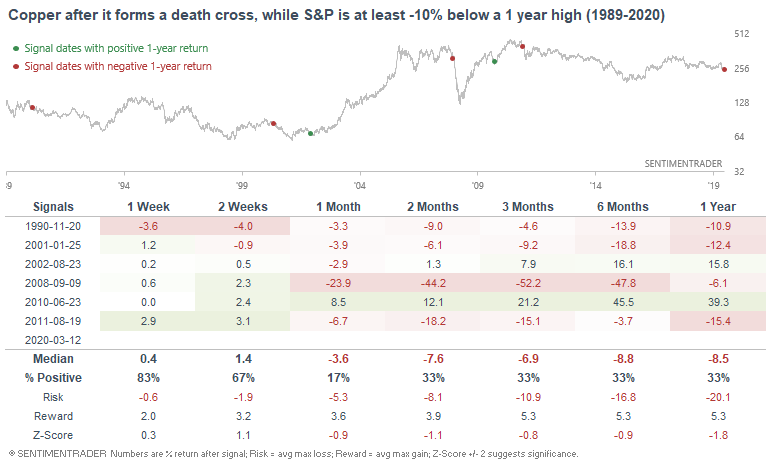
However, there is something to be said about a potential bearish sign from Dr. Copper when the stock market is already in a slump (I.e. stocks are confirming the bearish narrative from copper). The following table looks at what happened next to the S&P 500 when it was more than -10% below a 1 year high, while copper formed a bearish death cross:
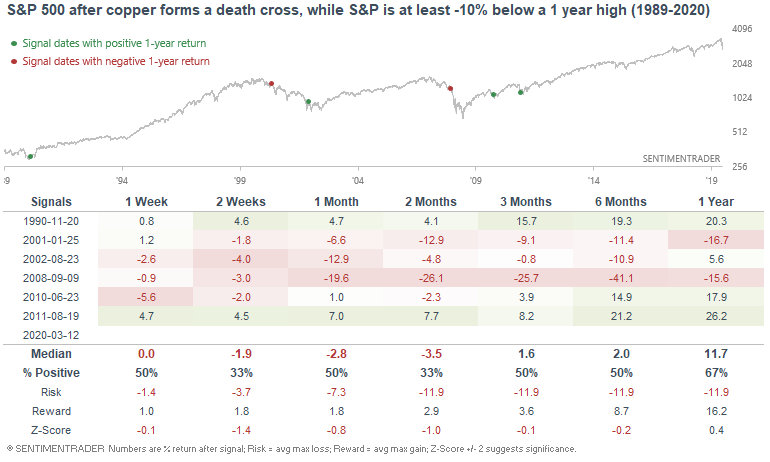
This wasn't such a big deal during bull markets (e.g. June 2010 and August 2011), when this came closer to marking bottoms than tops. But in bear markets, this wasn't a good sign (since few things are bullish factors in bear markets except extreme selling/sentiment). As for copper, this wasn't a very optimistic sign over the next 1-3 months:
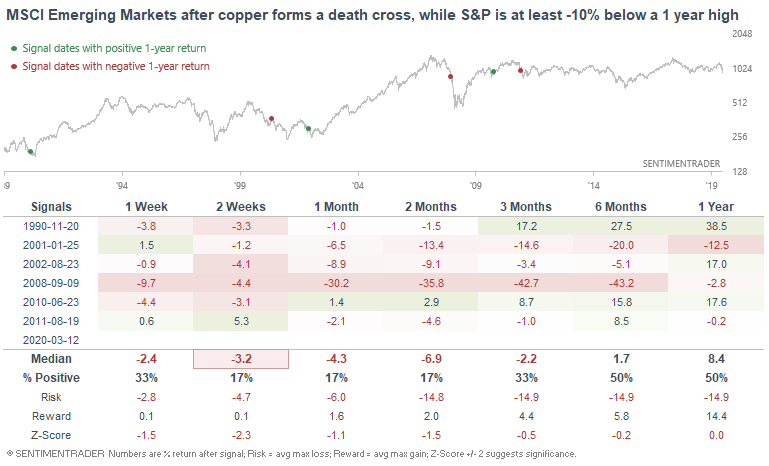
And since emerging markets are more closely related to commodities than U.S. equities, this wasn't a short term bullish sign for the MSCI Emerging Markets Index:
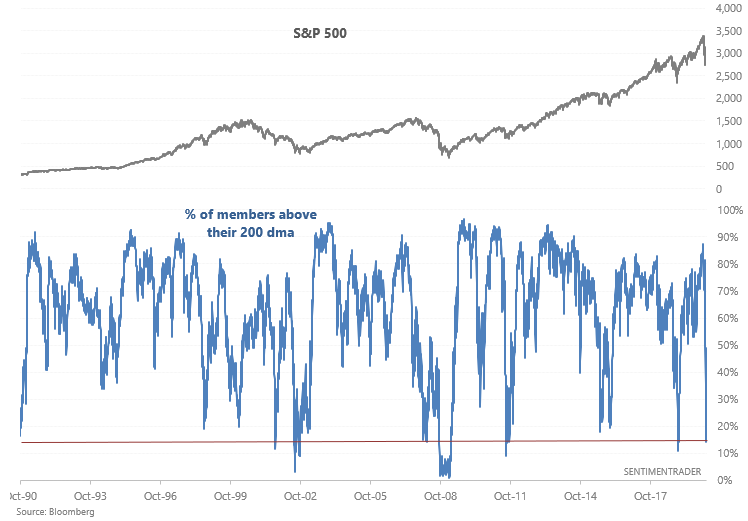
200 day moving average breadth
Global equities continue to slide. With the S&P 500 down -20% from an all-time high, less than 15% of its members are above their 200 day moving averages.
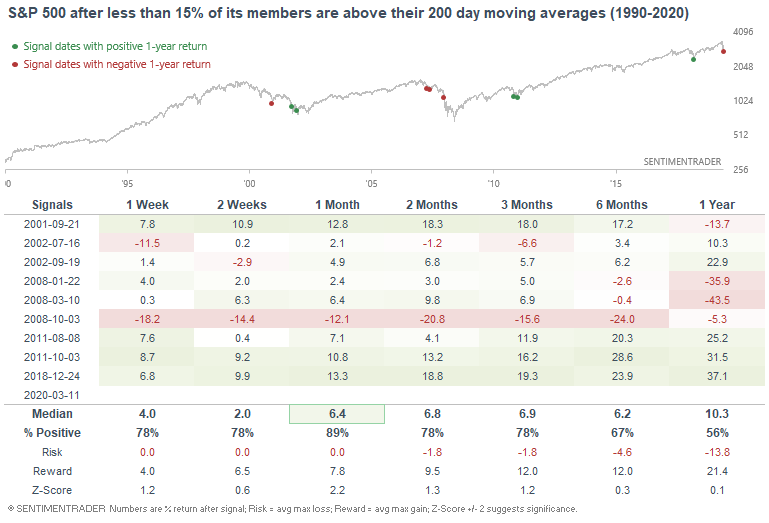
When so many S&P 500 stocks were in a downtrend (looking for unique cases over a 1 month period), the S&P's returns over the next month were almost always bullish. The one big exception came in October 2008 during the worst of the financial meltdown:
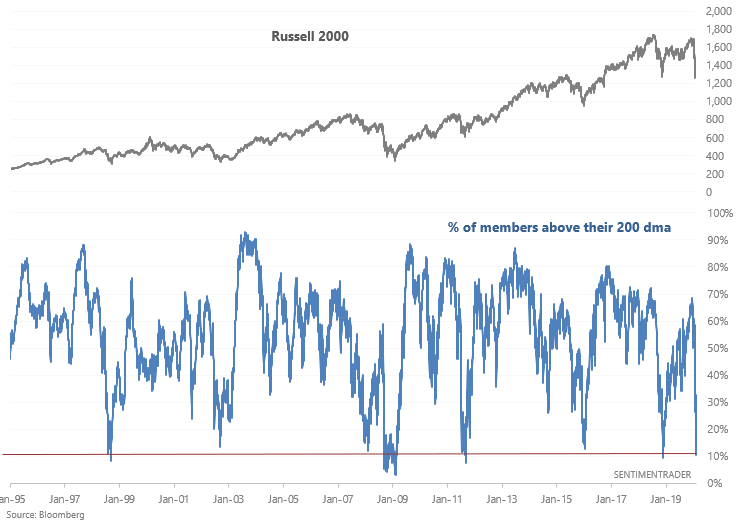
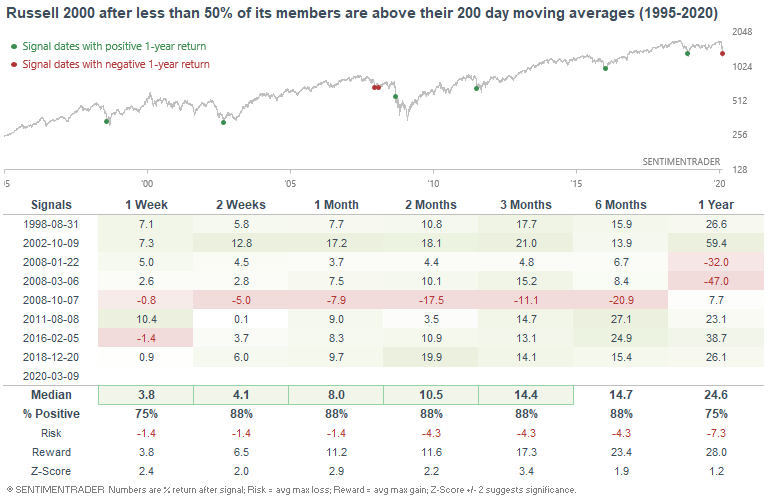
Similarly, fewer than 15% of the Russell 2000's members are above their 200 day moving averages:
When this happened in the past, the Russell 2000's returns over the next 1-6 months were almost always bullish, with the big exception of October 2008:
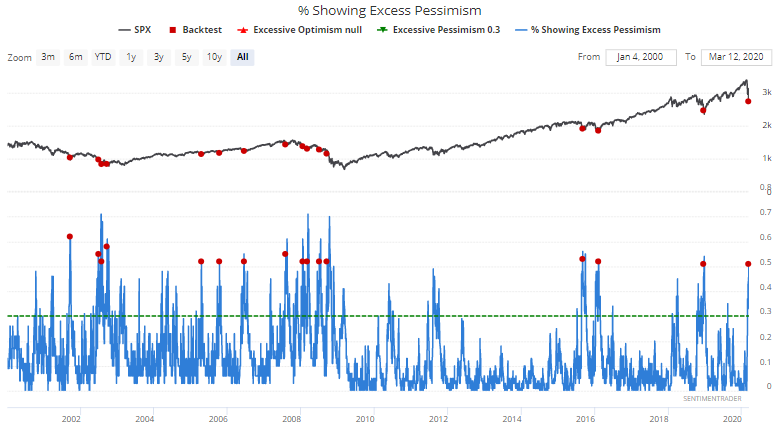
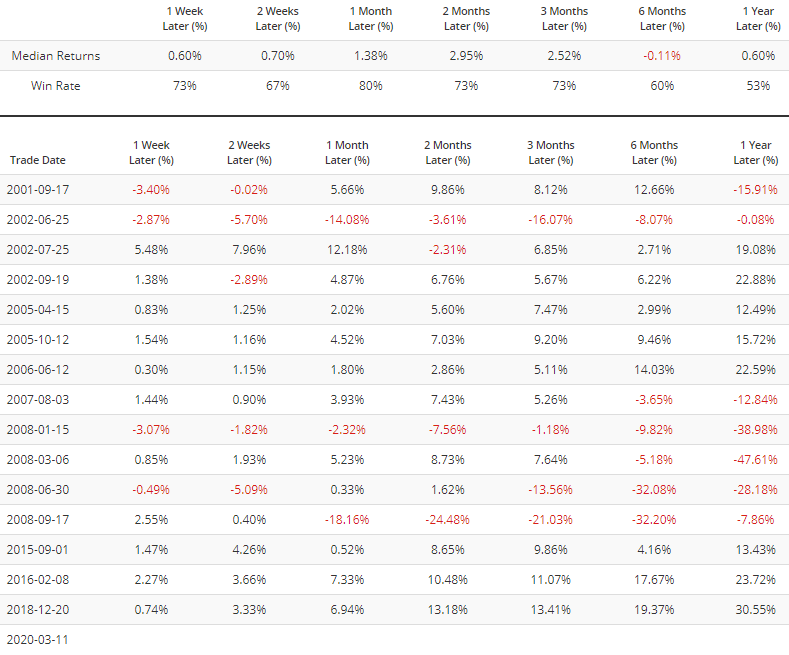
Sentiment
And finally, more than 50% of the sentiment indicators that we follow are showing excess pessimism. When we exclude overlapping signals over the next month, this usually led to a S&P 500 rally 1 month later. Once again, the few bearish cases over the next month occurred during major 50%+ bear markets (2002 and 2008):