
What I'm looking at - State Coincident Index, Conference Board, McClellan Summation, TLT Optix, Treasury yields
The stock market is flat ahead of Jackson Hole. Here's what I'm looking at:
Philly Fed State Coincident Index
The Philadelphia Federal Reserve creates a coincident index for each state that looks at whether a state's economy is improving or deteriorating. The Philly Fed then combines this into a one-month diffusion index, which can be used to gauge the overall health of the U.S. economy. As you can see in the chart below, this diffusion index has fallen below 60.
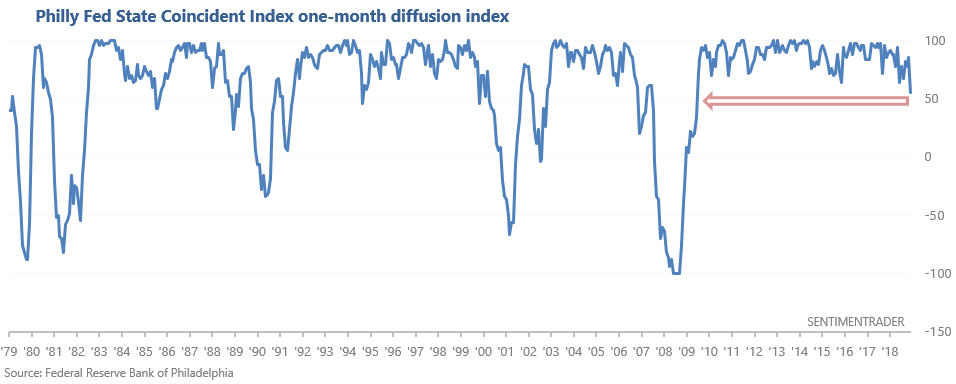
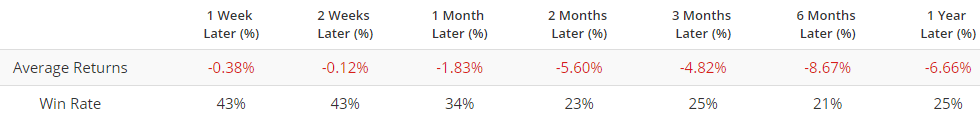
Readings below 60 often coincided with economic recessions in the past, particularly if they occurred later in the economic expansion cycle. Here's what happened next to the S&P 500 when the State Coincident Index's one-month diffusion fell below 60, while Unemployment is under 6% (i.e. later in the economic expansion).
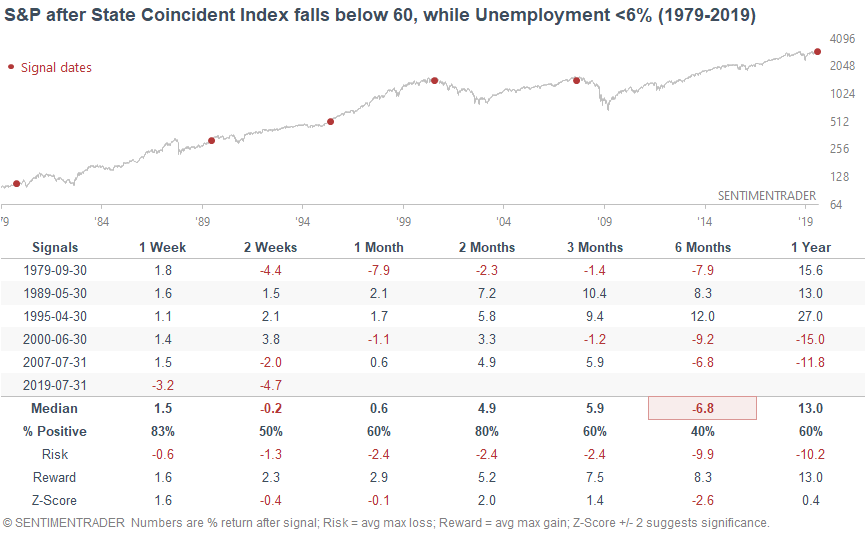
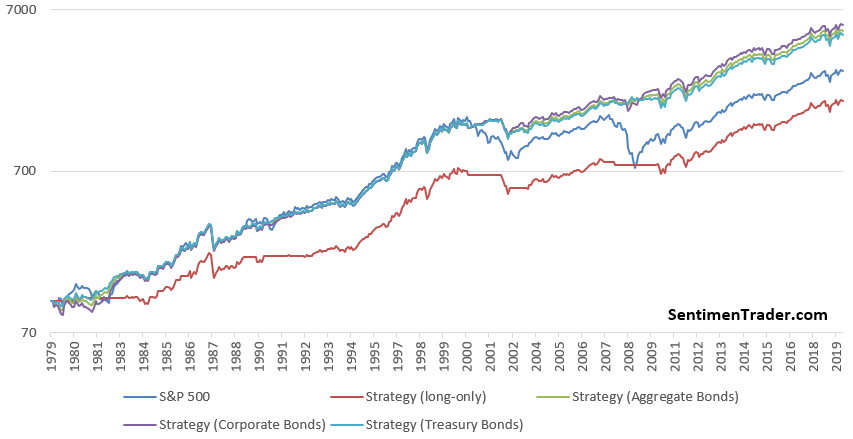
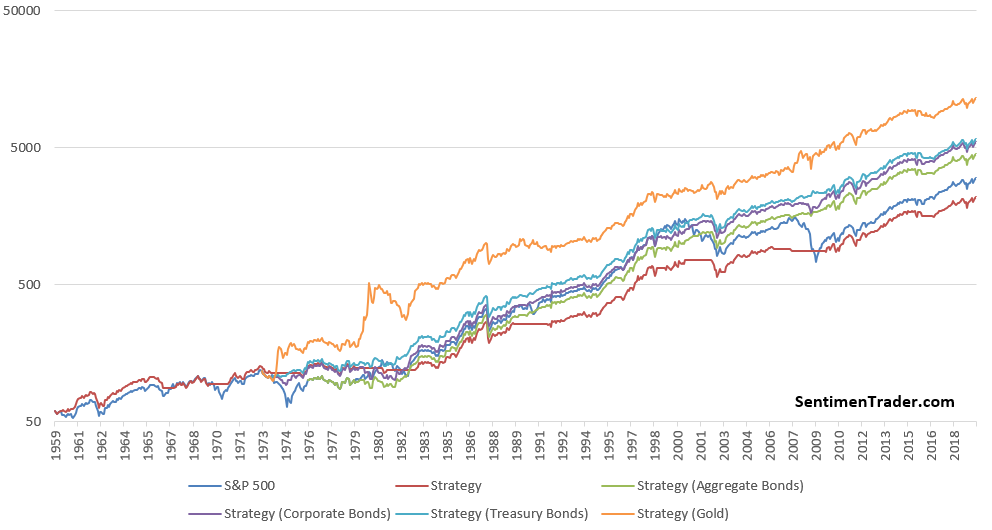
With the exception of 1995 (which saw notable economic slowdown, but no recession), each of these cases occurred within 1 year of a recession and at least -20% drop in the stock market. The following chart demonstrates that it's better to go long the S&P when the Coincident Index is above 60. It compares:
- Buy and hold the S&P 500
- Buy the S&P if the Coincident Index > 60, otherwise shift to cash.
- Buy the S&P if the Coincident Index > 60, otherwise shift to the Bloomberg Barclays U.S. Aggregate Bond Index
- Buy the S&P if the Coincident Index > 60, otherwise shift to the Bloomberg Barclays U.S. Corporate Bond Index
- Buy the S&P if the Coincident Index > 60, otherwise shift to the Bloomberg Barclays U.S. Treasury Bond Index
Overall, this is a long term worry for the stock market from a fundamental perspective. The only consolation for bulls is that most of the economic weakness has centered around Midwest states like Wisconsin and Michigan, which have been more adversely impacted by the trade war (and China's retaliatory efforts). So the extent of economic deterioration in the U.S. isn't widespread. Watch this indicator closely over the next few months to see if deterioration spreads.
Conference Board Leading Economic Index (LEI)
The Conference Board Leading Economic Index - a popular leading economic indicator for the U.S. economy - has made a new all-time high.
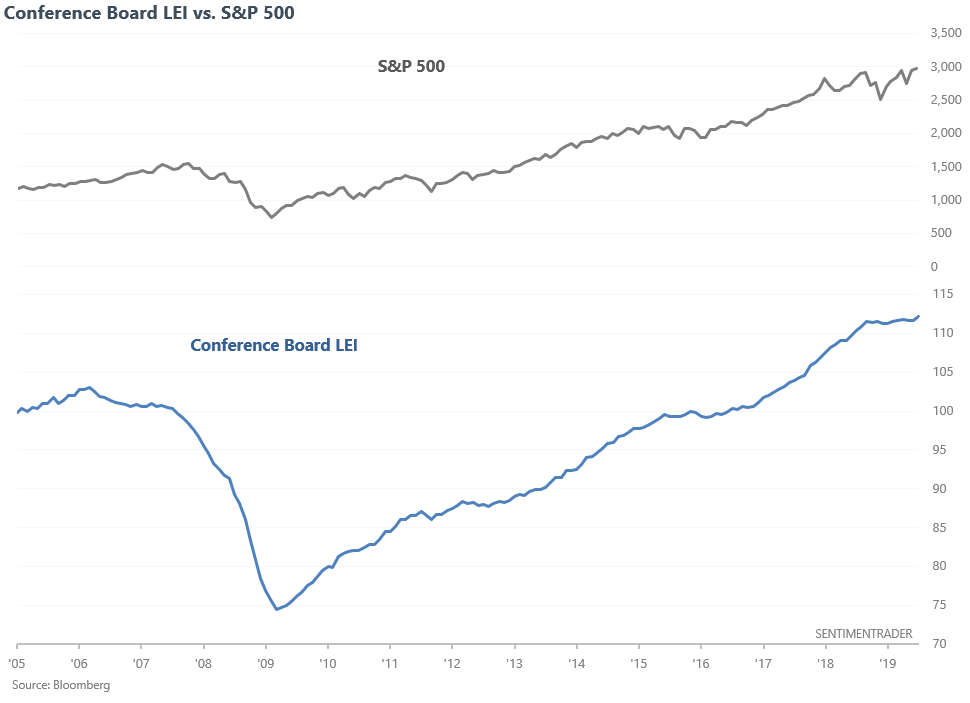
The best way to use the Conference Board LEI, as with most economic indicators, is to focus on its trend. I.e. if the Conference Board LEI is "trending up", be bullish on stocks. If the Conference Board LEI is not trending up, be bearish on stocks. One way to judge the Conference Board LEI's trend is to look at its 6 month moving average, and whether this average is going up or down.
The following chart looks at:
- S&P 500
- Buy and hold the S&P 500 if the Conference Board LEI is going up. Otherwise, sell and shift into cash.
- Buy and hold the S&P 500 if the Conference Board LEI is going up. Otherwise, sell and shift into the Bloomberg Barclays U.S. Aggregate Bond Index
- Buy and hold the S&P 500 if the Conference Board LEI is going up. Otherwise, sell and shift into the Bloomberg Barclays U.S. Corporate Bond Index
- Buy and hold the S&P 500 if the Conference Board LEI is going up. Otherwise, sell and shift into the Bloomberg Barclays U.S. Treasury Bond Index
- Buy and hold the S&P 500 if the Conference Board LEI is going up. Otherwise, sell and shift into gold.
With the Conference Board LEI making new highs, this strategy remains a BUY right now (Conference Board LEI's 6 month average is going up).
With that being said, the Conference Board has a Coincident Indicator that examines U.S. economic indicator which turn bearish only after a recession has started. As a result, the Conference Board's Leading Economic Indicator tends to trend downwards before the Coincident Indicator.
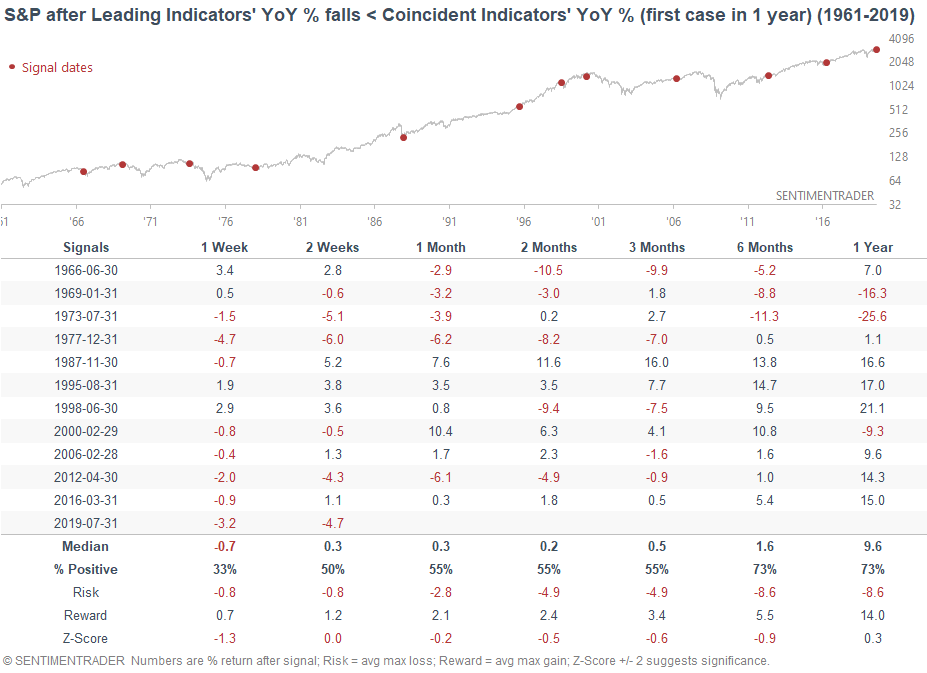
The Leading Indicator's year-over-year % change has now fallen over the Coincident Indicator's year-over-year % change.
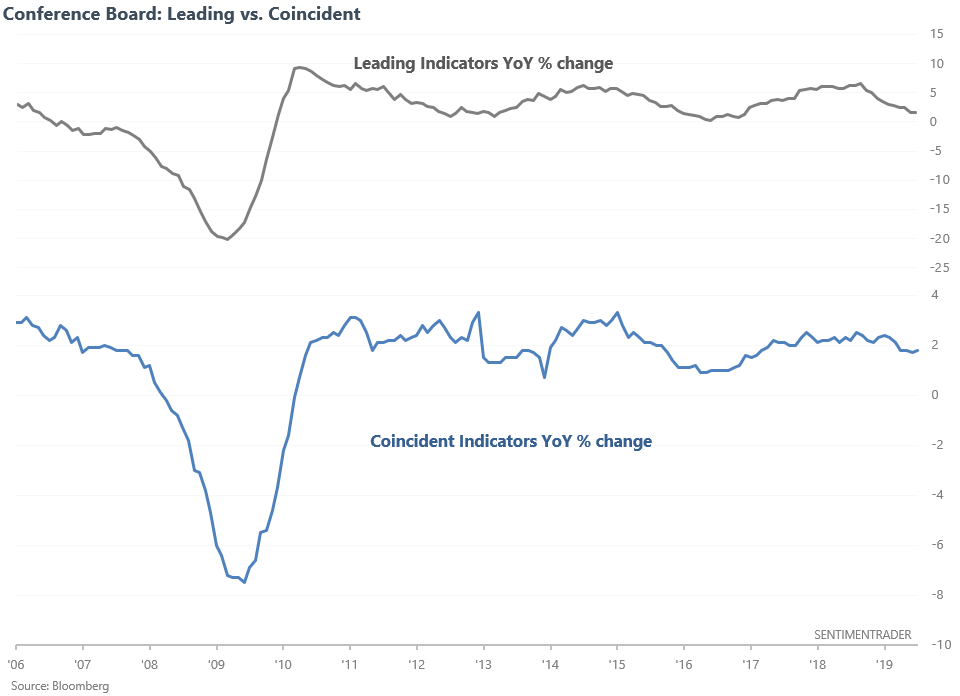
Past recessions were preceded by the Leading Indicator's year-over-year change falling below the Coincident Indicator's year-over-year change. However, such an event didn't always lead to a recession (necessary but not sufficient).
Overall, the Conference Board LEI remains a bullish factor for the S&P.
McClellan Summation
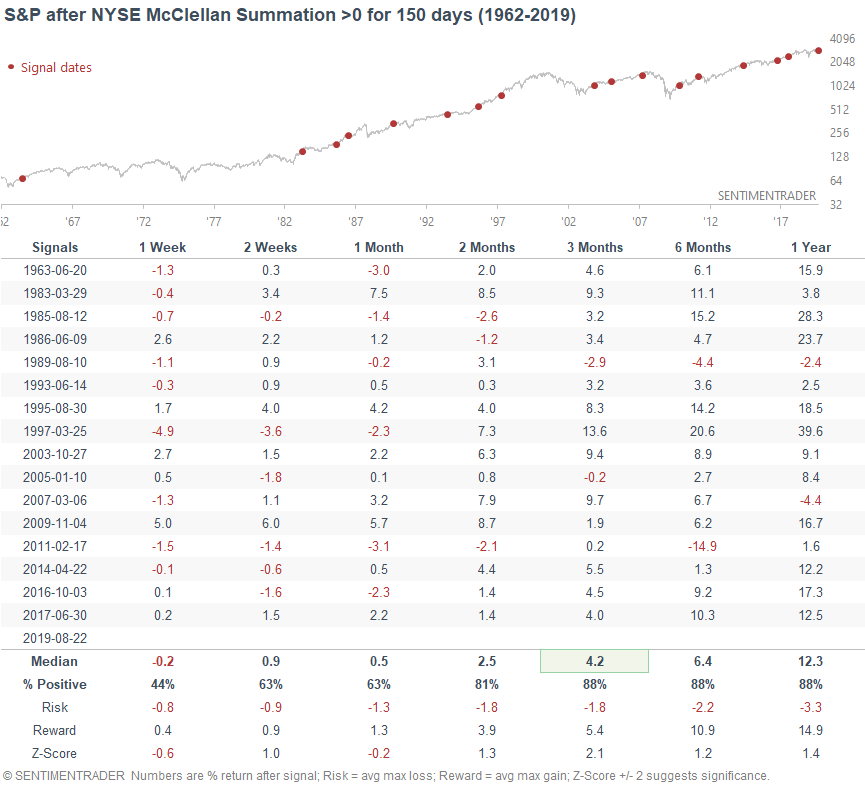
The NYSE McClellan Summation Index is a long term look at the momentum of the stock market's breadth. When it is above zero, momentum is positive.
The NYSE McClellan Summation Index has been above zero for 150 consecutive days, which is a rather long streak.
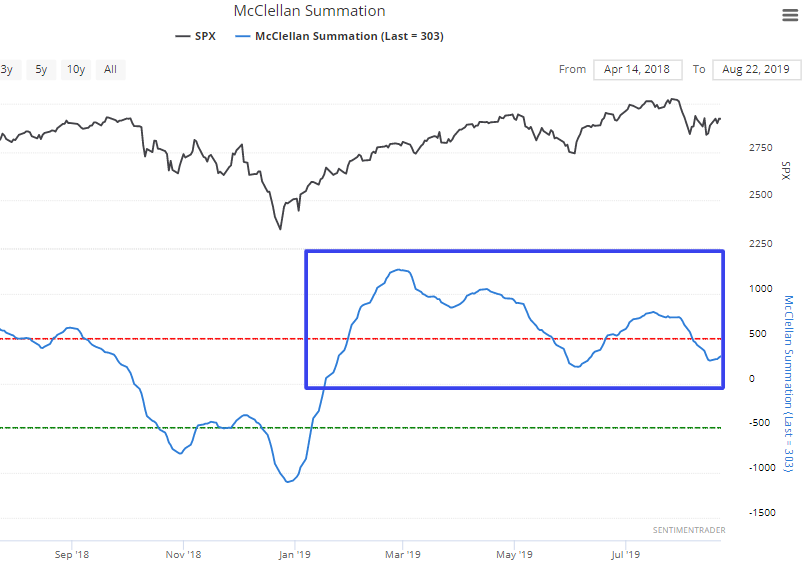
Such streaks in the past were mostly positive for stocks over the next 3 months.
TLT
Our Optimism Index for TLT's (20+ year Treasury bond ETF) 20 day average now exceeds 73. Such high sentiment readings in the past were mostly bearish for TLT over the next few months.
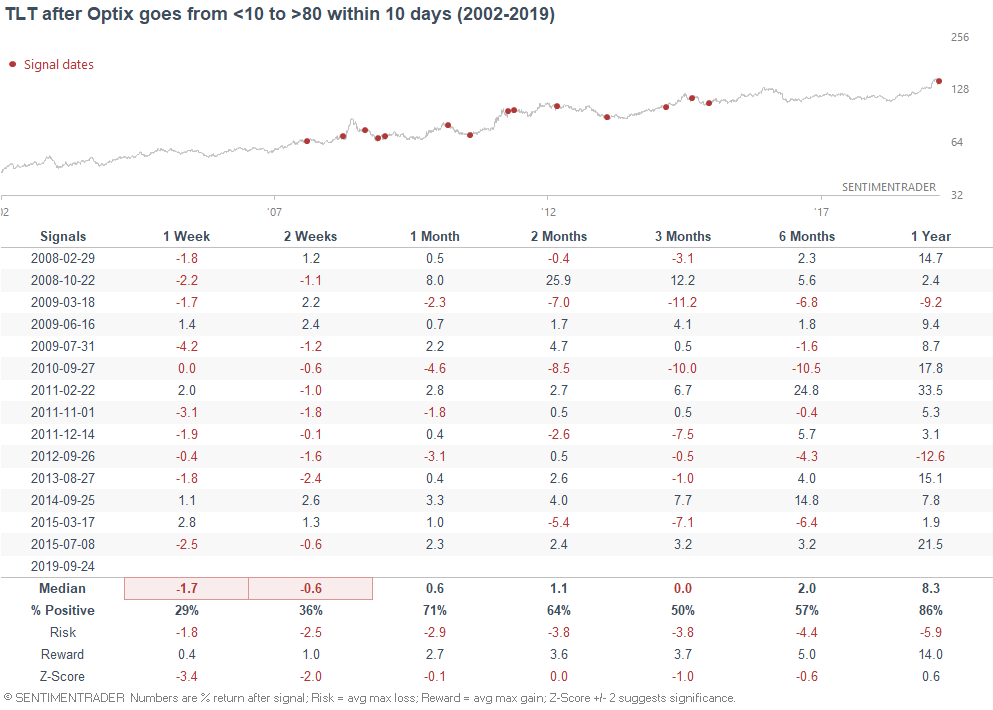
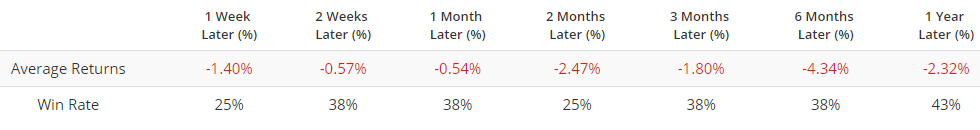
Even if we only look at the first case in 50 days (to remove overlapping cases), TLT's forward returns over the next few months are still more bearish than random.
Bond yields
And lastly, the 10 year Treasury yield's 14 day RSI finally escaped oversold territory (RSI < 30) on Wednesday. Are Treasury yields finally ready to rally after being oversold for a long time?
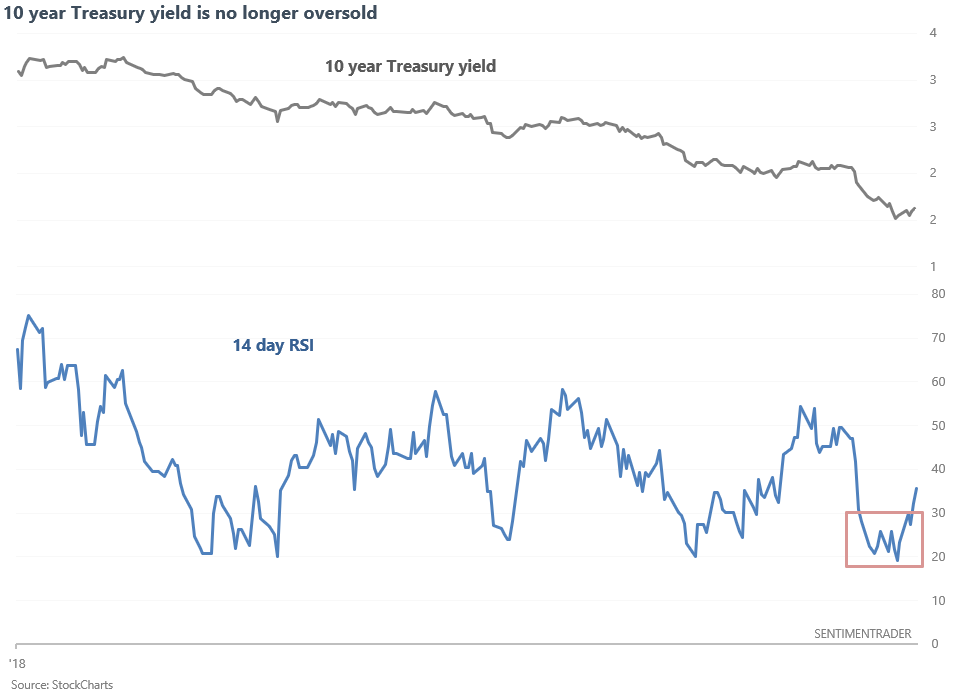
Here's what happened next to the 10 year Treasury yield when its 14 day RSI exceeded 30 for the first time in at least 13 days.

The 10 year yield went up more often than not over the next 2 weeks.