What I'm looking at - split breadth, sudden crash, VIX jump, copper's crash, gap down
Yesterday was the stock market's first meaningful daily decline in a long time. Here's what I'm looking at:
Hindenburg Omen
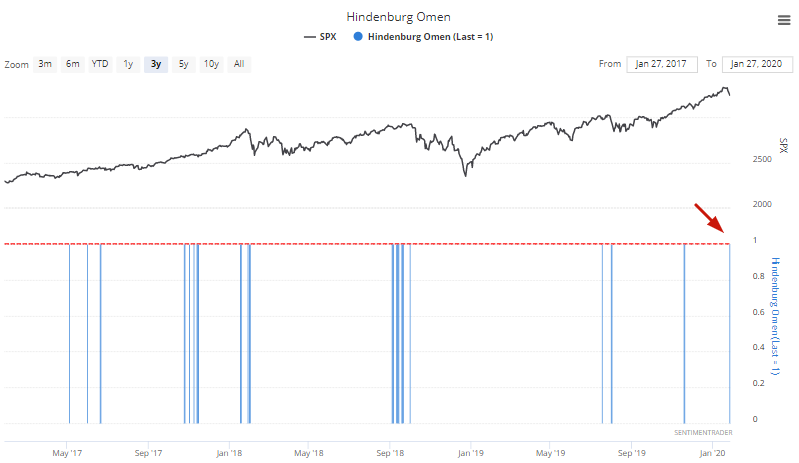
The U.S. stock market's breadth has been very strong over the past few weeks. This was to be expected - the market had been trending higher for months, with many individual stocks making new highs. But the stock market's rapid 2 day decline has pushed the McClellan Oscillator deep into negative territory. As a result, the Hindenburg Omen has been once again triggered.
The Hindenburg Omen, which represents split market conditions, is extremely useful for predicting stock market declines. That's why it's one of 2 indicators I've included in various trading models.
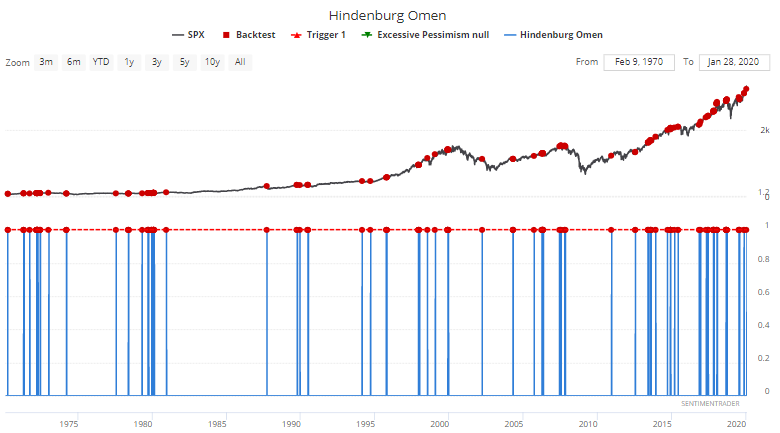
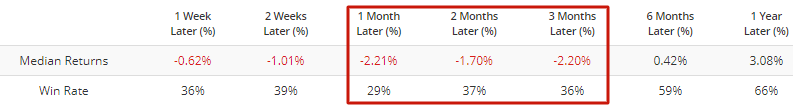
When the Hindenburg Omen was triggered in the past, the S&P's returns over the next month were exceptionally weak.
NYSE HiLo Logic Index
The Hindenburg Omen is one of two sentiment indicators I've included in various trading models, and the NYSE HiLo Logic Index is the other. Like the Hindenburg Omen, the NYSE HiLo Logic Index also demonstrates split market conditions in which there are many 52 week highs and 52 week lows at the same time:
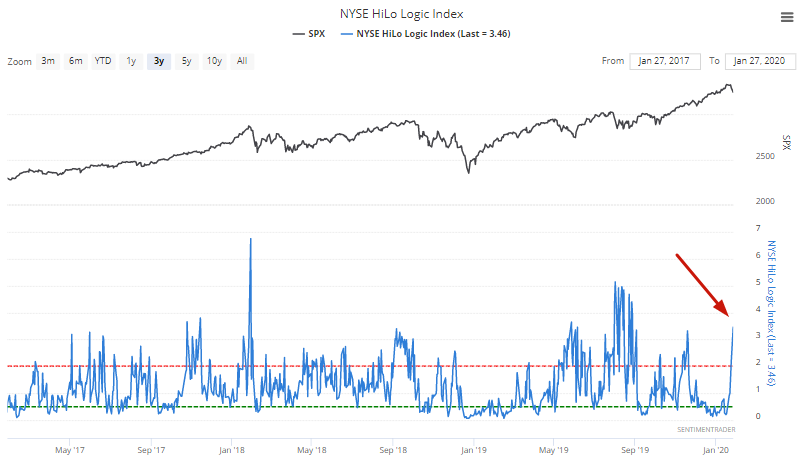
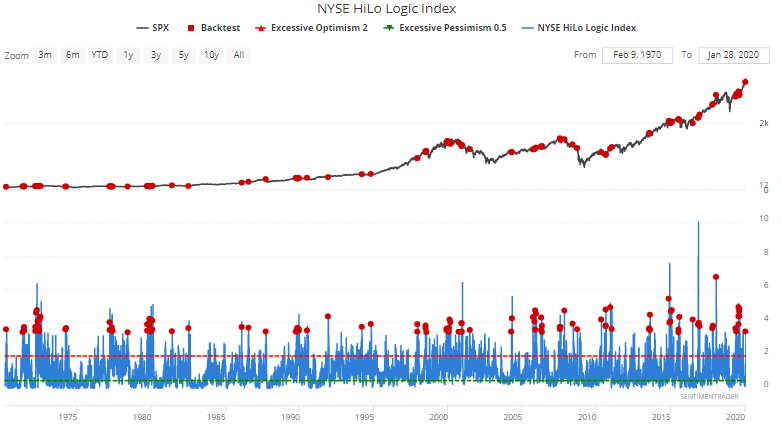
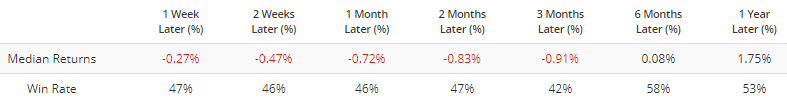
The HiLo Logic Index is now above 3.4, which historically led to worse-than-random returns over the next 3 months:
Sudden shock after an all-time high
The stock market's suddenly decline on Monday saw more than 30% of its members tank below their lower Bollinger Bands. This is extremely rare following an all-time high:
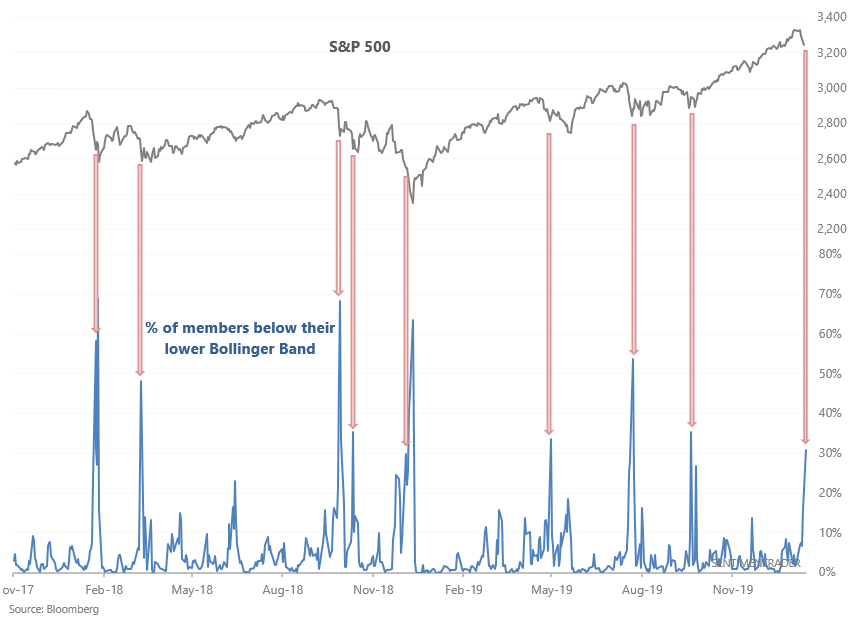
Here's what happened next to the S&P 500 after it was at a 1 year high recently, and then there was a sudden across-the-board selloff in U.S. equities.
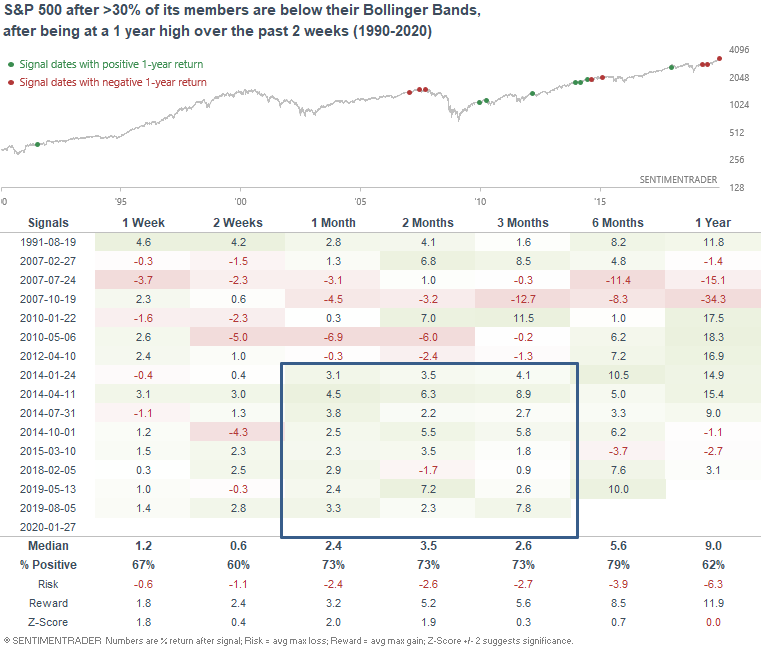
As you can see, the S&P's returns over the next 1-3 months were more bullish than random. This has been particularly true from 2014-present.
VIX
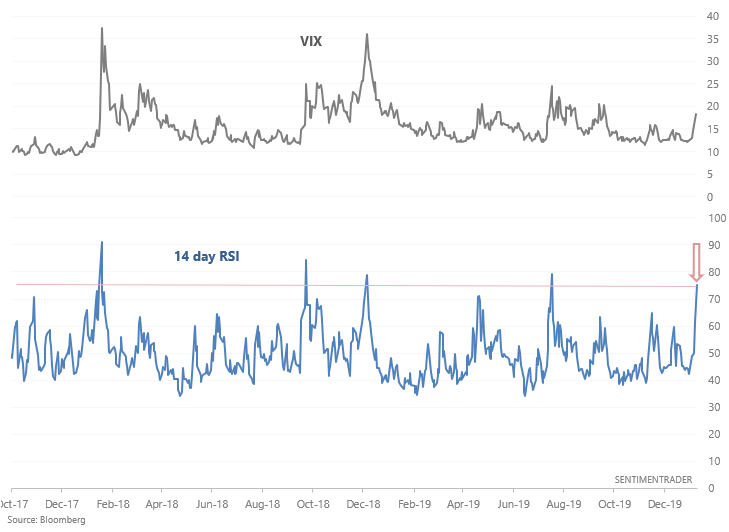
I've seen several traders on Twitter mention that "it's not too late to buy protection" after Monday's decline. Depending on how you buy protection, it may not be too late. HOWEVER, it's not a great idea to go long VIX at this point. VIX's 14 day RSI has jumped above 75:
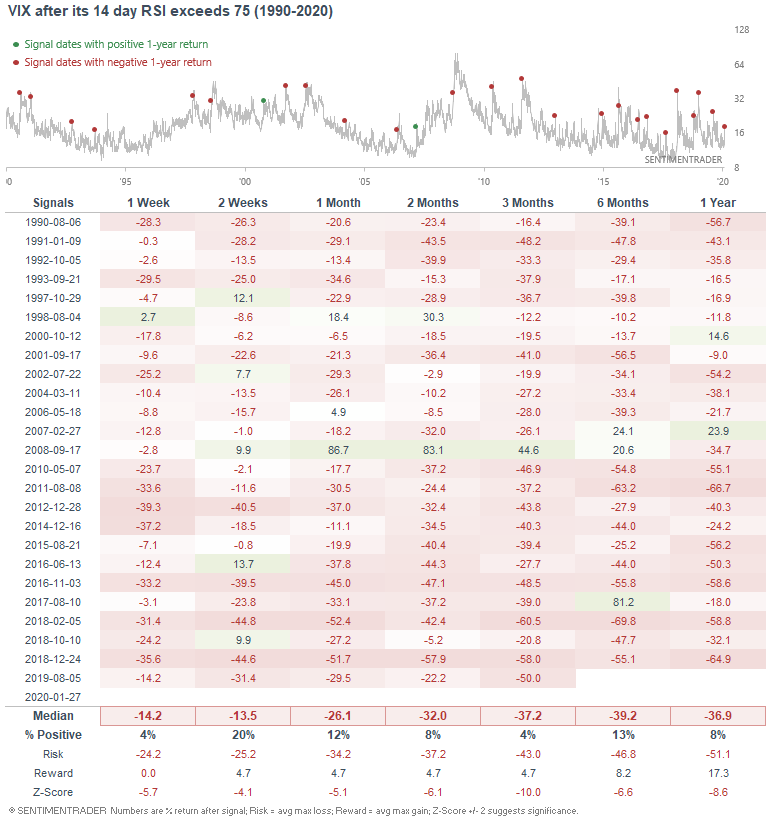
When VIX did so in the past, its forward returns leaned HEAVILY bearish.
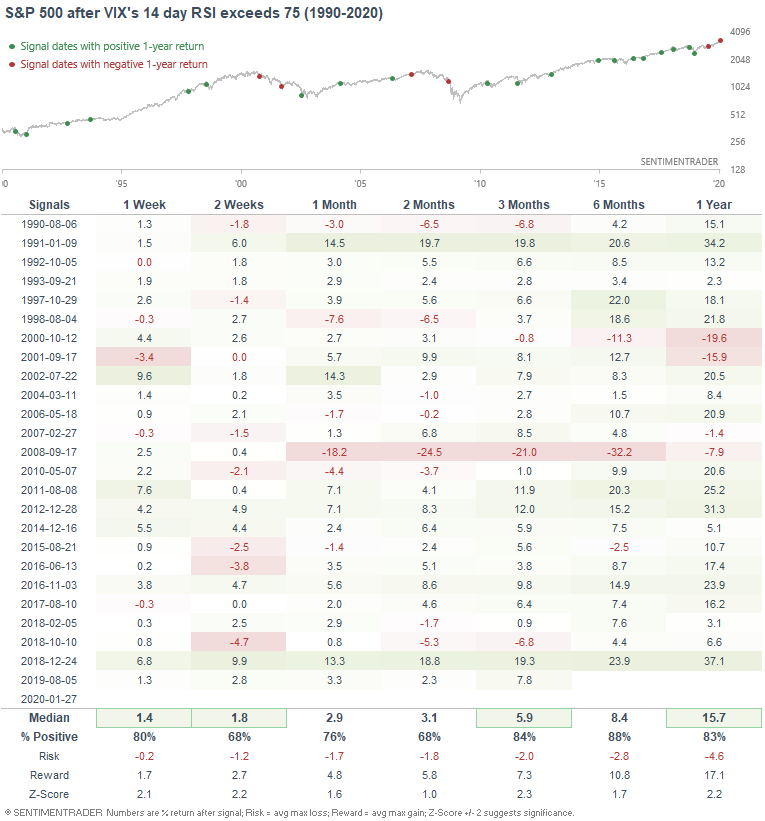
Meanwhile, the S&P's forward returns leaned bullish on all time frames:
Copper
As plenty of people on Twitter have noted, copper's crash over the past few days has been epic.
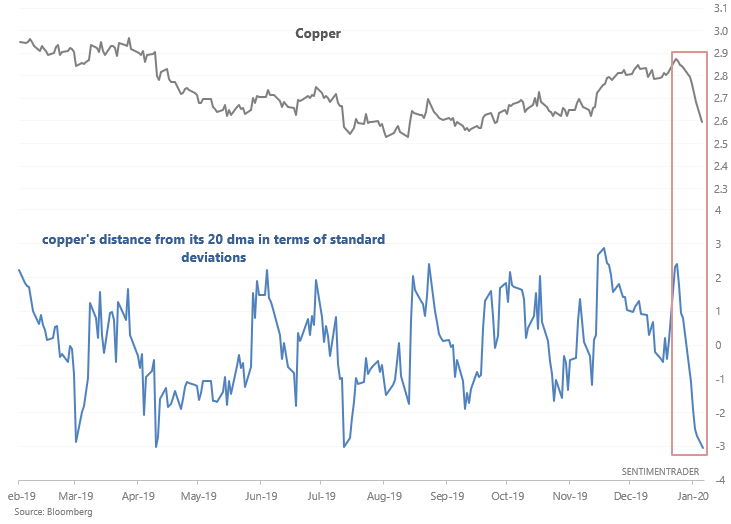
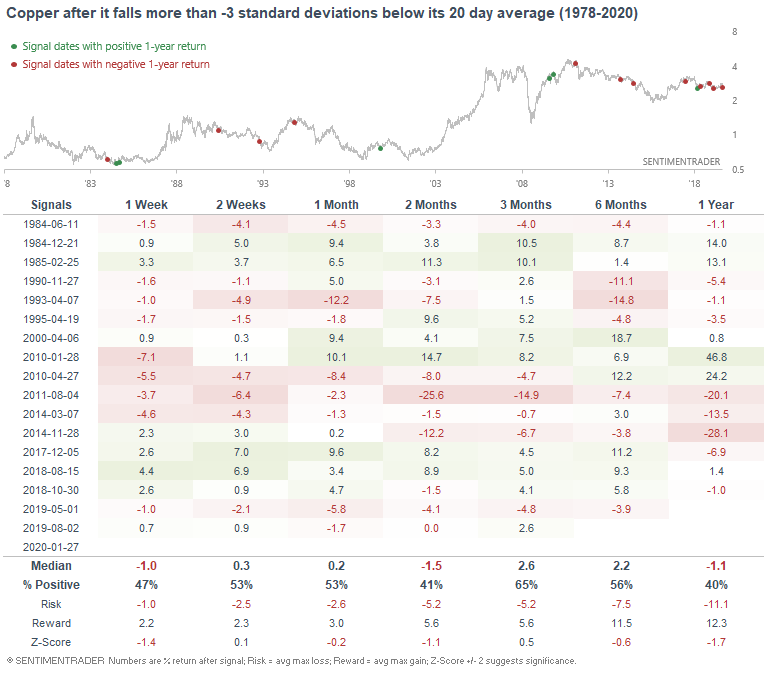
Copper has fallen 8 days in a row (an extreme), and is now more than -3 standard deviations below its 20 day moving average. When this happened in the past, copper didn't always rebound immediately as you may expect...
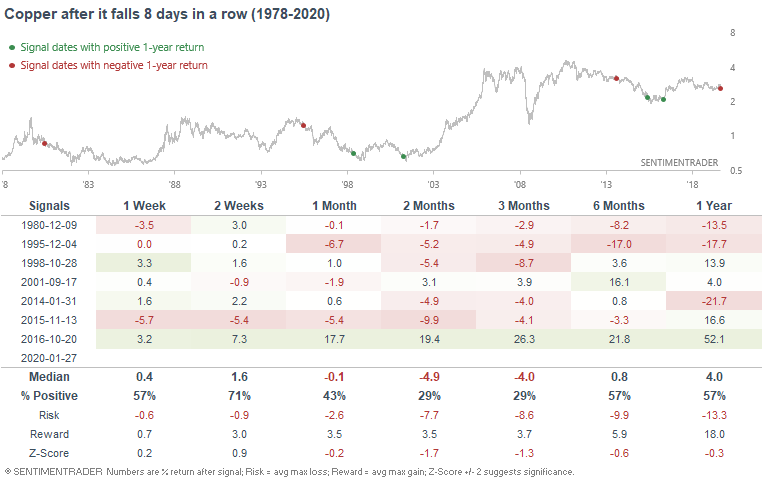
If we look at this from the perspective of "copper down 8 days in a row", copper's forward returns over the next 1-3 months weren't good either:
Gap downs
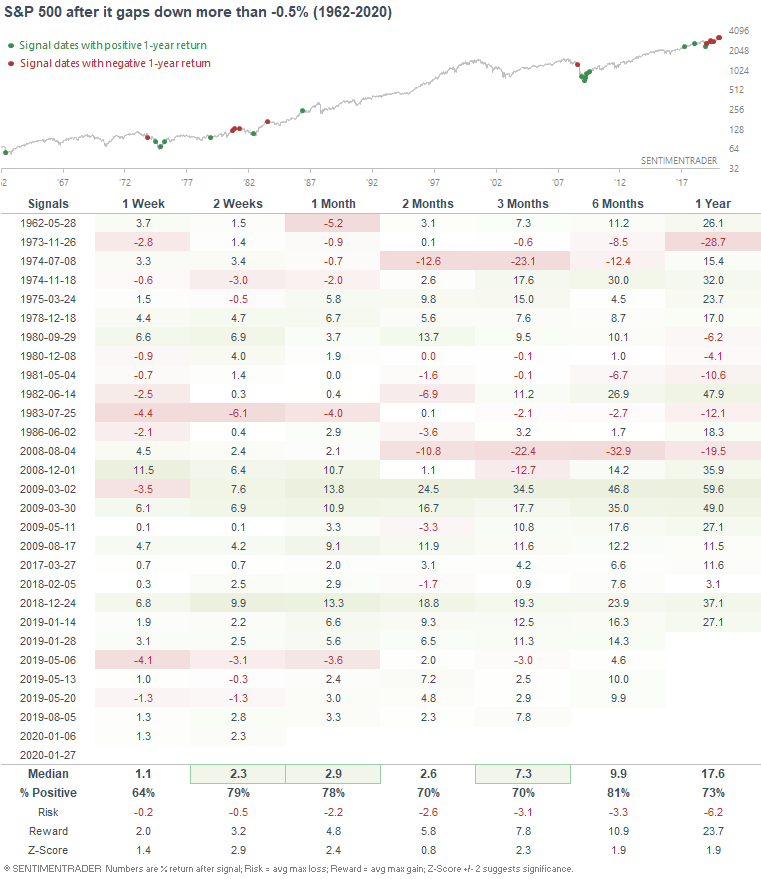
And lastly, the S&P gapped down more than -1.4% on Monday, which is one of the largest Monday gaps ever:
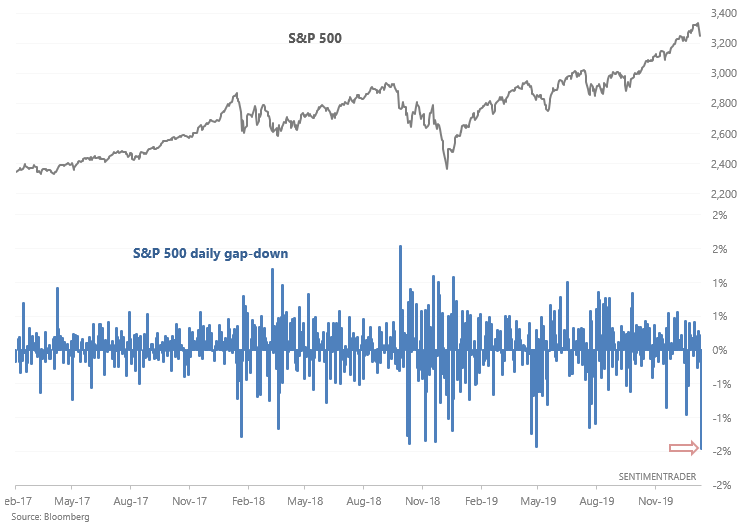
If we look at all the cases in which the S&P gapped down more than -0.5% on Monday, the S&P's returns over the next 2-4 weeks were mostly bullish. With that being said, most of the bullish cases have occurred during this bull market, and cases before this bull market were not quite as bullish. This highlights one of the key problems with price action analysis: whether a certain type of price action is bullish or bearish will change throughout the years. I wouldn't read too much into daily price action. One can always spin price action into a narrative that fits his/her preconceived bias.
My trading portfolio
My trading portfolio is allocated 50% in the Macro Index Model and 50% in the Simple Trading Model With Fundamentals. At the moment I have instituted a discretionary override and gone 100% long bonds (instead of long stocks) due to the extreme nature of many of our core indicators, even though some of these core indicators aren't in the models.
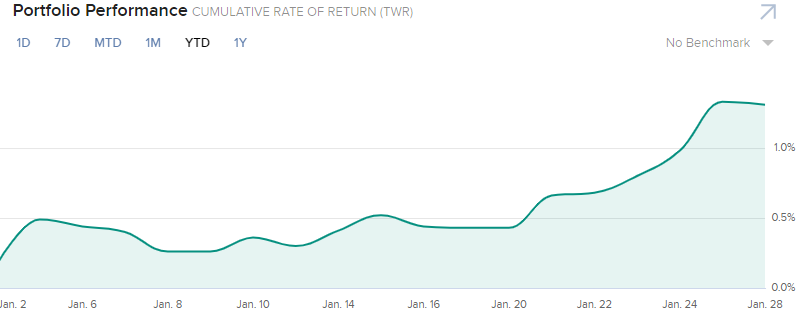
Performance YTD 2020:
- My trading account is up 1.31%
- Currently 100% in bonds