Data &
Technology
Research
Reports
Report Solutions
Reports Library
Actionable
Strategies
Free
Resources
Simple Backtest Calculator
Simple Seasonality Calculator
The Kelly Criterion Calculator
Sentiment Geo Map
Public Research Reports
Free Webinar
Pricing
Company
About
Meet Our Team
In the News
Testimonials
Client Success Stories
Contact
Log inLoginSign up
< BACK TO ALL REPORTS

What I'm looking at - S&P 500 Value Index, lots of chop, Taiwan, Germany Optix, UK Optix

Troy Bombardia
2019-10-24
null

Here's what I'm looking at:
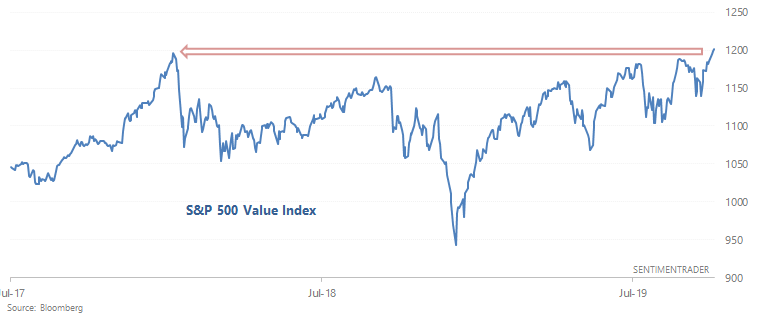

S&P 500 Value Index

As Bloomberg noted, the S&P 500 Value Index has broken out to a new all-time high:

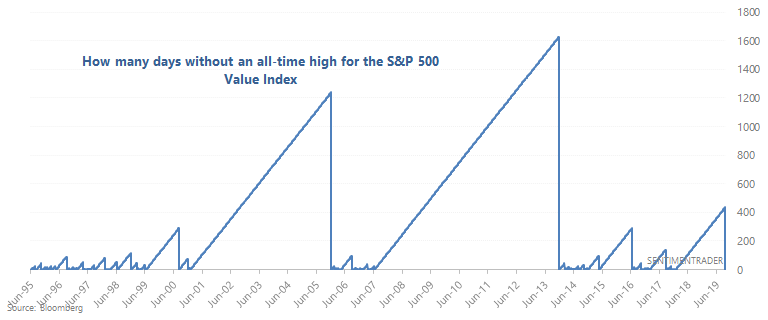
This is the first new all-time high in 436 trading days:

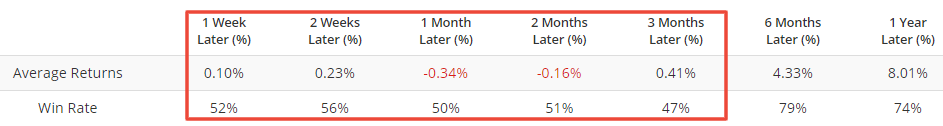
When the Value Index rallied to a new all-time high for the first time in 200+ days, it typically faced weakness over the next 1-2 months, even if it rallied further over the next 6 months:

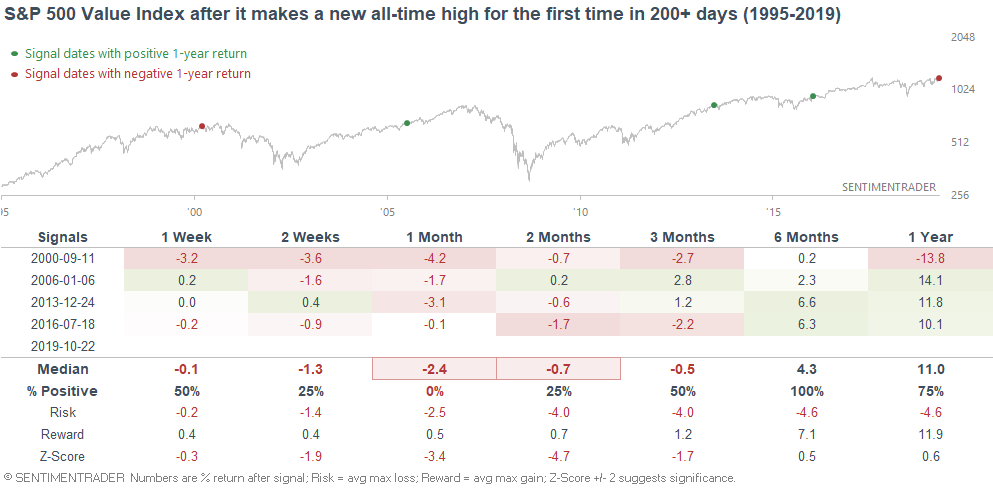
*Keep in mind that the sample size is small.


Choppy

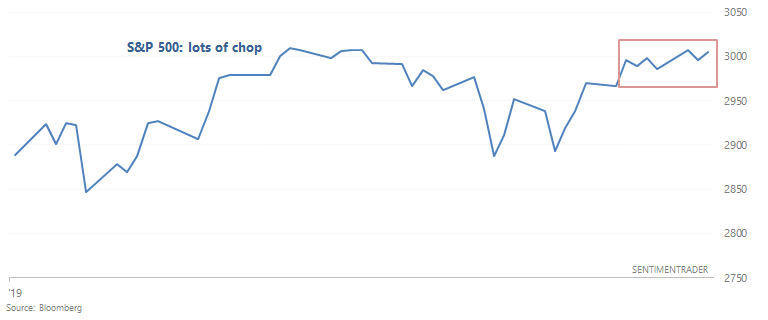
As Rob Hanna mentioned, the S&P has chopped up and down over the past 8 days, with each day going in a different direction from the previous day:

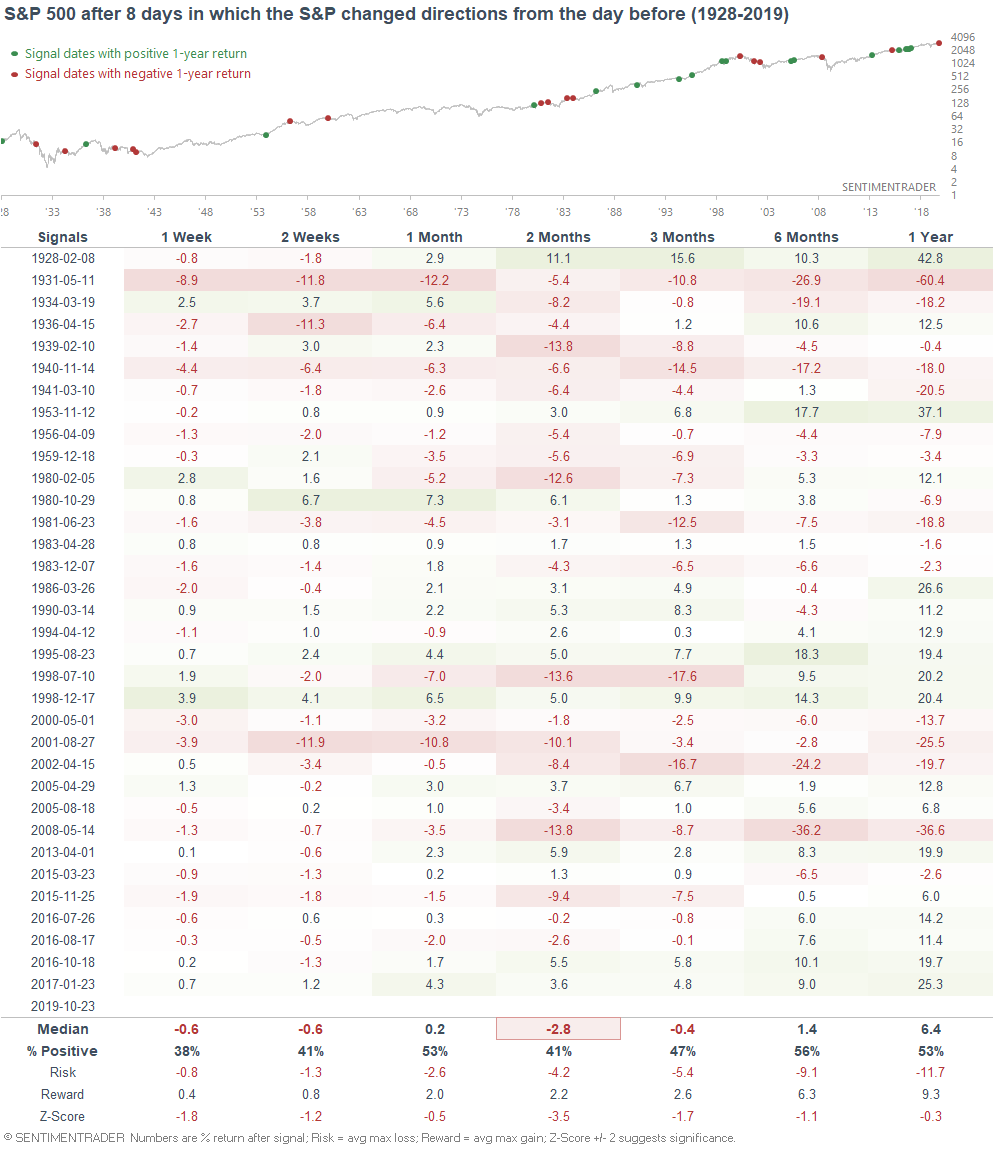
When the S&P chopped up and down for 8 days, its returns over the next 2 months were weak. Moreover, forward returns over the next year were consistently worse than random. This is because many of the bearish cases occurred during bear markets, which are notoriously choppy:

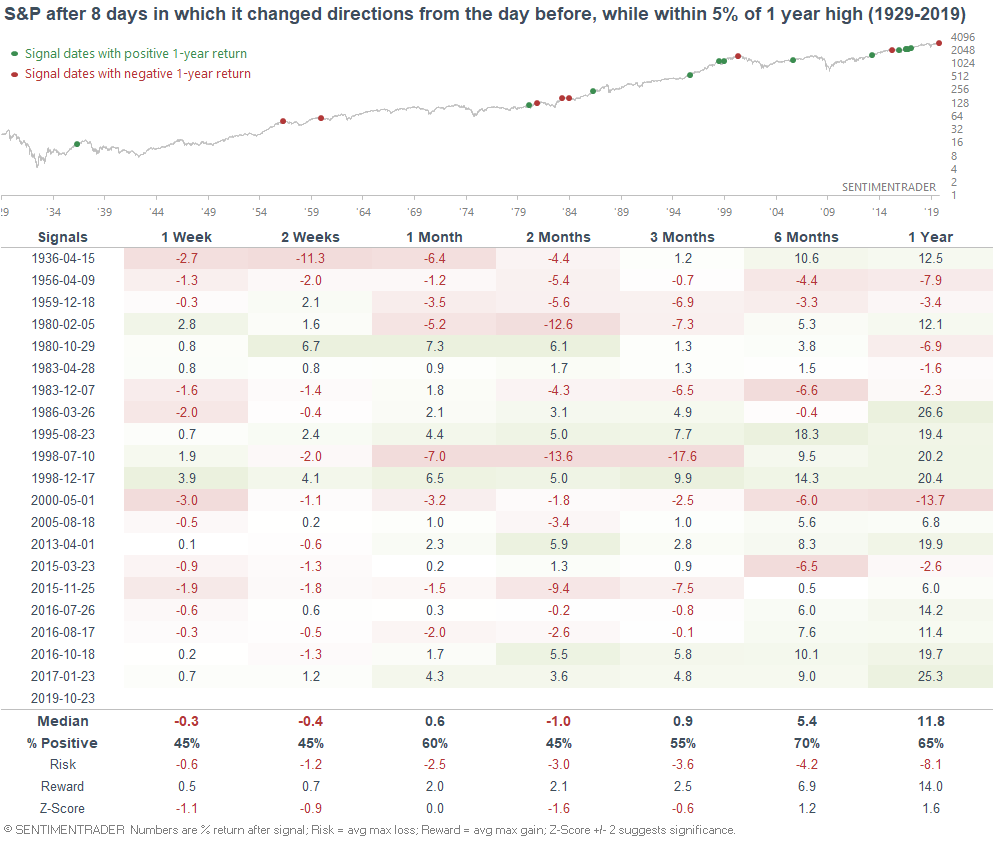
If we isolate for cases that occurred while the S&P was within -5% of a 1 year high, the S&P's returns become less bearish (particularly after 6 months), but there is still a slight bearish lean over the next 2 months:


Taiwan

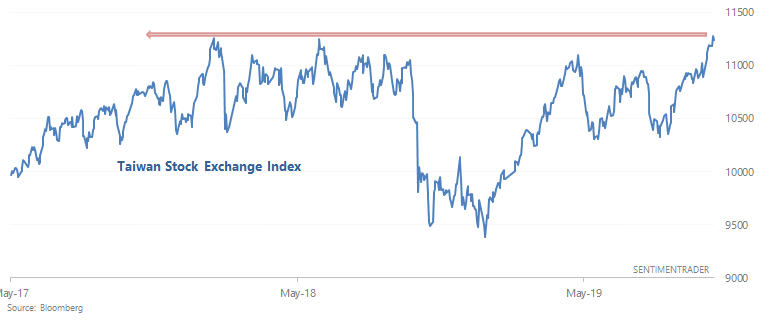
While the U.S. stock market continues to bounce around near all-time highs, other overseas markets (e.g. Germany and Japan) are breaking out. Add Taiwan to that list, which made a 2 year high:

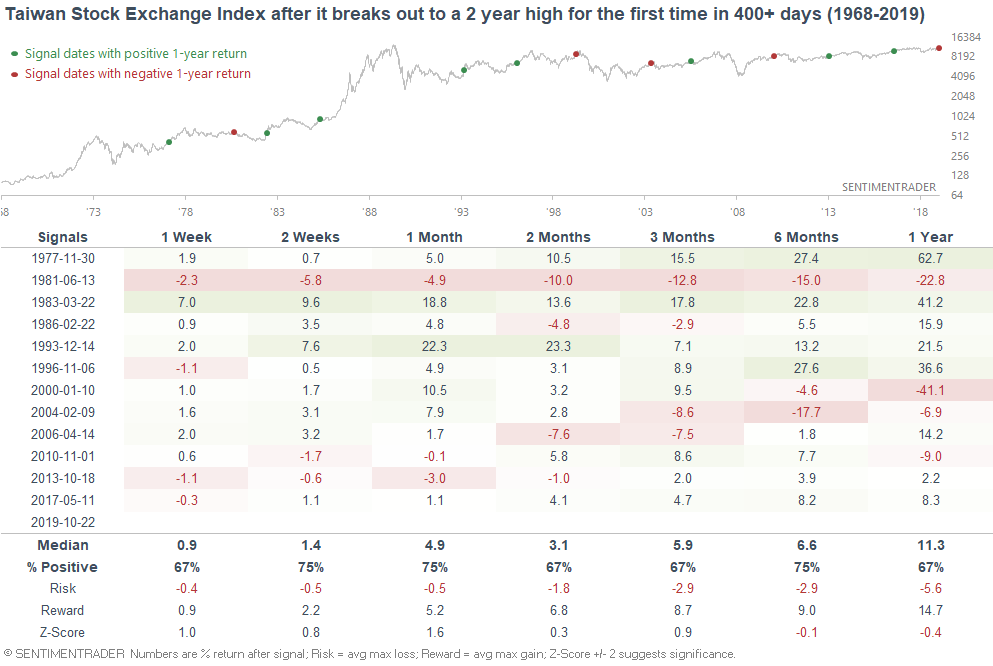
When the Taiwan Index broke out to a new 2 year high for the first time in 400+ days, it typically rallied over the next 2-4 weeks:


Germany Optix

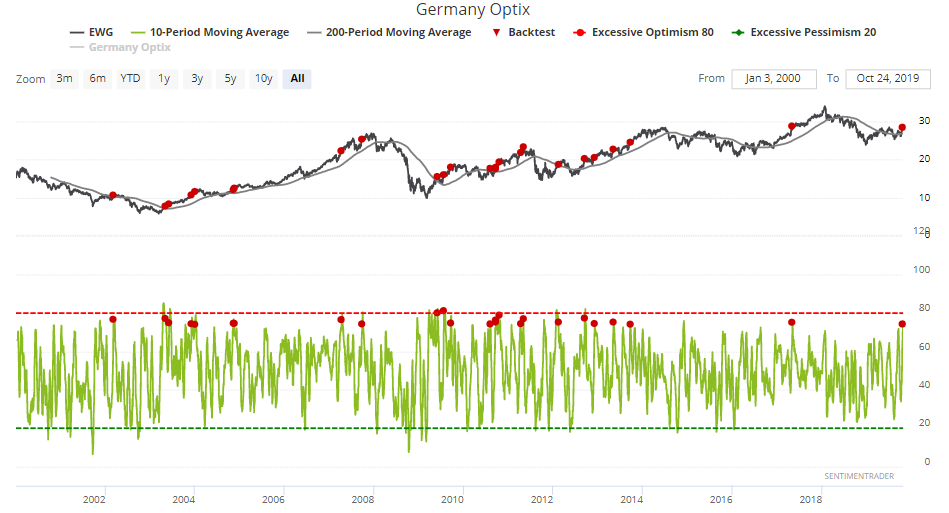
As German stocks continue to rally, Germany Optix's 10 day average has reached the highest level since 2017:

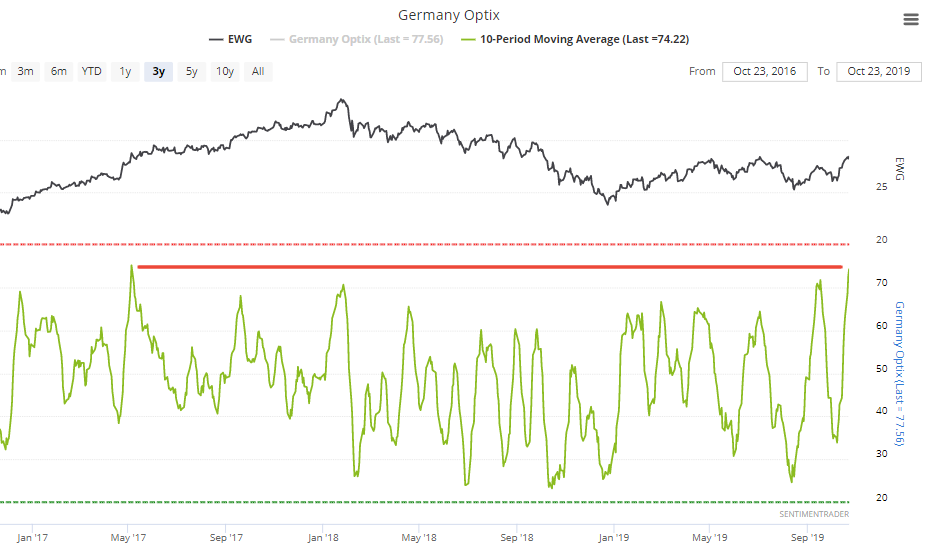
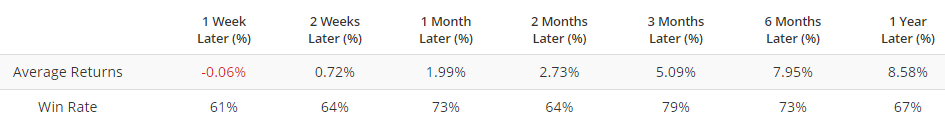
When Germany Optix's 10 dma exceeded 74 in the past, EWG (Germany ETF) rallied 79% of the time over the next 3 months:

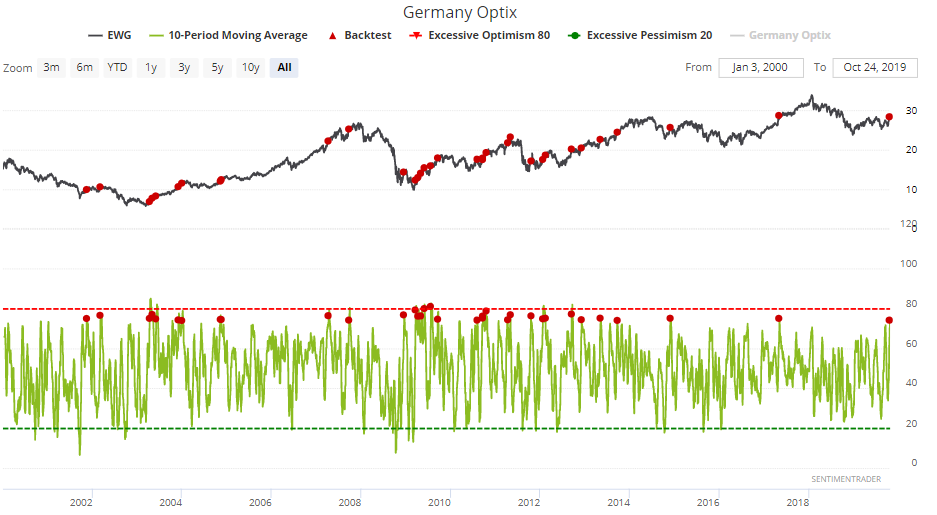
If we isolate for cases that occurred while EWG was above its 200 dma, the same bullish lean applies over the next 3 months. However, forward returns drop off after that:

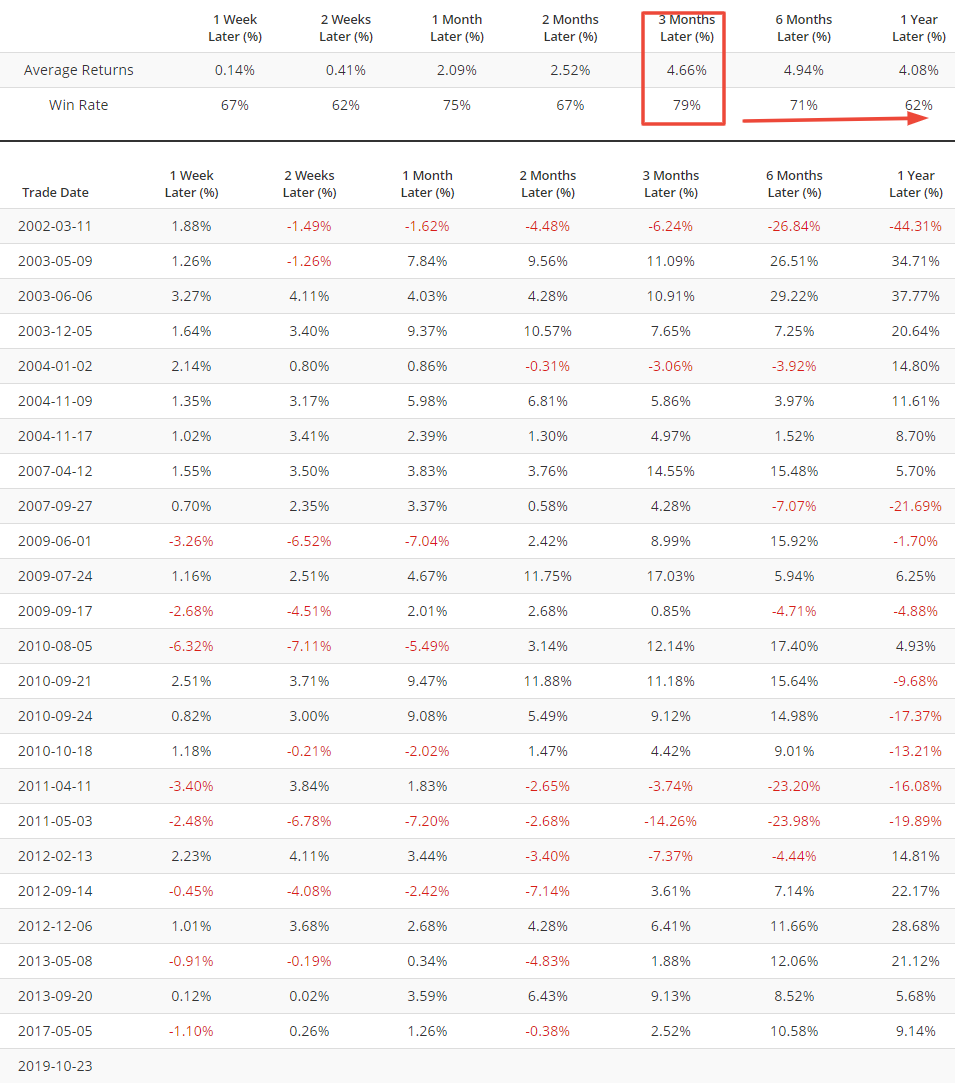
Finally, if we remove overlapping cases over the past 50 days, EWG's forward returns over the next 3 months become even more bullish (but also drop off after that):
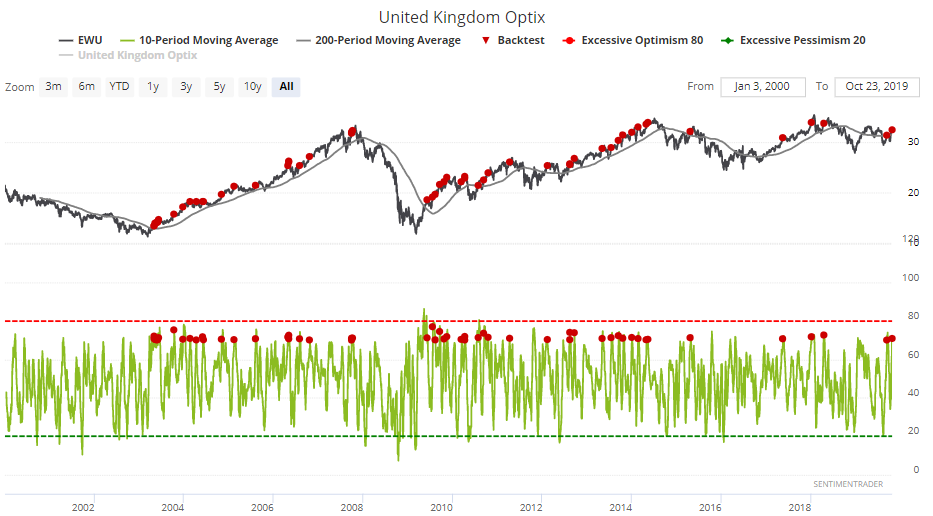

UK Optix

Similar to Germany Optix, UK Optix's 10 dma is also quite high as UK equities rally:

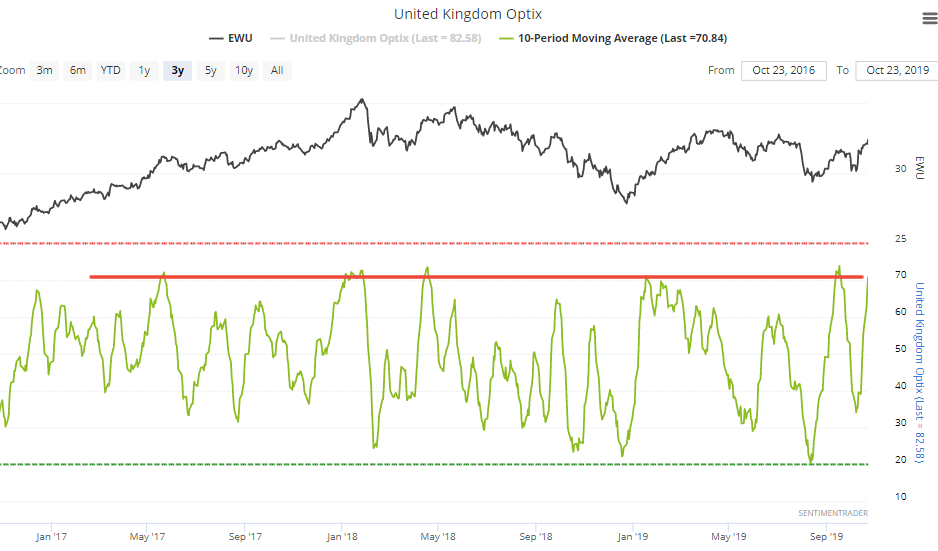
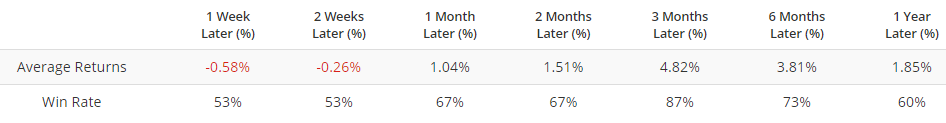
When Optix's 10 dma exceeded 70 in the past while EWU (UK ETF) was above its 200 dma, EWU's returns over the next 3 months were worse than random:

Sorry, you don't have access to this report

Upgrade your subscription plan to get access
Go to Dasboard
DATA &
TECHnologies
IndicatorEdge
‍
BackTestEdge
‍
Other Tools
‍
DataEdge API
RESEARCH
reports
Research Solution
‍
Reports Library
‍
actionable
Strategies
Trading Strategies
‍
Smart Stock Scanner
‍
FREE
RESOUrCES
Simple Backtest
Calculator
Simple Seasonality
Calculator
The Kelly Criterion
Calculator
Sentiment Geo Map
‍
Public Research Reports
‍
Free Webinar
COMPANY
‍
About
‍
Meet our Team
‍
In the News
‍
Testimonials
‍
Client Success Stories
Pricing
Bundle pricing
‍
Announcements
‍
FAQ
© 2024 Sundial Capital Research Inc. All rights reserved.
Setsail Marketing
TermsPrivacyAffiliate Program
Risk Disclosure: Futures and forex trading contains substantial risk and is not for every investor. An investor could potentially lose all or more than the initial investment. Risk capital is money that can be lost without jeopardizing ones’ financial security or life style. Only risk capital should be used for trading and only those with sufficient risk capital should consider trading. Past performance is not necessarily indicative of future results.

Hypothetical Performance Disclosure: Hypothetical performance results have many inherent limitations, some of which are described below. No representation is being made that any account will or is likely to achieve profits or losses similar to those shown; in fact, there are frequently sharp differences between hypothetical performance results and the actual results subsequently achieved by any particular trading program. One of the limitations of hypothetical performance results is that they are generally prepared with the benefit of hindsight. In addition, hypothetical trading does not involve financial risk, and no hypothetical trading record can completely account for the impact of financial risk of actual trading. for example, the ability to withstand losses or to adhere to a particular trading program in spite of trading losses are material points which can also adversely affect actual trading results. There are numerous other factors related to the markets in general or to the implementation of any specific trading program which cannot be fully accounted for in the preparation of hypothetical performance results and all which can adversely affect trading results.

Testimonial Disclosure: Testimonials appearing on this website may not be representative of other clients or customers and is not a guarantee of future performance or success.