
What I'm looking at - South Korean exports, HiLo, gold's top?, no daily movements, India's surge
With stocks stuck in a narrow range, here's what I'm looking at:
South Korean exports
When bears look for global macro weakness, they typically look for variations of the following types of indicators:
- Yield curve inversion
- Manufacturing contraction
- Global trade collapse
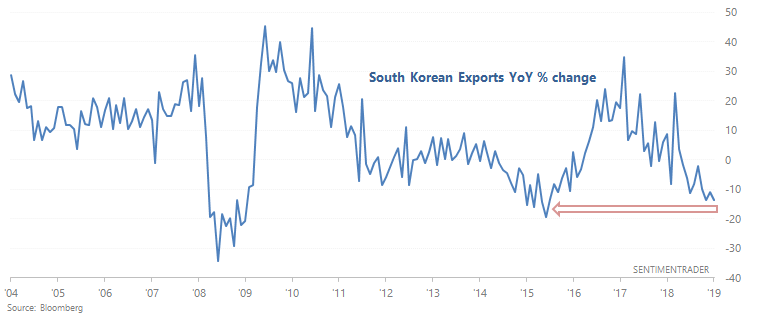
In terms of the "global trade collapse", bears frequently mention the COLLAPSE in South Korean exports. Here's the YoY % change:
*South Korean exports are often seen as a bellweather for global trade
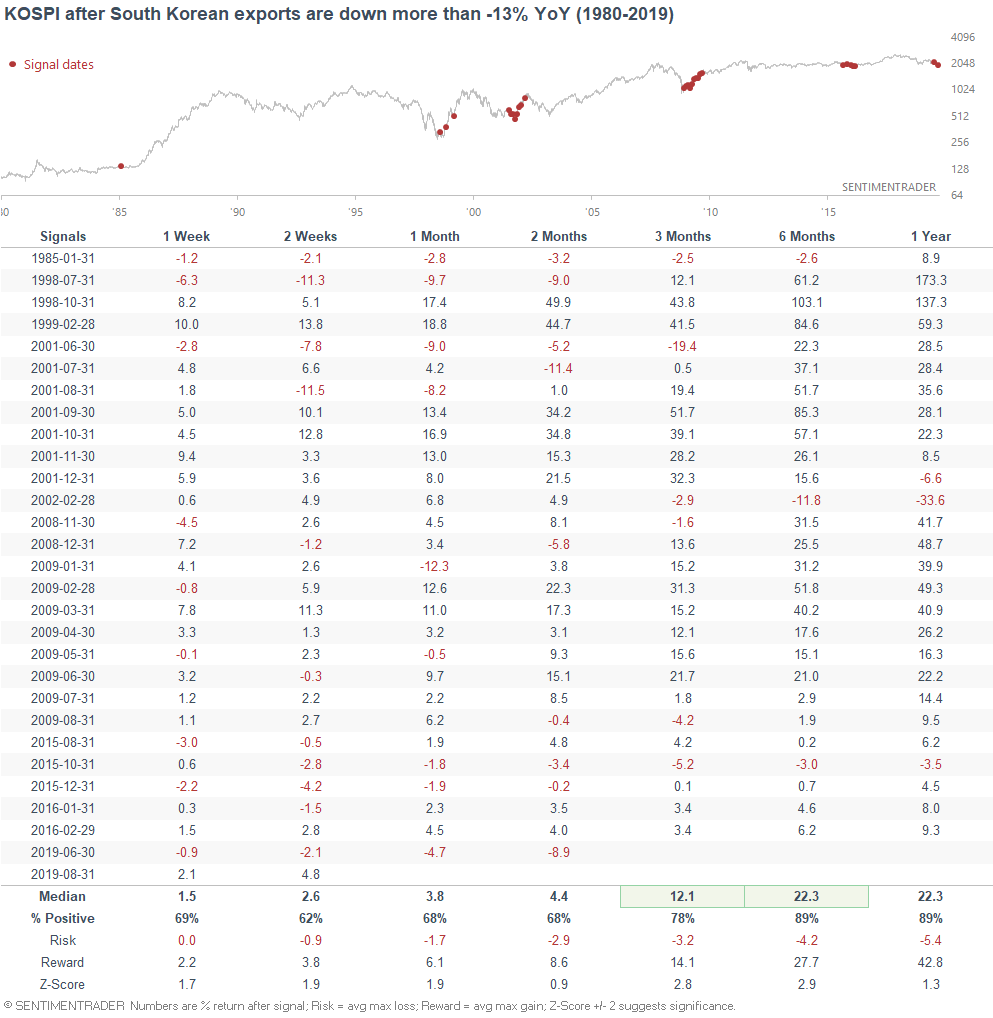
Except this isn't a consistently bearish factor for the stock market, at least in terms of market timing. The following charts look at what happens next to the S&P 500 & KOSPI when South Korean exports are down more than -13% YoY:
*Running this stat on the KOSPI is difficult, because its historical data begins in 1980.
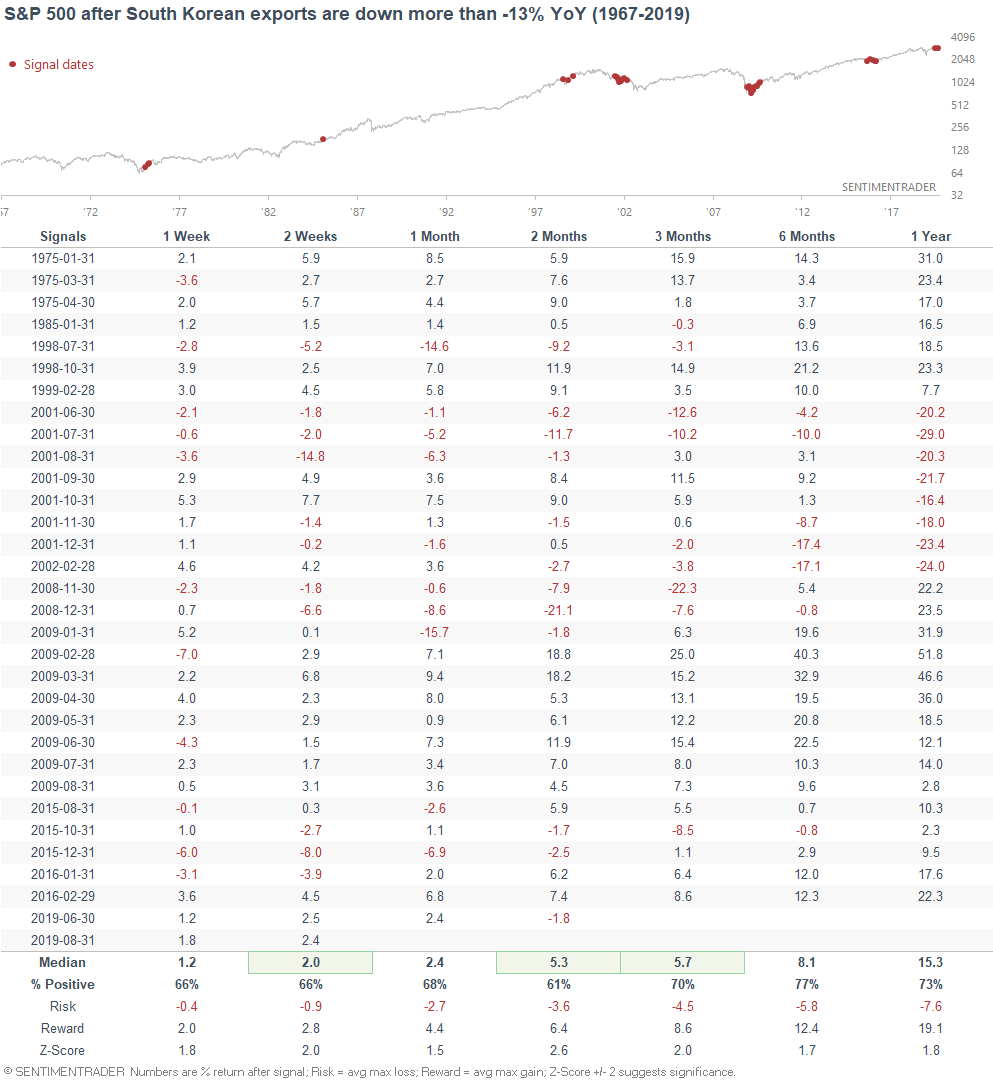
Sometimes this happened in the middle of a bear market (e.g. 2001) and sometimes it happened at the end of a bear market/recession (e.g. 2009).
We can look at this from another angle (albeit a low sample size angle). The following table looks at what happens next to the S&P after South Korean exports' YoY growth is negative for 9 consecutive months:
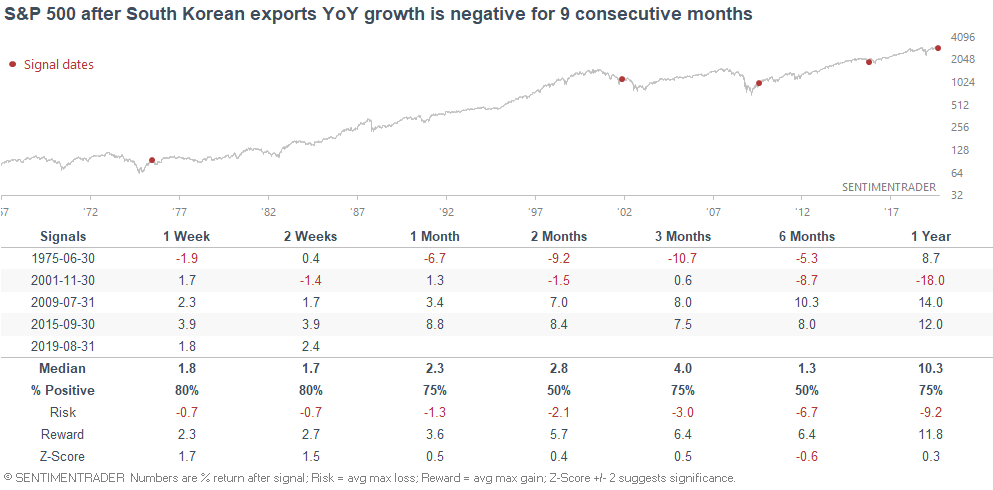
Once again, not a consistently bearish factor for stocks.
When focusing on the U.S. stock market, I don't find South Korean data to be that useful. We're in the business or marketing timing, not in the business of sounding smart.
*This is why macro news can be misleading. What gets reported is usually the data that's extreme (e.g. this is the BEST in X years, this is the WORST in Y years). What doesn't really get attention are the economic data sets that point towards boring, slow growth. Afterall, what generates more clicks and pageviews?
- Economy grew at a normal 2.5% last year
- MANUFACTURING IS AT ITS LOWEST SINCE 2008
Hype is good for attracting attention, but it doesn't really help investors.
HiLo Logic Index
One of the problems that Jason highlighted in August was the "split" nature of the stock market. The HiLo Logic Index was consistently high, suggesting that many securities were hitting a 52 week high and many others were hitting a 52 week low.
This ended when the stock market rallied earlier this month, with most stocks rallying along with the broad stock indices.
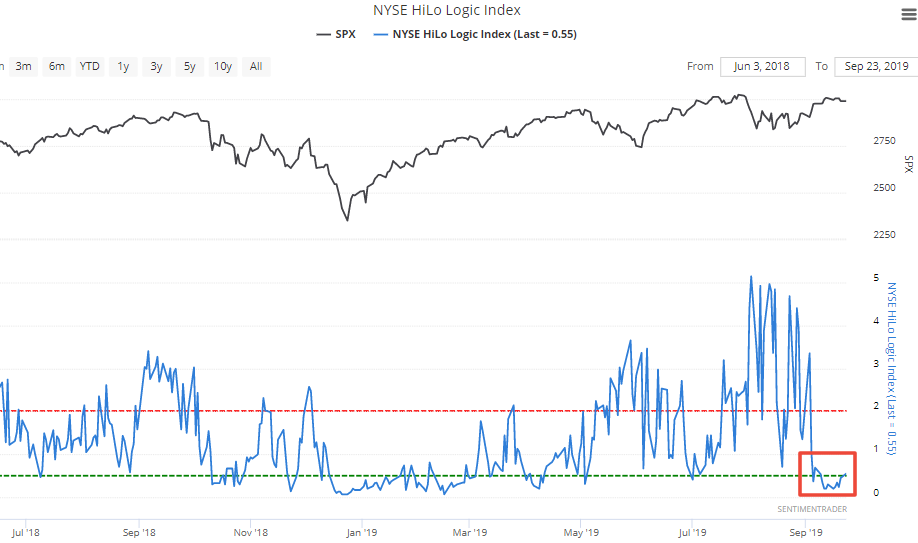
But as the stock market has languished over the past few days, the NYSE HiLo Logic Index is creeping up a little after a relatively long positive streak (9 days). This is caused by a slight uptick in the # of securities making new lows despite a fair amount of securities still making new highs.
The following table looks at what happened next to the S&P 500 when the HiLo Logic Index rises above 0.5 for the first time in at least 9 days.
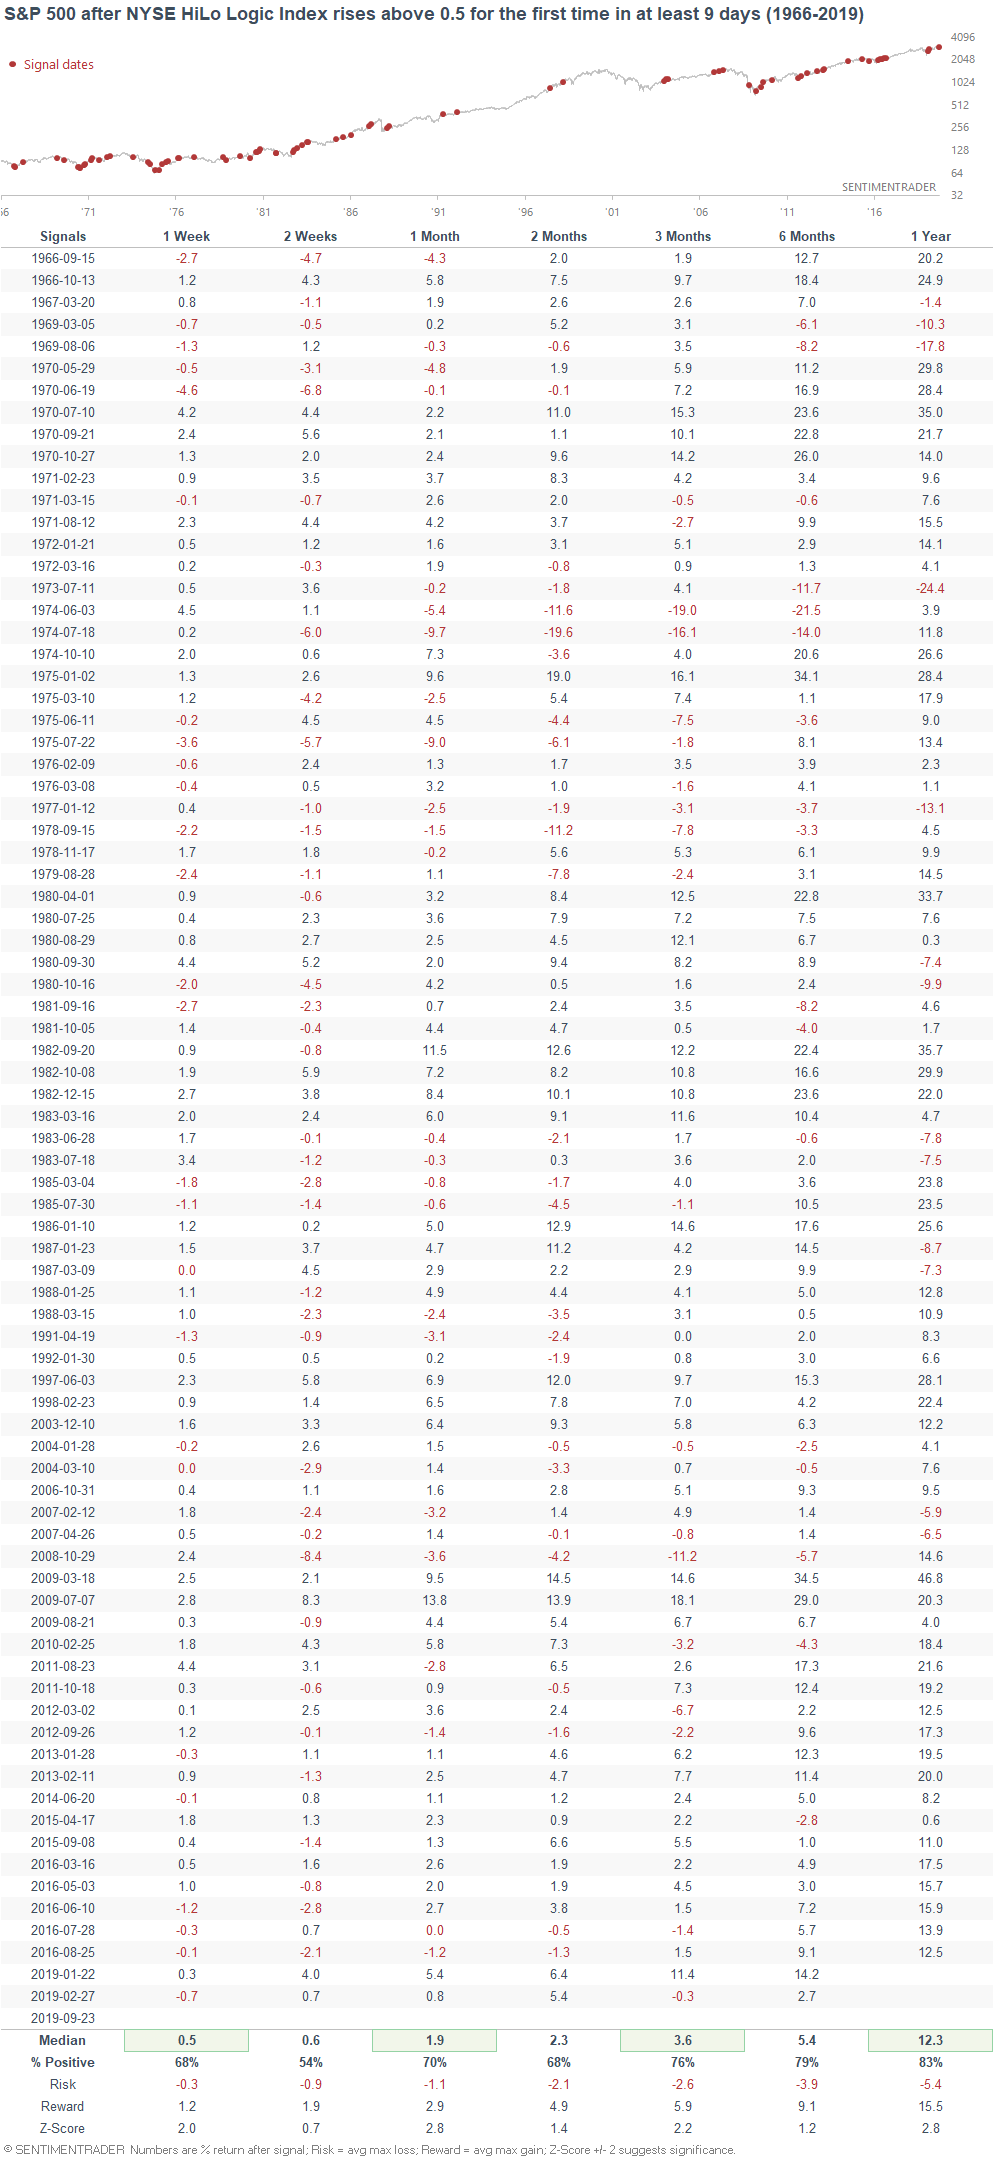
Overall, breadth is not a consistently bearish factor for the stock market, as I noted in my weekend market outlook.
Gold's top?
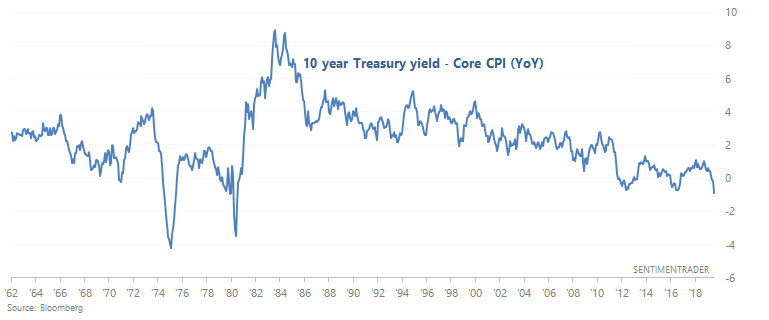
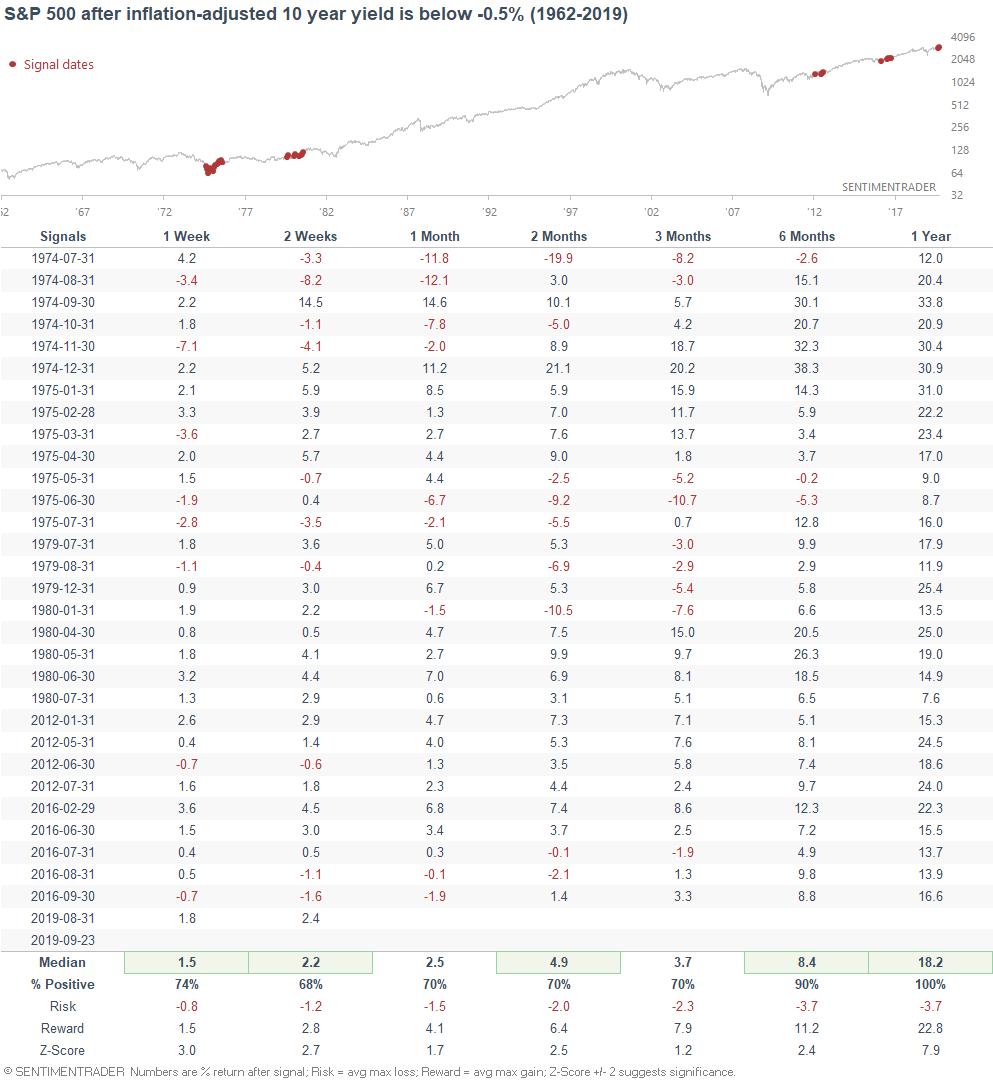
I recently came across a chart from a popular bear (who shall be unnamed so as to avoid conflict) who has been bullish on gold for quite a long time. The chart looks at the inflation-adjusted 10 year Treasury yield, stating that when yields are very low and core inflation is at a decade high, gold is king.
The following chart looks at the inflation-adjusted 10 year Treasury yield.
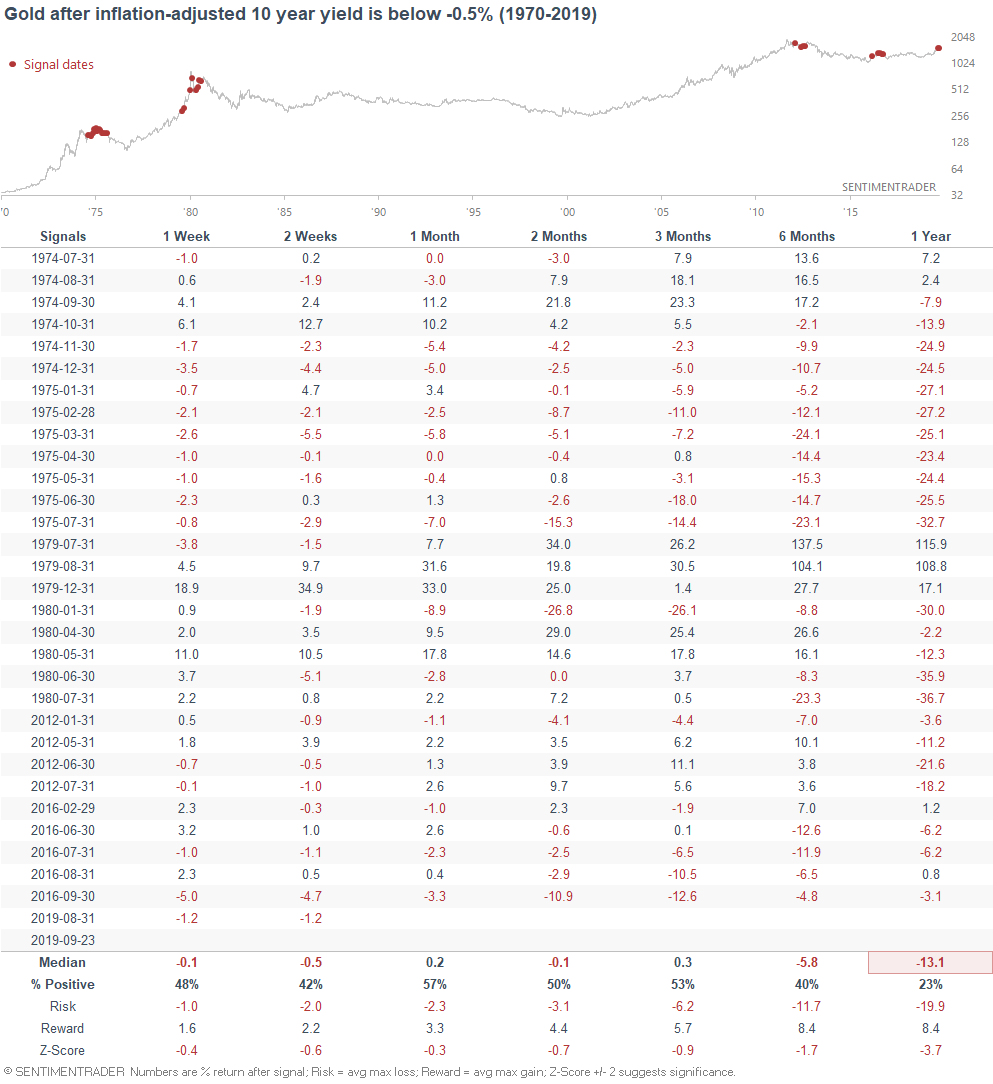
While there are valid reasons to be bullish on gold, this is not one of them. In fact, this is one of the reasons why we turned bearish on gold in 2012.
When the inflation-adjusted 10 year Treasury yield turned significantly negative in the past, it often marked multi-year tops in gold:
- 1974
- 1980
- 2012
- 2016
And for the record, this wasn't consistently bearish for stocks:
In general, I find that many traders underestimate how hard it is to trade gold. Anyone can make a convincing and smart-sounding argument for why gold will do XYZ, but just look at how the vast majority of gold predictions turned out over the past 10 years.
While I wouldn't use this stat to short gold, it certainly is not a bullish factor for gold.
Extremely low volatility
The past 2 weeks have seen the stock market go nowhere, with the S&P's 9 day range falling below 0.6% (max/min)
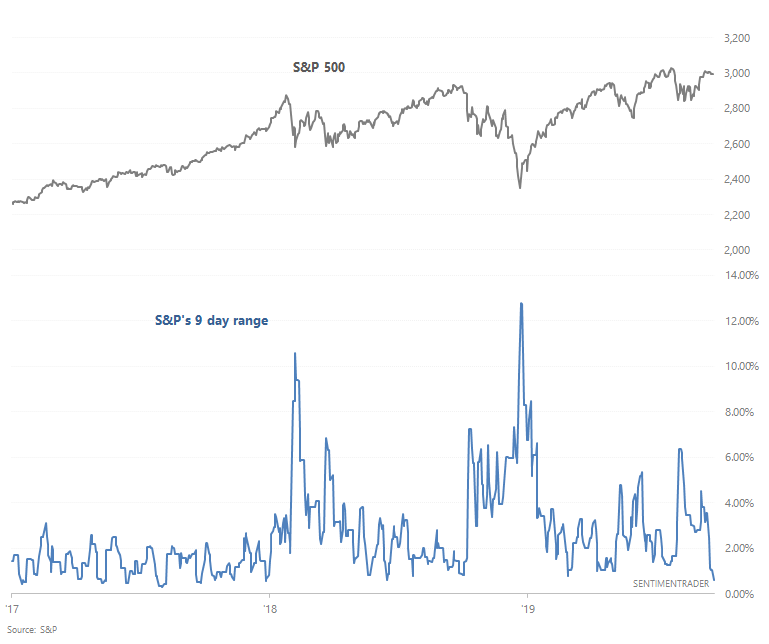
Opposite to the usual camp of permabears who are always anticipating the next crash, there seems to be an emerging camp of traders who believe that the stock market is about to soar after a 1.5+ year consolidation. And with stocks making minimal daily movements, some traders may remember 2017 when the market grinded higher slowly but incessantly.
The following table illustrates what happens next to the S&P after its 9 day range falls below 0.6%, while the S&P is extremely close to an all-time high.
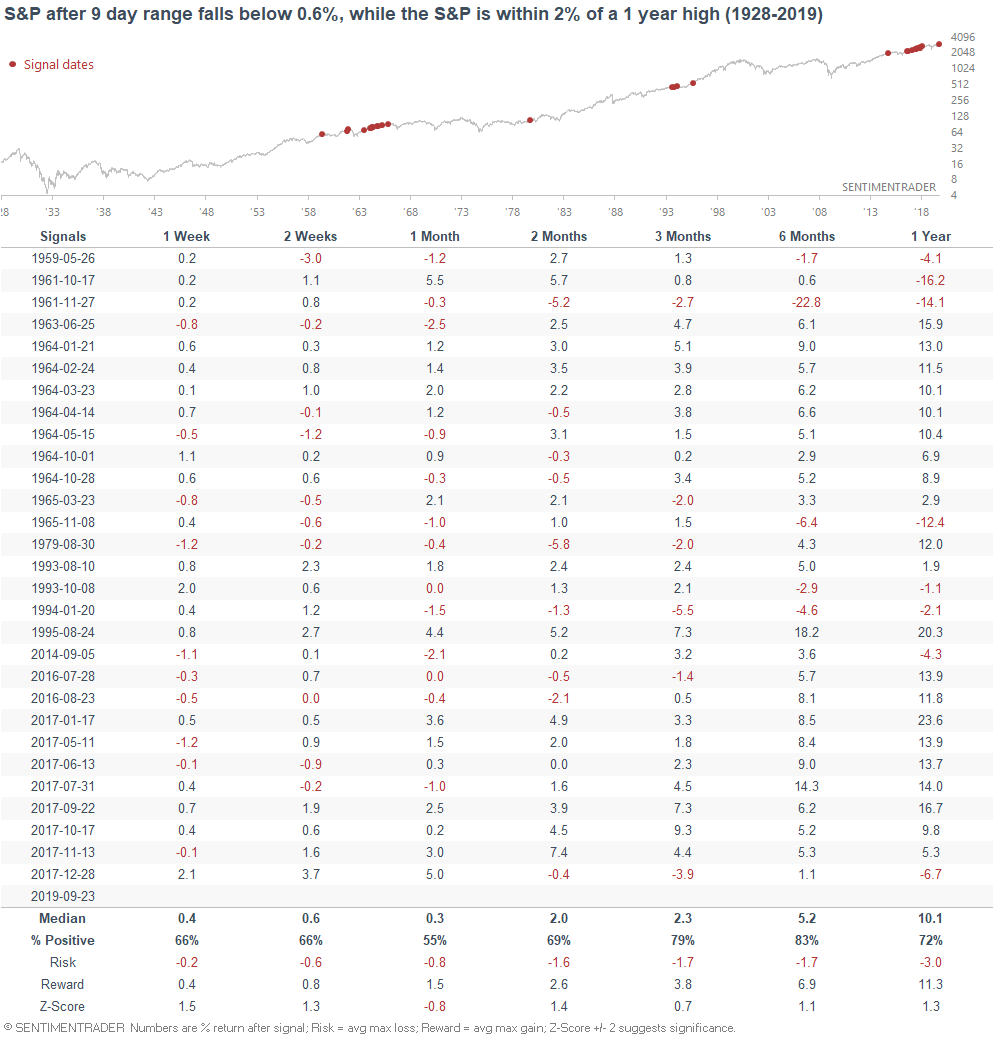
The last few times this happened were in 2017, when the stock market grinded higher incessantly. But before that, it wasn't a consistently short term bullish factor for the stock market.
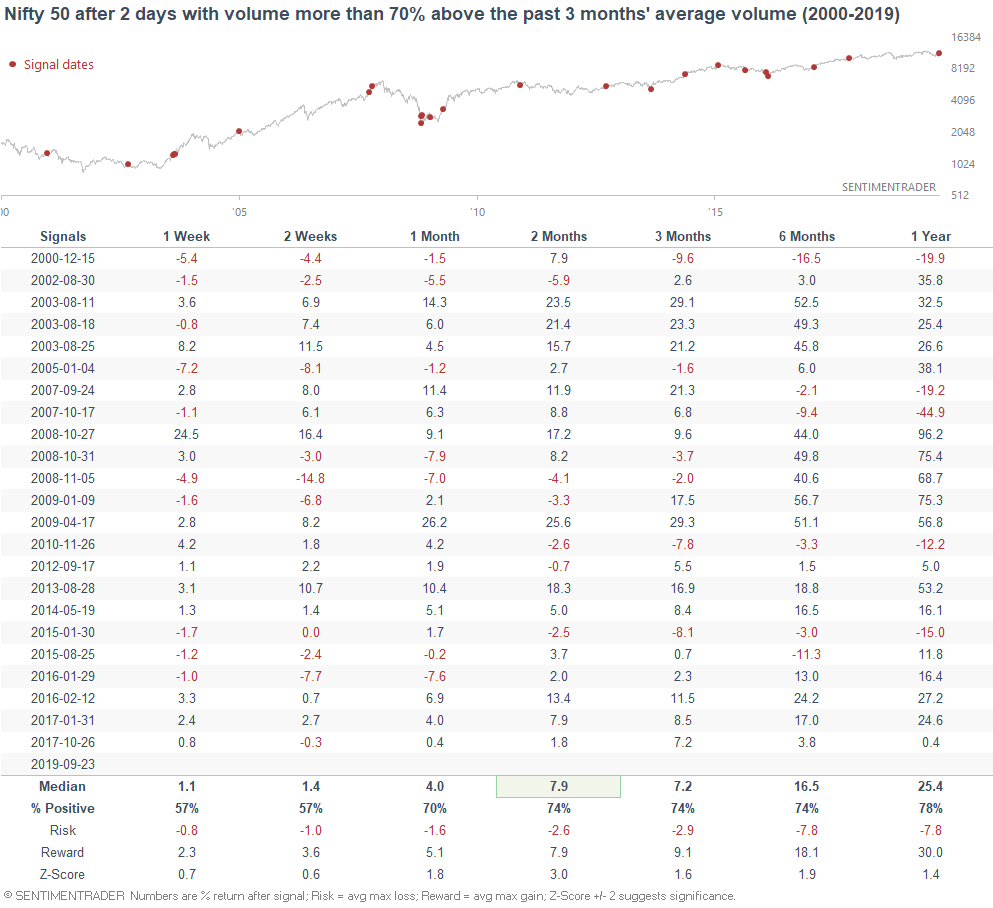
Indian stocks
And lastly, the Indian stock market has surged over the past few days on news that the government would slash corporate taxes. As a result, volume has surged as well. (h/t David Ingles)
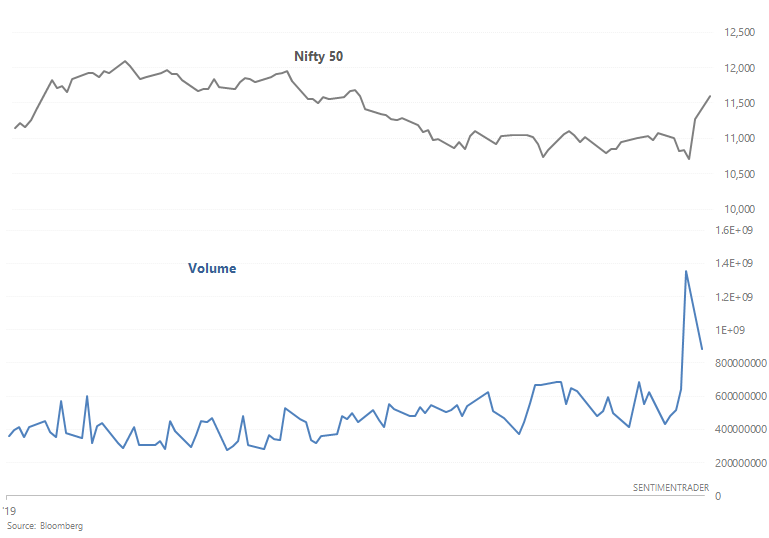
Volume surges in the past were slightly bullish for the Indian stock market over the past 2 months.
Some of these volume surges occurred while stocks were crashing. (More often than not, stock market rallies are accompanied by falling volume and stock market crashes are accompanied by rising volume). So if we only select the cases that occurred when the Nifty 50 went up:
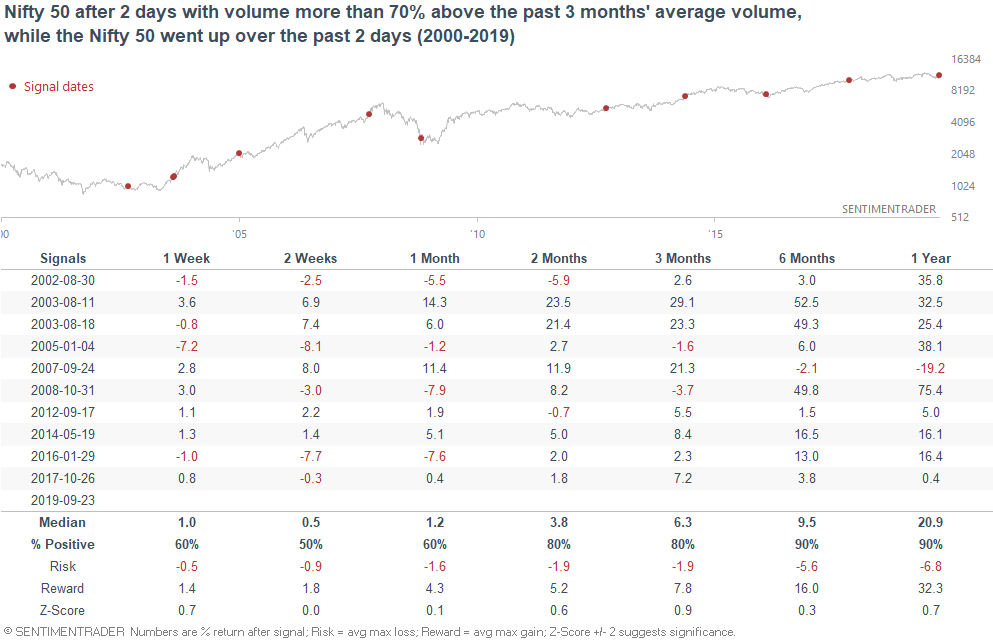
Similar results.
Got any questions or comments? Email me at [email protected]