
What I'm looking at - Smart Money, USD breakdown, ZEW, microcaps, growth & tech index
Here's what I'm looking at:
Smart Money Confidence
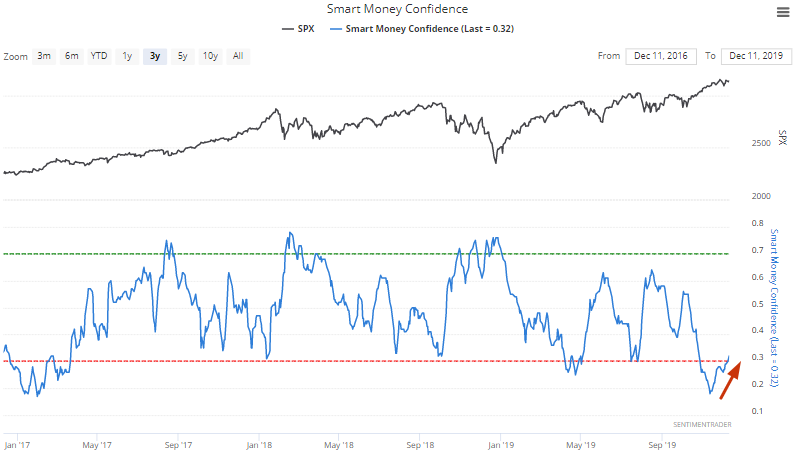
The stock market surged in November, pushing Smart Money Confidence to one of the lowest levels in years. Now that stocks are swinging sideways, Smart Money Confidence is starting to rise a bit. Is this the all-clear sign for stocks?
The following table looks at what happened next to the S&P when Smart Money Confidence rose above 0.3, after being low for a prolonged period of time (i.e. a prolonged an incessant rally):
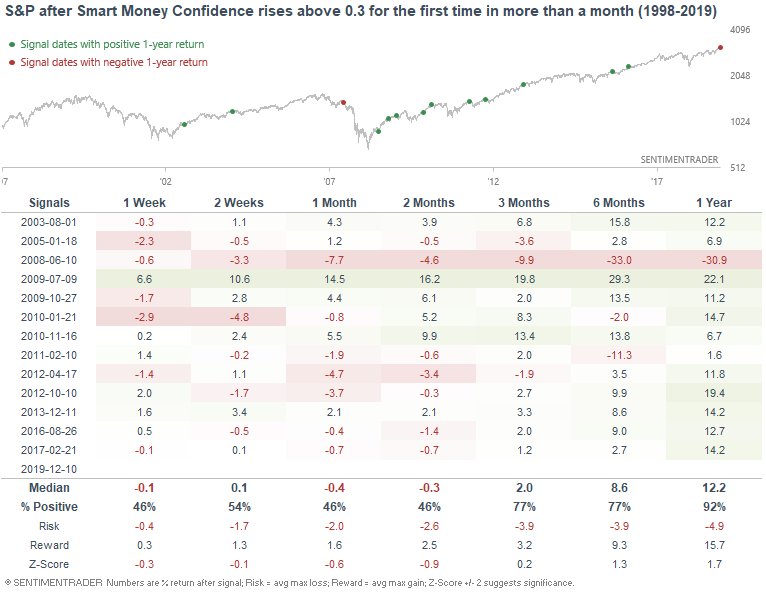
As you can see, the S&P's returns over the next 1-2 months were still weak, although 1 year forward returns were mostly bullish.
USD breakdown
As Zerohedge noted, the U.S. Dollar Index has broken down to the lowest level since July:
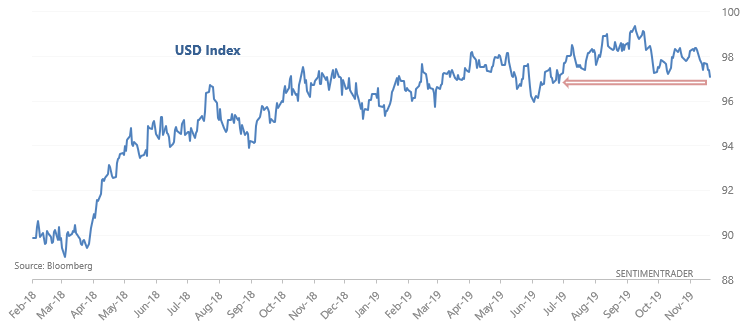
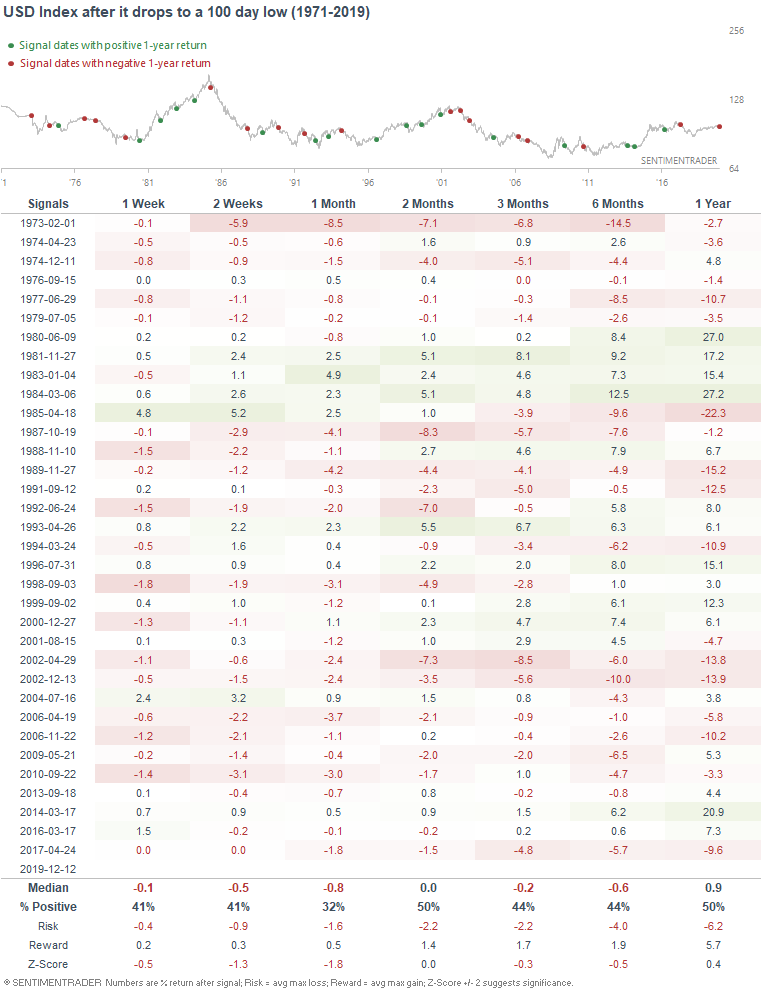
Such breakdowns typically led to more weakness for the dollar over the next month:
Eurozone Expectation of Economic Growth
As the WSJ noted, the ZEW Eurozone Expectation of Economic Growth is picking up again after sinking deep into negative territory:
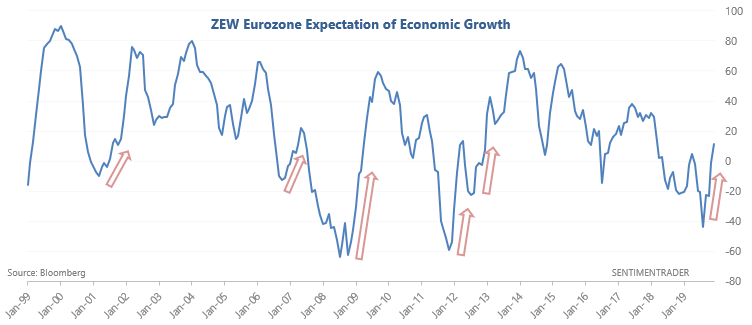
Depending on how you look at it, this could be a bullish sign or not-so-bullish sign (i.e. no strong conclusion). The only 2 cases in which this indicator turned up after being deeply negative occurred after major downturns in the Eurozone economy (2009 and 2012). Those came after major long term bottoms in the market.
But if you don't look at such extreme cases, this isn't as decisively bullish for European stocks. The following table looks at what happened next to the Euro Stoxx 50 after Eurozone Expectation of Economic Growth rose above 10 for the first time in more than half a year:
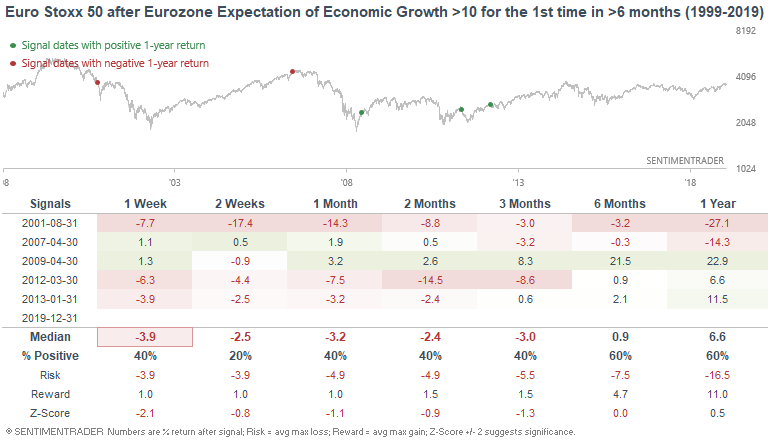
Not decisively bullish. Overall, I don't find this indicator to be terribly useful for market timing because:
- The historical data is limited.
- If an indicator can be spun as bullish or bearish with a simple twist in the study's parameters, then it will confirm whatever existing bias you may have. This tends to occur with studies that have low sample sizes.
Small Microcaps
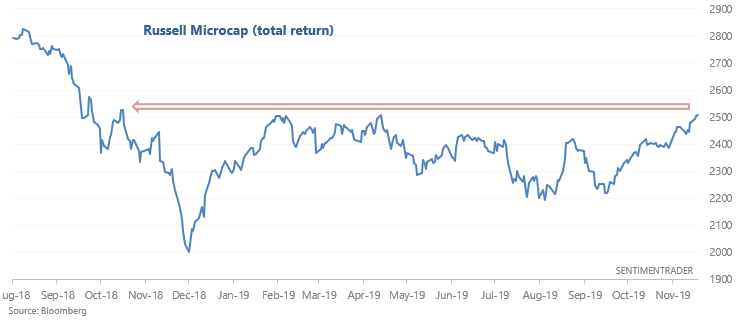
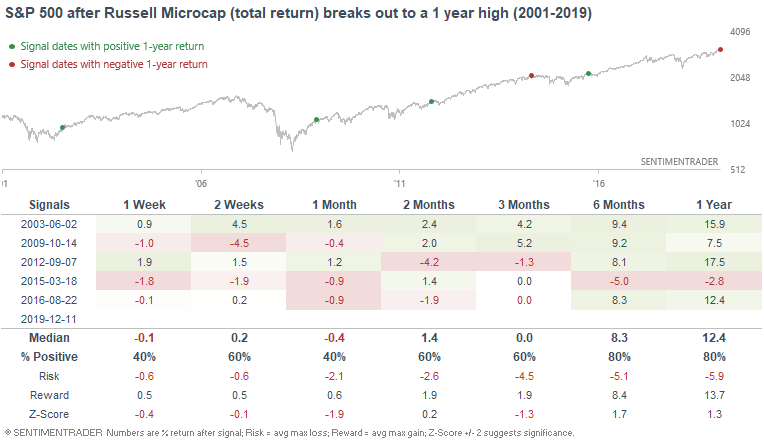
As Dan Russo noted, the Russell Microcap Index (total return) has broken out to the highest level since November 2018. This index tends to move inline with the Russell 2000, with the difference that it focuses on the smallest of small cap stocks.
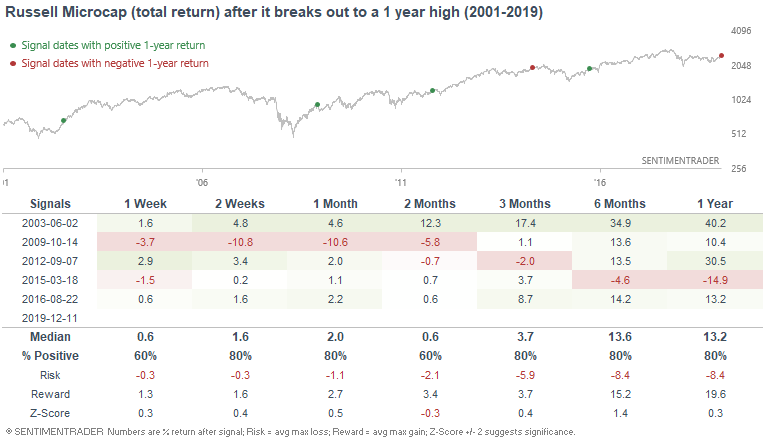
As is the case with most breakouts in the U.S. stock market, these microcap breakouts typically led to more gains in the coming months and year. The one exception was March 2015, when microcaps broke out just as the U.S. stock market entered into a period of high volatility over the next 9 months:
For what it's worth, here's what the S&P 500 did next:
Applying sentiment indicators to sector & factor indices
Recently I've been looking at applying the Stock/Bond ratio and NYSE HiLo Logic Index to various models. What if those models traded certain sectors and factors?
These models don't work very well with factors such as value whose outperformance occurs during bear markets, since the outperformance of these models come from riding bull markets and avoiding bear markets. Instead, these models work better with indices, sectors, and factors that surge during bull markets and crash during bear markets. So let's apply the Macro Index to the S&P 500 Technology sector index and the S&P 500 Growth index.
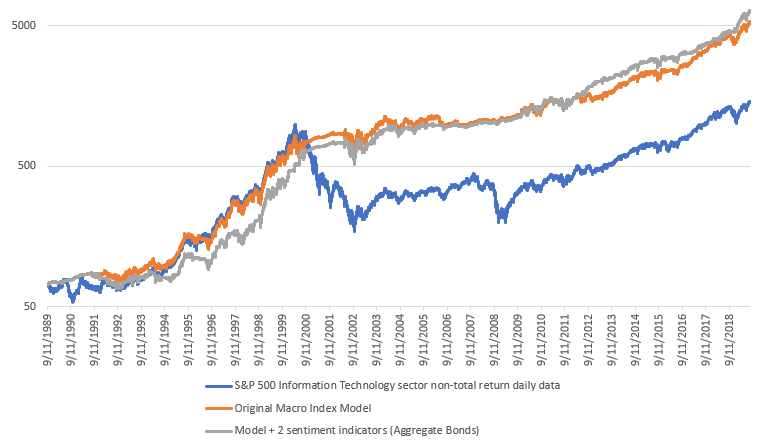
Macro Index (S&P 500 Technology) + 2 sentiment indicators
Average annual returns
From September 11, 1989 - August 1, 2019:
- The original Macro Index Model (S&P 500 Technology sector) has an average annual return of 15.3% per year
- Macro Index Model (+Stock/Bond ratio and NYSE HiLo Logic Index) has an average annual return of 16.02% per year
*These returns do not include the S&P 500 Technology sector's dividends reinvested. Including dividends reinvested, average annual returns would be higher.
Sharpe ratio
From September 11, 1989 - August 1, 2019:
- The original Macro Index Model (S&P 500 Technology sector) has a Sharpe ratio of 0.67
- Macro Index Model (+Stock/Bond ratio and NYSE HiLo Logic Index) has a Sharpe ratio of 0.78
*These Sharpe ratios are lower than what you might expect, since they do not include the S&P 500 Technology sector's dividends reinvested. Including dividends reinvested, Sharpe would be higher.
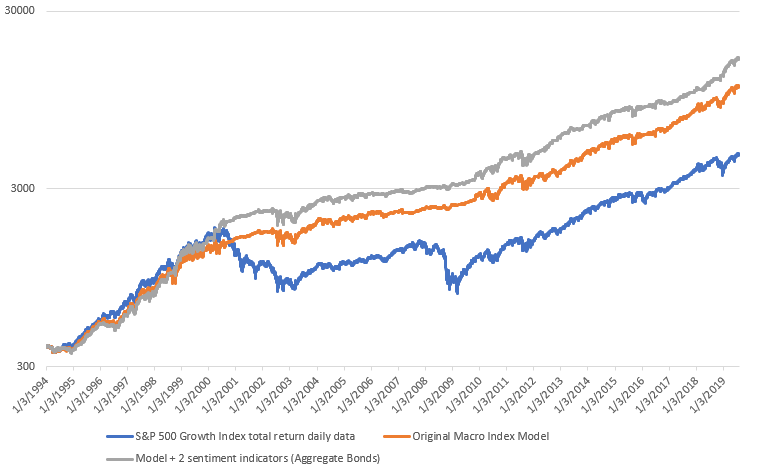
Macro Index (S&P 500 Growth) + 2 sentiment indicators
Average annual returns
From September 11, 1989 - August 1, 2019:
- The original Macro Index Model (S&P 500 Growth index) has an average annual return of 14.11% per year
- Macro Index Model (+Stock/Bond ratio and NYSE HiLo Logic Index) has an average annual return of 15.7% per year
*These returns include dividends reinvested.
Sharpe ratio
From September 11, 1989 - August 1, 2019:
- The original Macro Index Model (S&P 500 Growth index) has a Sharpe ratio of 0.82
- Macro Index Model (+Stock/Bond ratio and NYSE HiLo Logic Index) has a Sharpe ratio of 1.03
My trading portfolio
I've been moving countries and changing residencies over the past half year, so I haven't done much trading up until a month ago. Now that I've settled down, I've reopened trading accounts. In the interest of transparency, I'm going to show you what my own trading portfolio is doing, similar to what Jason does.
From October 25 (when I started to trade again) - present:
- My account is up 2.64%
- Currently 100% in bonds
I don't place discretionary trades - these are purely based on my quantitative models.