Data &
Technology
Research
Reports
Report Solutions
Reports Library
Actionable
Strategies
Free
Resources
Simple Backtest Calculator
Simple Seasonality Calculator
The Kelly Criterion Calculator
Sentiment Geo Map
Public Research Reports
Free Webinar
Pricing
Company
About
Meet Our Team
In the News
Testimonials
Client Success Stories
Contact
Log inLoginSign up
< BACK TO ALL REPORTS

What I'm looking at - sentiment, Put/Call spikes, Treasury yields plunge, breadth reversal

Troy Bombardia
2020-03-03
The stock market's recent crash has pushed sentiment to levels of excessive pessimism. Meanwhile, most stocks participated in Monday's stock market rally.

Here's what I'm looking at:


Sentiment

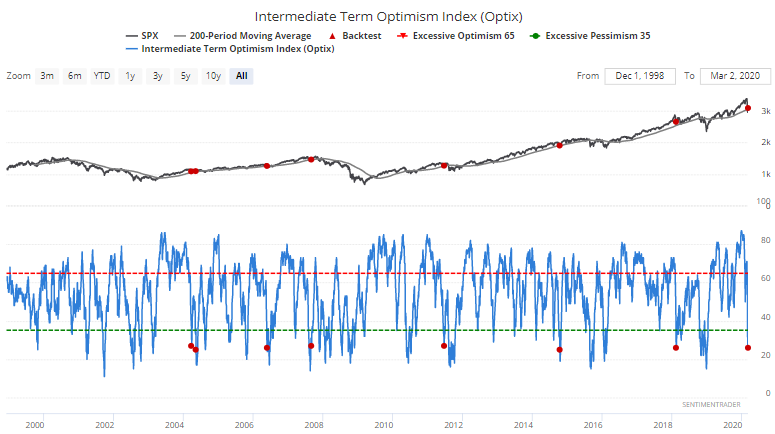
The stock market's recent crash has pushed sentiment down to levels of excessive pessimism. Our Intermediate Term Optimism Index is now at 26. 

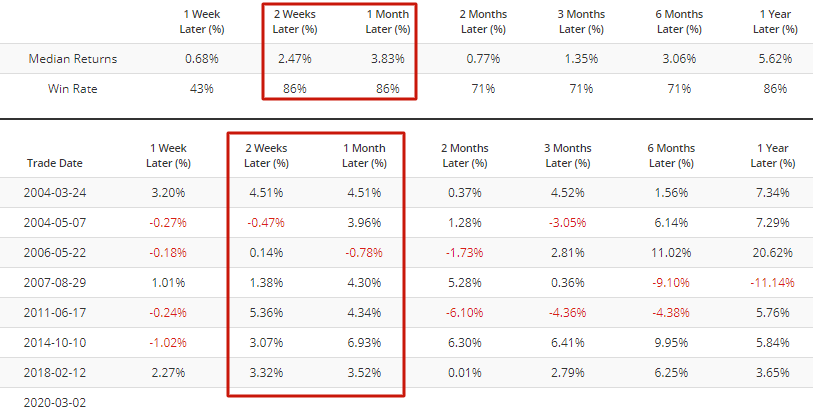
When this happened while the S&P was still above its 200 day moving average (above its long term uptrend), the S&P had a strong tendency to rally over the next 2-4 weeks:

Similarly, the Smart Money/Dumb Money Confidence Spread is showing excess pessimism:

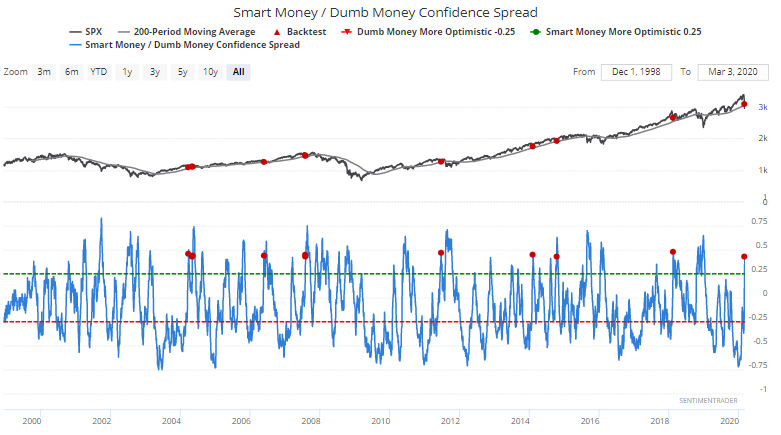
When this happened in the past while the S&P was still in a long term uptrend, the S&P's returns over the next month were almost uniformly bullish:


Put/Call

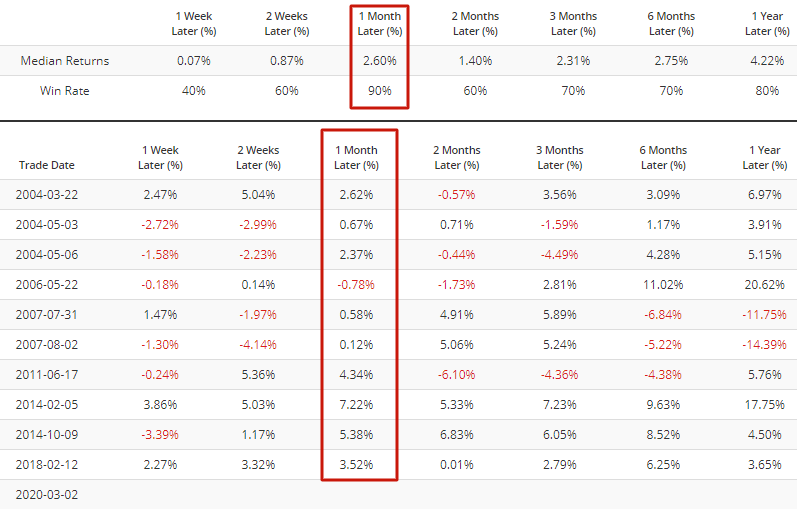
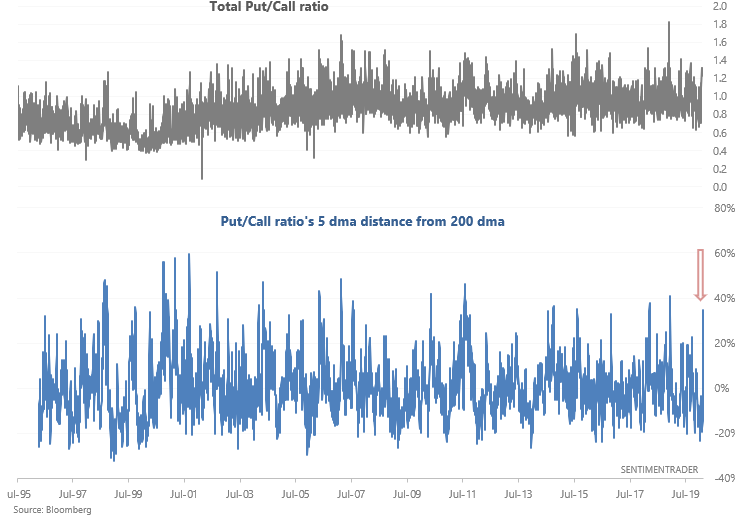
We were highlighting the extremely low Put/Call ratio from January-February as the U.S. stock market surged. But now that the U.S. stock market tanked, puts are back in fashion. The Total Put/Call Ratio's 5 day moving average is more than 34% above its 200 day moving average. The last time this happened was in late-December 2018, just before the stock market bottomed:

Such elevated Put/Call ratios have been quite bullish since 2014. But to avoid recency bias, here's every single historical case and what the S&P 500 did next:

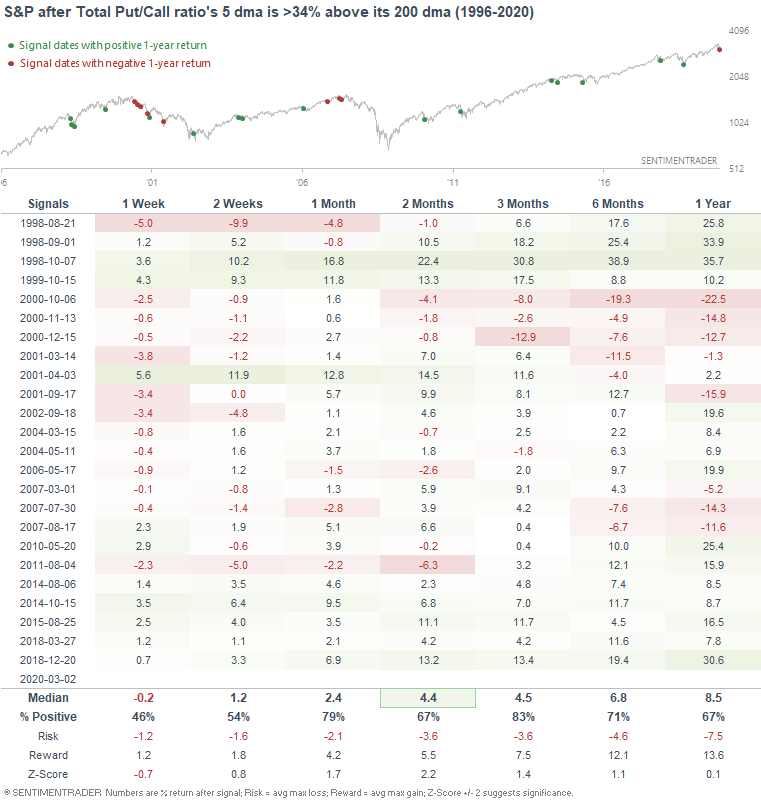
Overall this was a bullish factor for stocks 1 month later with the S&P 500 rising 79% of the time 1 month later.


Flight to safe haven

Bonds surged while stocks crashed last week. And despite yesterday's monster rally, bond prices continue to climb (while yields continue to fall). The 10 year Treasury yield's 14 day RSI has been pushed to one of the lowest levels ever:

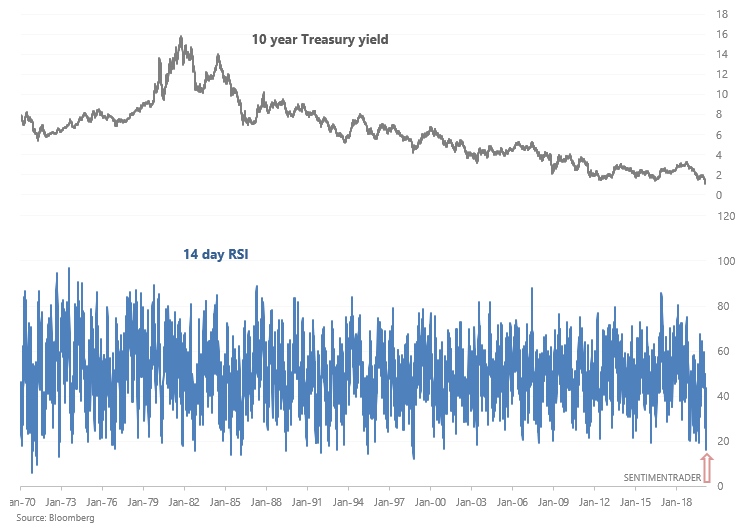
When the 10 year Treasury yield was extremely oversold in the past (bonds were extremely overbought), the 10 year yield had a slight tendency to rise in the months ahead:

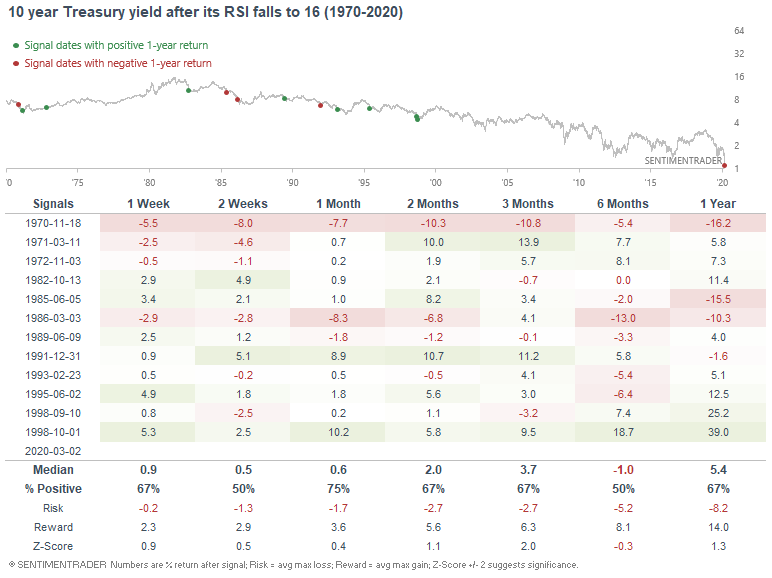
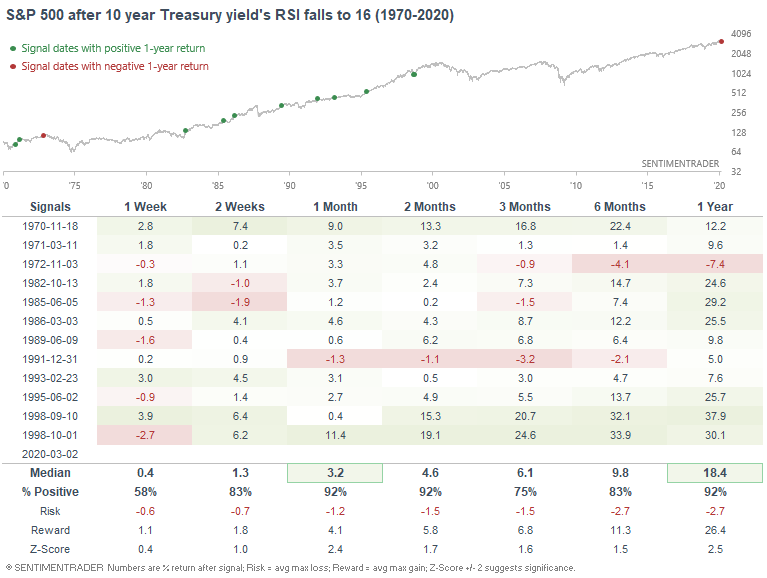
But more importantly, the S&P had a strong tendency to rally over the next 1-2 months since this usually occurred during a major market selloff. 

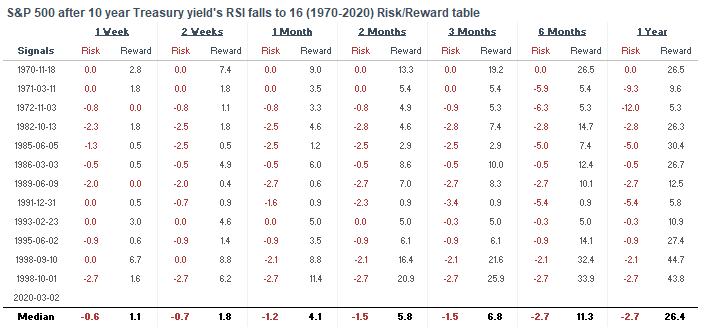
Here's the S&P 500's risk:reward table:
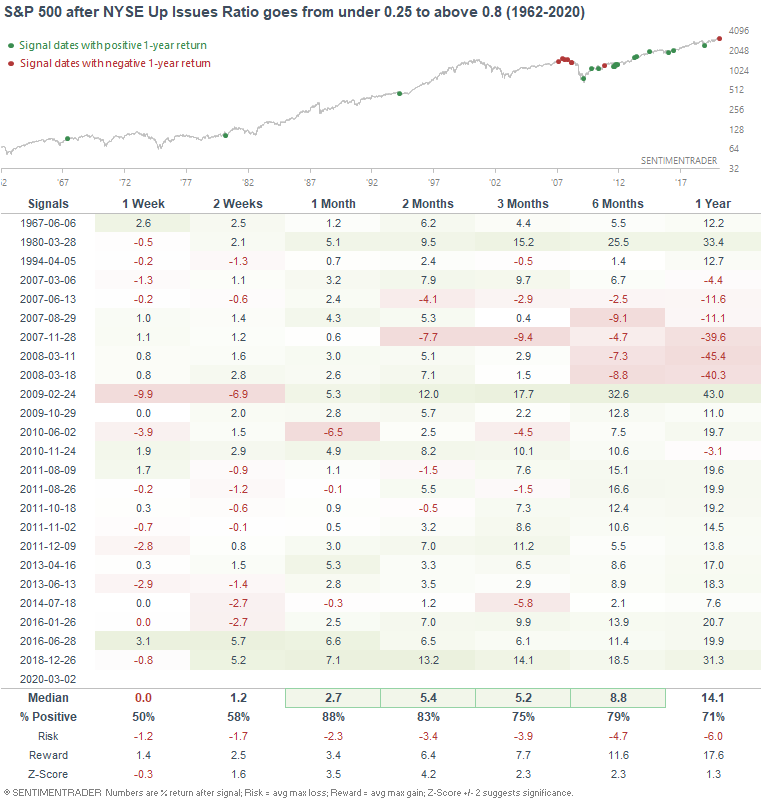

Up Issues

And lastly, the magnitude of Monday's rally was shocking. Just comes to show that extremes occur in both directions (last week's monster drop followed by Monday's monster rally). While most stocks were falling last week, most stocks rallied on Monday. The NYSE Up Issues Ratio went from 0.24 to 0.82:

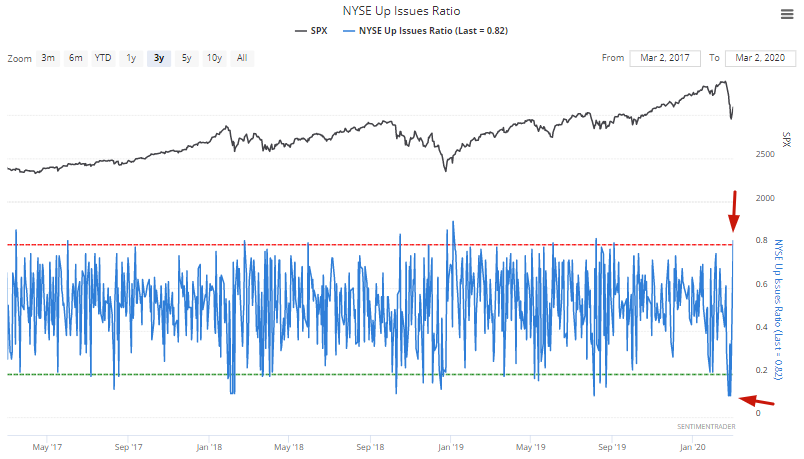
Once again, the last time this happened was just after the stock market bottomed in late-December 2018. Overall, such strong market reversals (in terms of breadth) usually led to more gains for the S&P 500 over the next 1-2 months:

Sorry, you don't have access to this report

Upgrade your subscription plan to get access
Go to Dasboard
DATA &
TECHnologies
IndicatorEdge
‍
BackTestEdge
‍
Other Tools
‍
DataEdge API
RESEARCH
reports
Research Solution
‍
Reports Library
‍
actionable
Strategies
Trading Strategies
‍
Smart Stock Scanner
‍
FREE
RESOUrCES
Simple Backtest
Calculator
Simple Seasonality
Calculator
The Kelly Criterion
Calculator
Sentiment Geo Map
‍
Public Research Reports
‍
Free Webinar
COMPANY
‍
About
‍
Meet our Team
‍
In the News
‍
Testimonials
‍
Client Success Stories
Pricing
Bundle pricing
‍
Announcements
‍
FAQ
© 2024 Sundial Capital Research Inc. All rights reserved.
Setsail Marketing
TermsPrivacyAffiliate Program
Risk Disclosure: Futures and forex trading contains substantial risk and is not for every investor. An investor could potentially lose all or more than the initial investment. Risk capital is money that can be lost without jeopardizing ones’ financial security or life style. Only risk capital should be used for trading and only those with sufficient risk capital should consider trading. Past performance is not necessarily indicative of future results.

Hypothetical Performance Disclosure: Hypothetical performance results have many inherent limitations, some of which are described below. No representation is being made that any account will or is likely to achieve profits or losses similar to those shown; in fact, there are frequently sharp differences between hypothetical performance results and the actual results subsequently achieved by any particular trading program. One of the limitations of hypothetical performance results is that they are generally prepared with the benefit of hindsight. In addition, hypothetical trading does not involve financial risk, and no hypothetical trading record can completely account for the impact of financial risk of actual trading. for example, the ability to withstand losses or to adhere to a particular trading program in spite of trading losses are material points which can also adversely affect actual trading results. There are numerous other factors related to the markets in general or to the implementation of any specific trading program which cannot be fully accounted for in the preparation of hypothetical performance results and all which can adversely affect trading results.

Testimonial Disclosure: Testimonials appearing on this website may not be representative of other clients or customers and is not a guarantee of future performance or success.