What I'm looking at - sentiment extremes, everything is being sold (U.S. equities, emerging markets, gold/silver)
Here's what I'm looking at:
Sentiment extremes
Investors and traders are panicking as coronavirus cases outside of China explode. Businesses are temporarily closing, global travel has ground to a halt, and governments are implementing measures to try and contain the economic fallout. My favorite economist Bill McBride thinks that the U.S. economy is ALREADY in a recession as of March 2020. Unfortunately, leading economic indicators aren't very useful right now since the length of this recession will probably be heavily impacted by how severe the pandemic is.
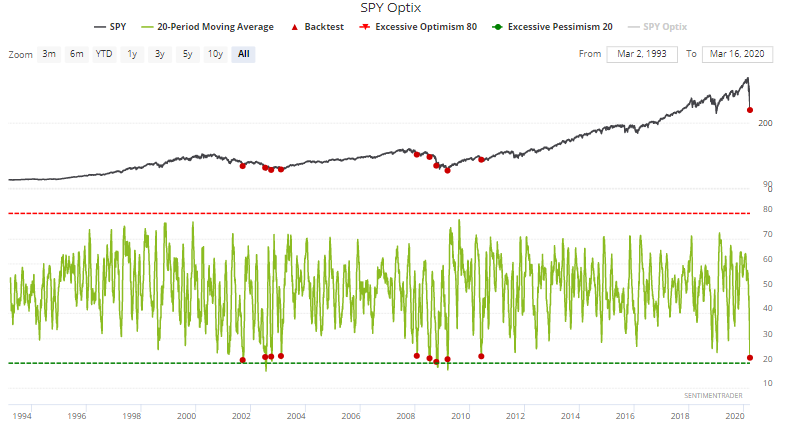
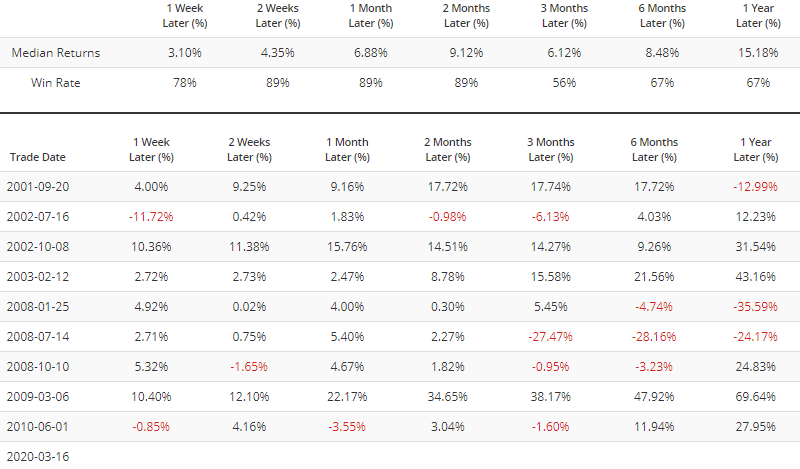
From a markets perspective, this has led to one of the quickest market crashes of all time. A 20 day average of SPY Optix is at one of the lowest readings in history, matched only by the 2000-2002 bear market, 2007-2009 bear market, and 2010 stock market crash.
When medium term sentiment towards U.S. equities was this extreme in the past, the S&P 500 had a very strong tendency to bounce over the next 2 weeks - 2 months, even during the 2007-2009 bear market:
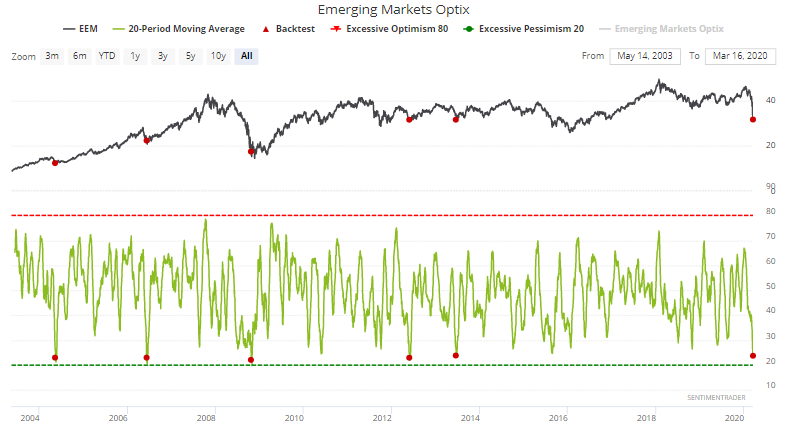
Things are just as bad (if not worse) overseas. Many emerging market indices and European stock indices have dumped to multi-year lows. Our Emerging Markets Optix's 20 dma is at one of the lowest levels ever. When traders were this pessimistic in the past, emerging markets rallied universally over the next 2+ months. This doesn't preclude the possibility that stocks will swing violently up and down in the weeks ahead. But beyond that, risk:reward clearly favored bulls.
U.S. oversold
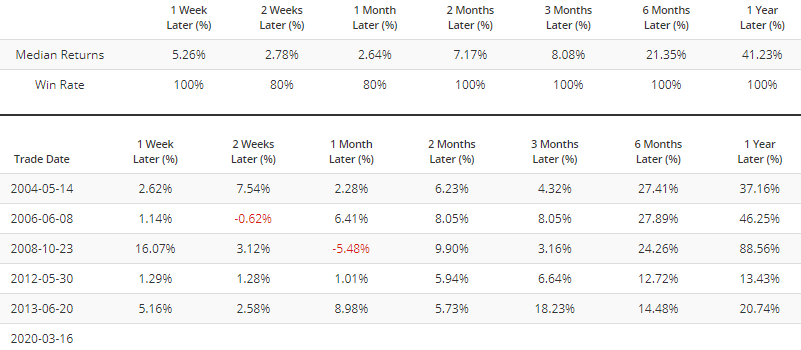
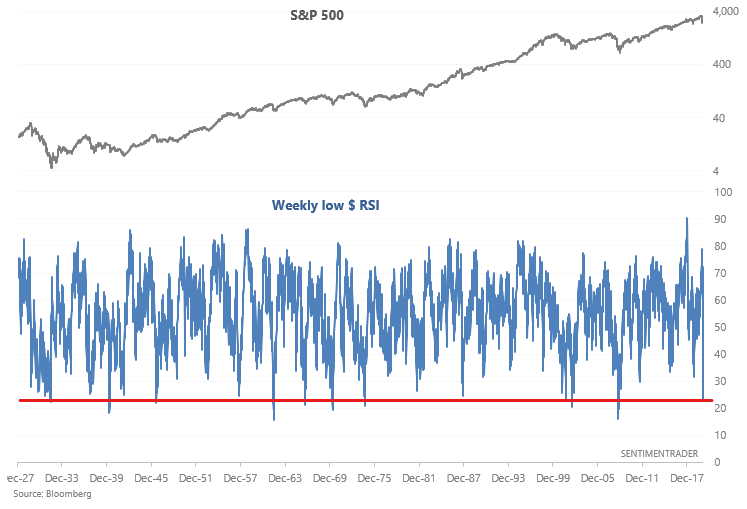
U.S. equities are extremely oversold - there's no doubt about that. The S&P 500's weekly RSI (using lowest $ of the week, since this week isn't over) has fallen below 23, a level last reached during the 2008 market panic:
Many traders easily jump to a "BULLISH!" conclusion when they see extremely oversold conditions. While this is true in a sense, extremely oversold conditions in the stock market are usually followed by a RSI divergence before a more meaningful bottom can be put in place.
When the S&P 500's weekly RSI was this low in the past, its forward returns were more bullish than random on all time frames (which is to be expected). In particular there was a tendency to bounce over the next 1-2 months:
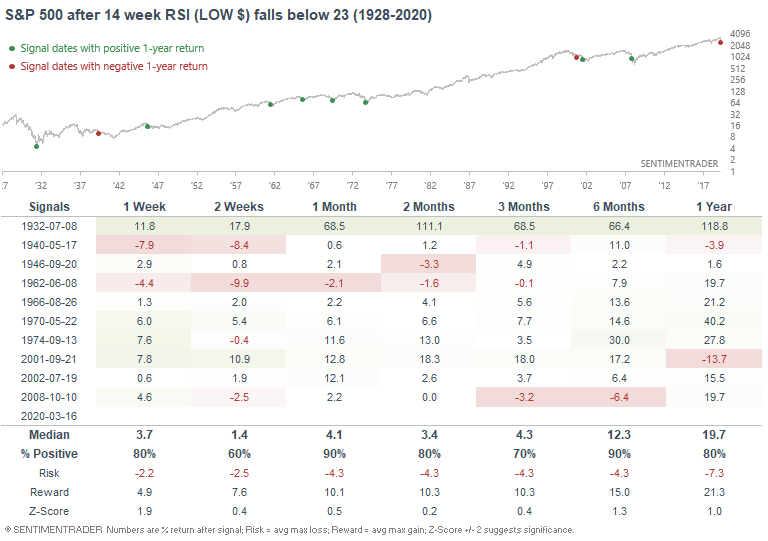
However, this rarely marked the bottom of the selloff. The S&P often bounced and made new lows over the next few months:
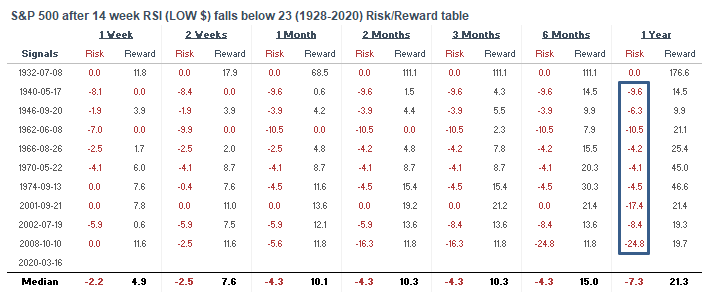
The only case that didn't see a new low was at the bottom of the 1929-1932 crash. But then again, 1929-1932 already saw the mother of all crashes. Hardly comparable to the "small" crash we've seen so far.
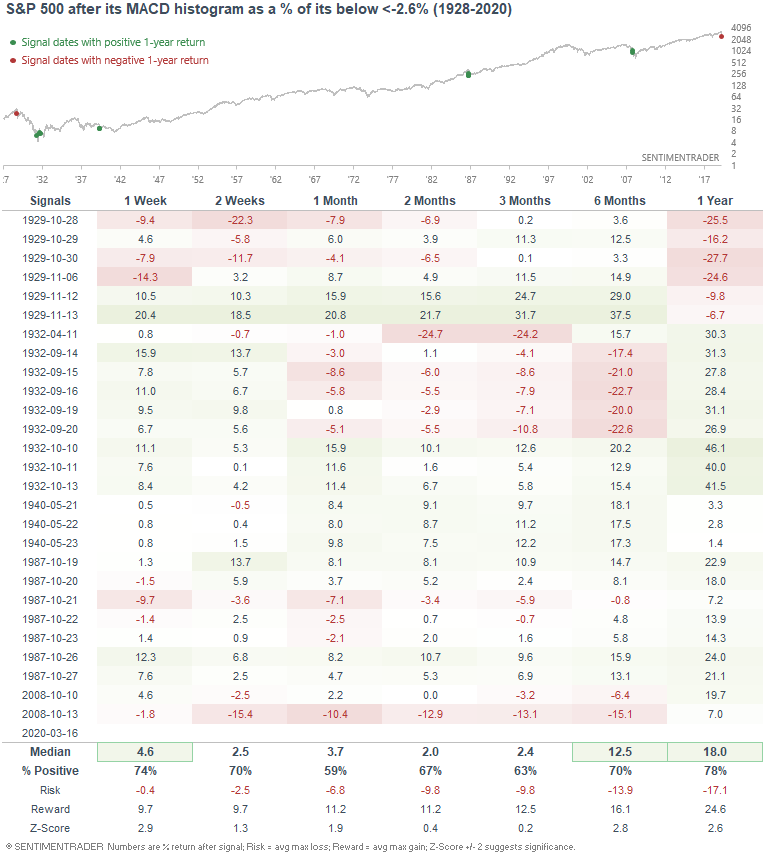
The Wall Street Journal noted that the S&P 500's MACD histogram is at its most extreme ever. In my opinion, the MACD histogram on a multi-decade time frame isn't very useful since MACD is a nominal figure. We need to calculate the MACD histogram as a % of the S&P 500's value for an apples-to-apples comparison :
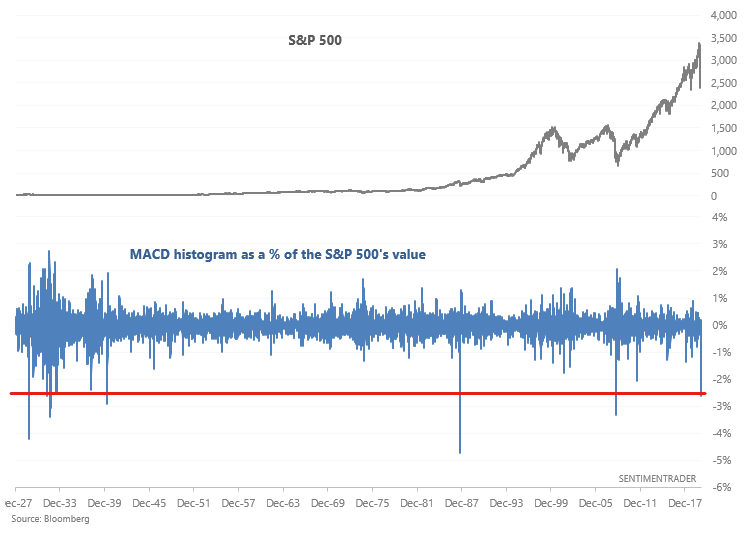
As you may expect, this is still quite extreme. The last 2 times this happened was during the 2008 crash and 1987 crash. Overall, such panicked selling usually led to a bounce over the next week.
Safe haven
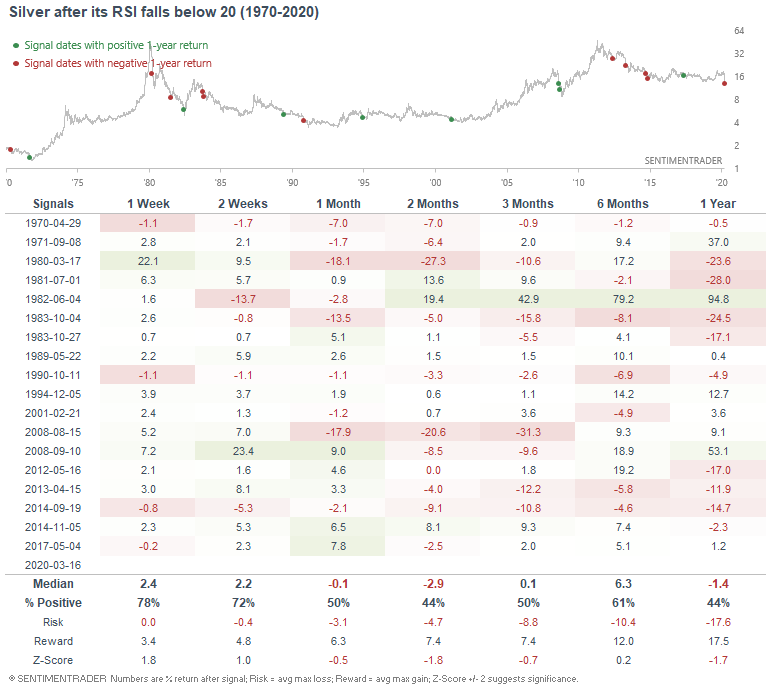
Investors and traders are selling pretty much anything and everything these days. We've gone from "cash is trash" to "cash is king" in just 3 weeks. Traders wandering into gold and silver have no solace, proving that precious metals aren't always a "safe haven" (remember how much gold and silver fell during the 2008 financial crisis). Silver's selloff over the past few days has pushed its momentum to extreme readings:
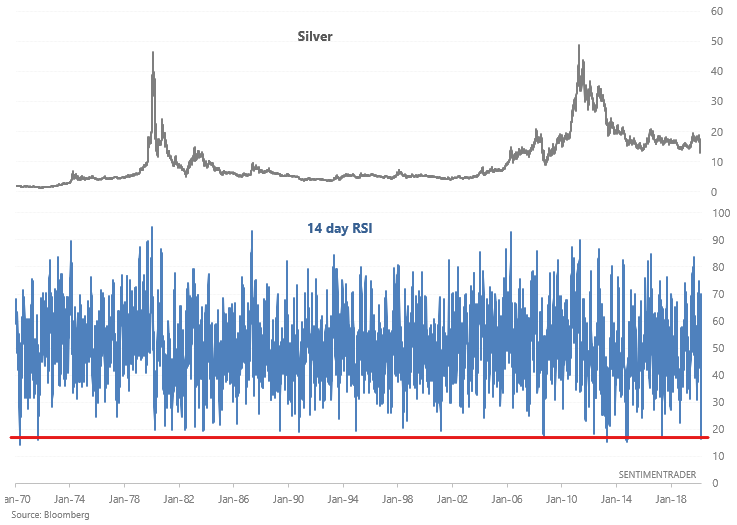
This usually led to a bounce over the next week. But beyond that, silver's forward returns were a wild guess (with a slight bearish lean). I re-iterate what I said a few weeks before: trading commodities is extremely hard. I personally prefer to focus on income producing assets.