What I'm looking at - sentiment composite, consumer discretionary, VIX, energy sector, index Put/Call
Here's what I'm looking at:
Sentiment Composite
Jason and I have looked at optimistic sentiment in multiple ways recently. I've been thinking about different ways to use them in models, and as you may recall, I tested 8 different sentiment indicators ontop of the unemployment rate model. From those 8 indicators, the following 5 added the most additional alpha:
- Stock/Bond Ratio
- NYSE HiLo Logic Index
- Hindenburg Omen
- Medium-Term Risk Levels
- Intermediate Term Optimism Index
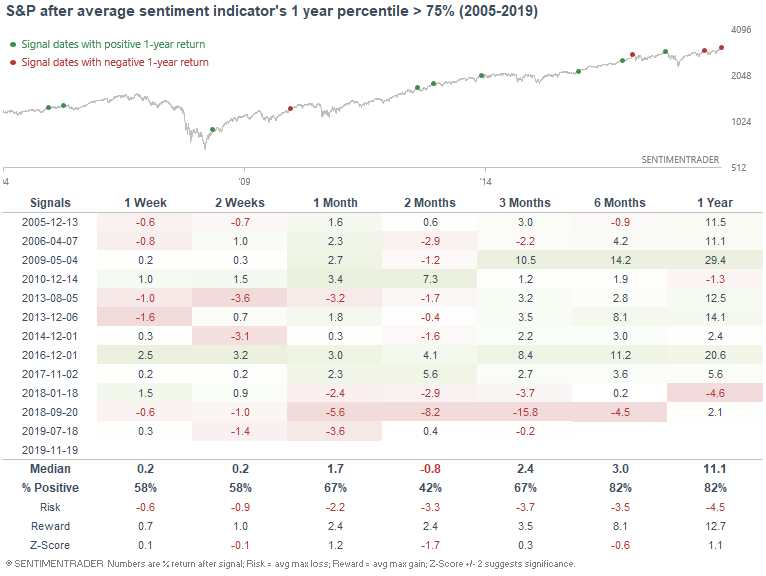
Perhaps here's one way of combining these in an end-to-end model. I took a 1 year percentile rank for each indicator, and calculated an average of the 5:
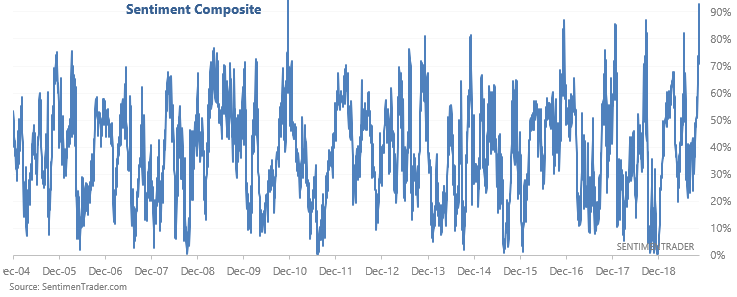
As you can see, sentiment (and breadth) is extremely high right now. When the average percentile exceeded 75% (i.e. right now), the S&P often struggled over the next 2 months:
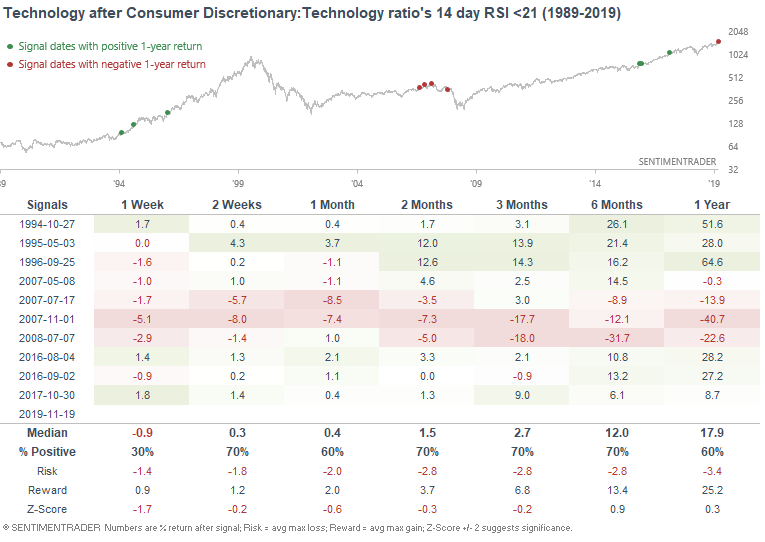
Consumer Discretionary vs. Technology
While technology stocks continue to surge, consumer discretionary stocks are languishing.
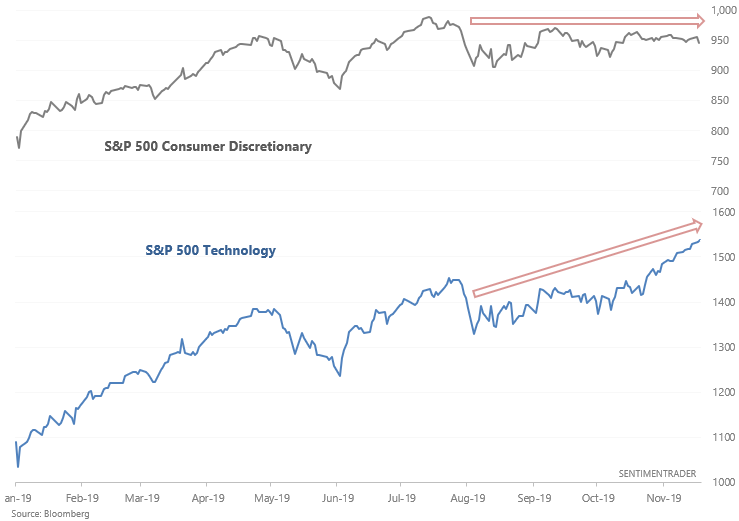
This has caused the S&P 500 Consumer Discretionary vs. Technology ratio to tank recently:
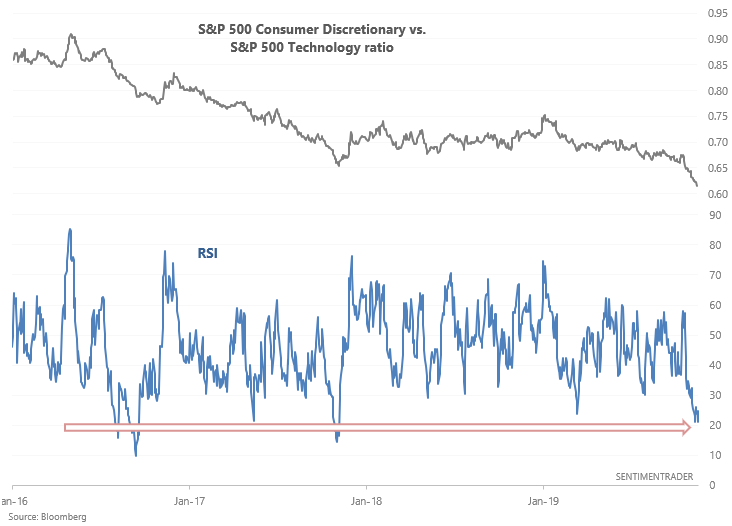
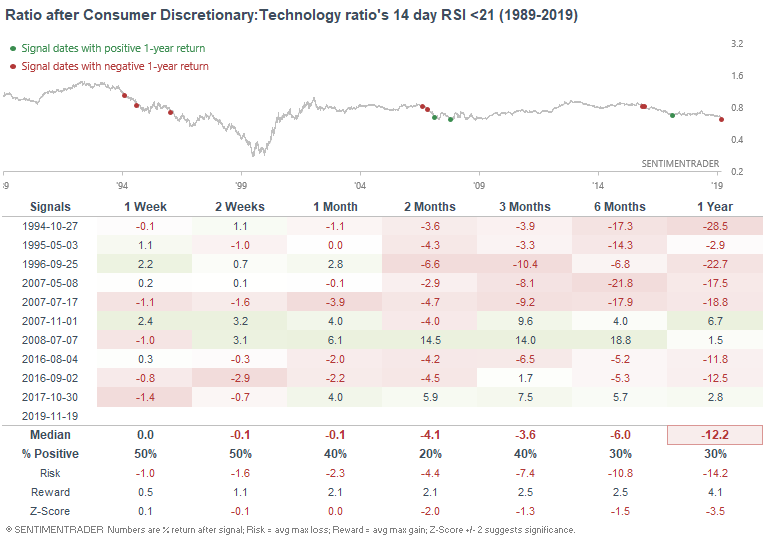
With the ratio's RSI below 21, one would expect the ratio to bounce (i.e. Consumer Discretionary to outperform Technology). But as is often the case with momentum studies, the ratio may bounce in the short term, but after that technology usually continues to outperform discretionary.
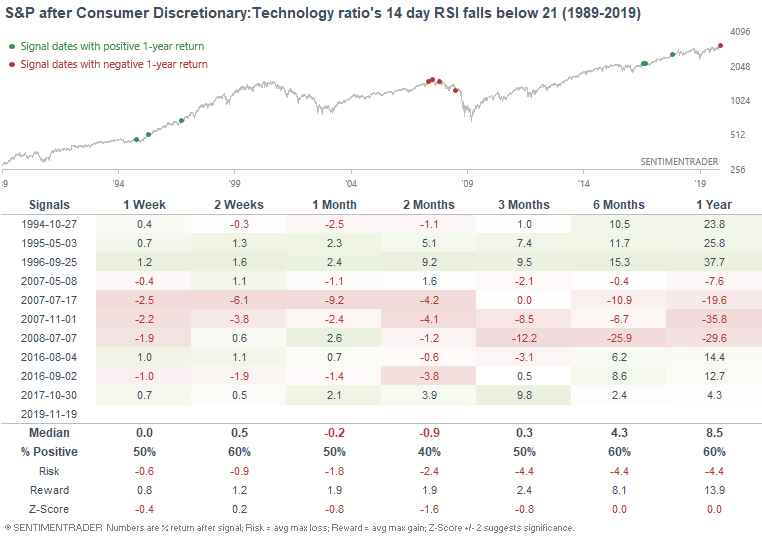
Here's what the S&P 500 did next:
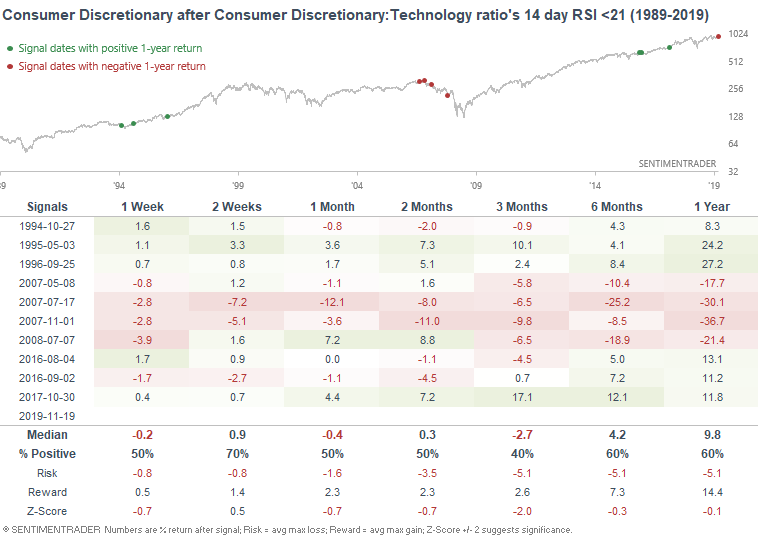
Here's what the Consumer Discretionary sector did next:
And here's what the technology sector did next:
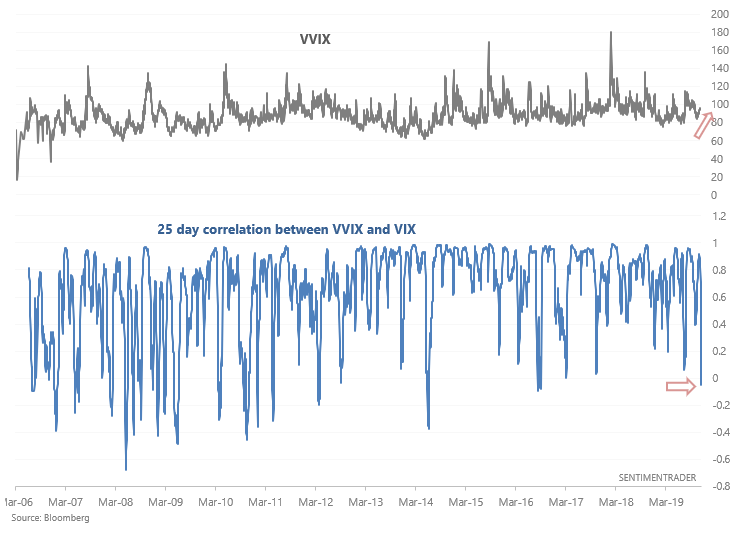
VIX
As Andrew Thrasher pointed out, the 25 day correlation between VVIX and VIX has fallen into negative territory. This is somewhat concerning since:
- These 2 indicators tend to be positively correlated, and...
- VIX is quite low, which increases the chances of a spike in volatility.
The following table illustrates what happened next to the S&P 500 when the 25 day correlation fell below -0.05:
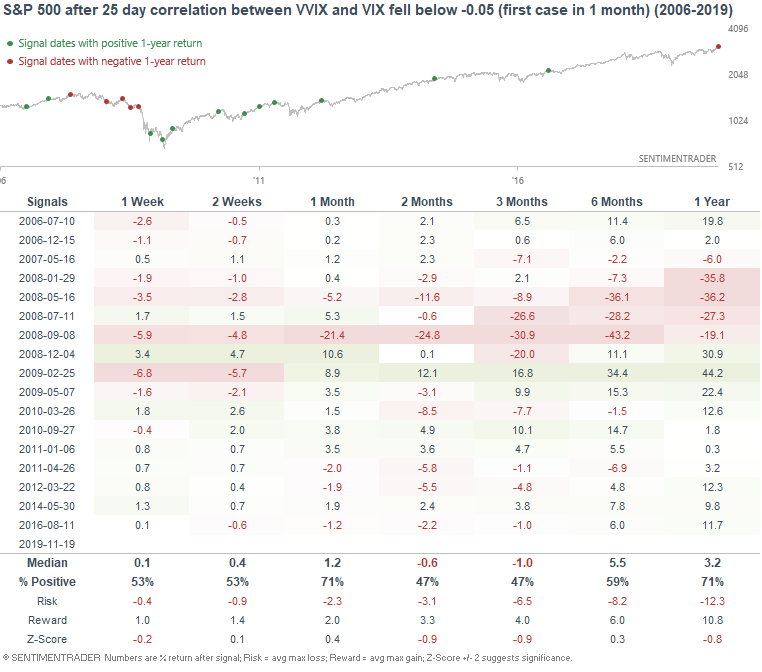
As you can see, the S&P 500 often struggled over the next 3-6 months.
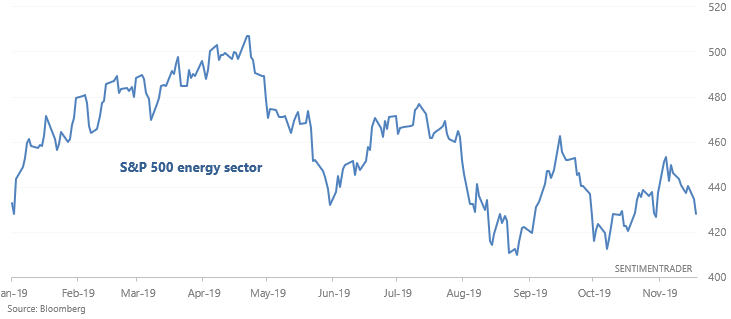
Energy sector
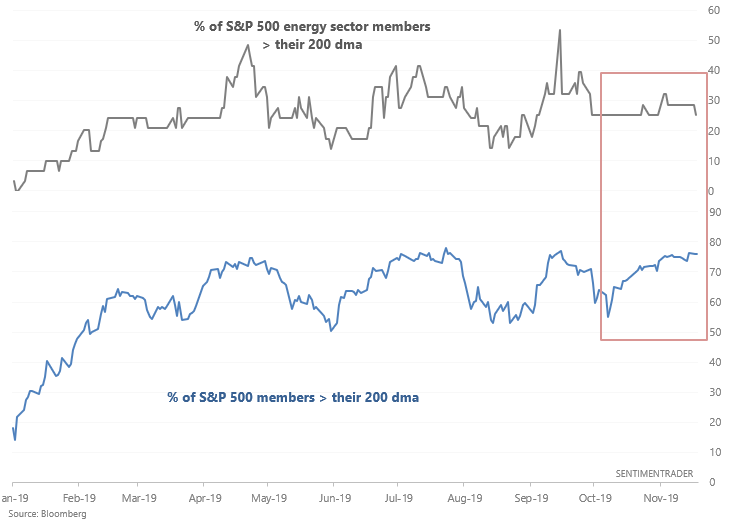
While most of the U.S. stock market's sectors continue to trend up, the energy sector is languishing.
Breadth makes the weakness apparent as well. While more than 75% of S&P 500 members are above their 200 dma's (in an uptrend), only 25% of S&P 500 energy sector members are in an uptrend:
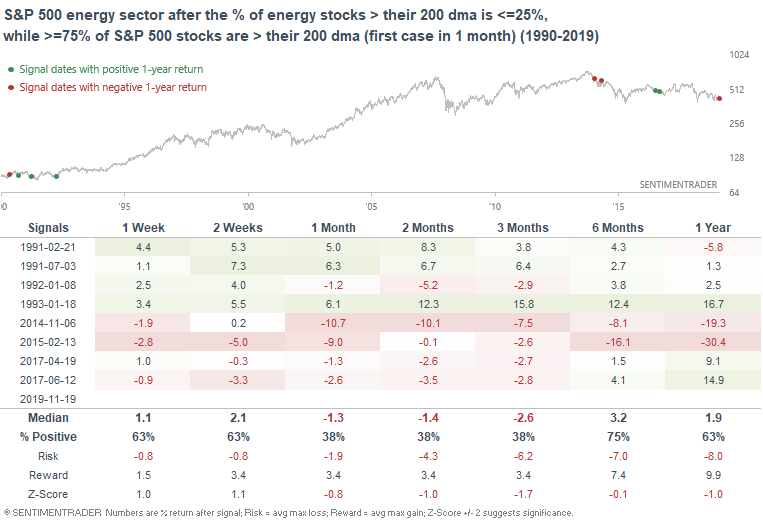
When this happened in the past, the energy sector often languished over the next 2-3 months:
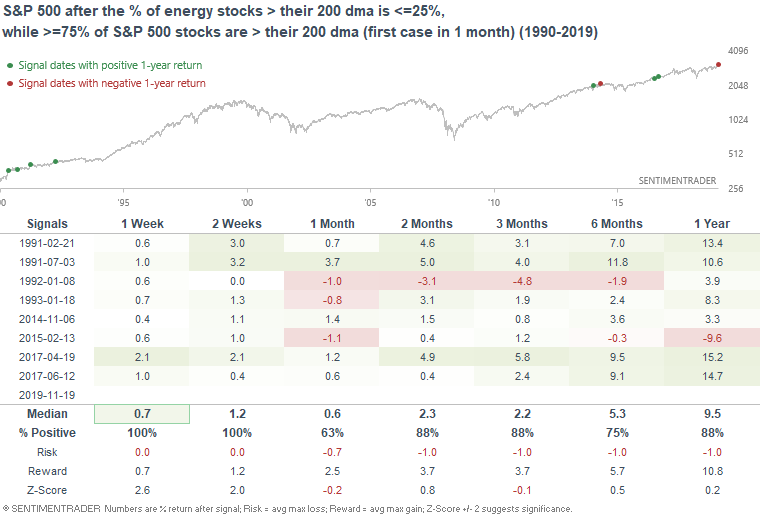
While the S&P 500 outperformed:
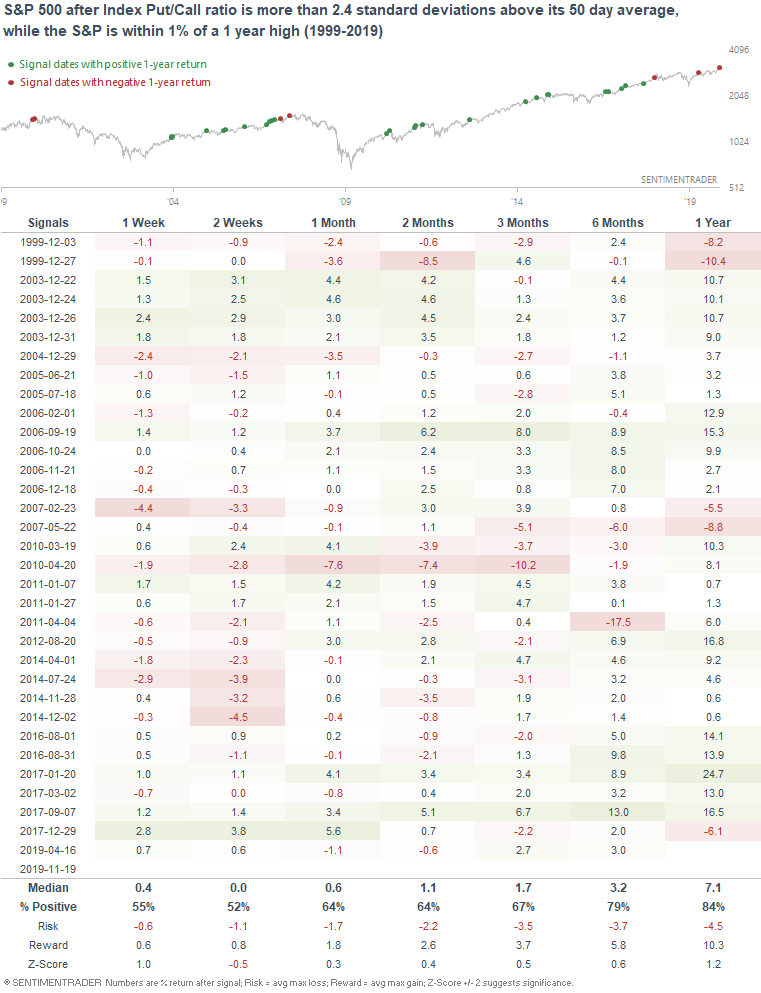
Index Put/Call
And lastly, the Index Put/Call ratio spiked to more than 2.4 standard deviations above its 50 day average:
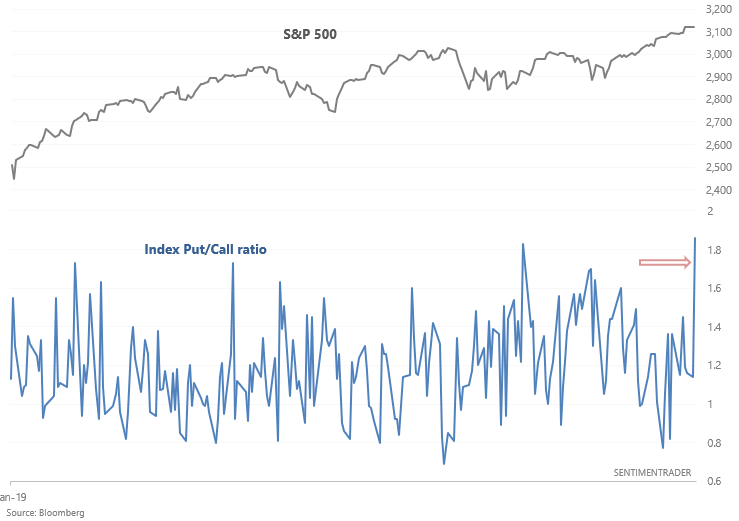
From 1999-present, this has happened 107 times. If we look at the spikes that occurred while stocks were near an all-time high, the S&P's short term returns were no different from random (neither bullish nor bearish), but its returns over the next year were better than random: