What I'm looking at - sectors all or nothing, widening credit spreads, large daily swings, interest rates continue to fall
Here’s what I’m looking at:
Sectors
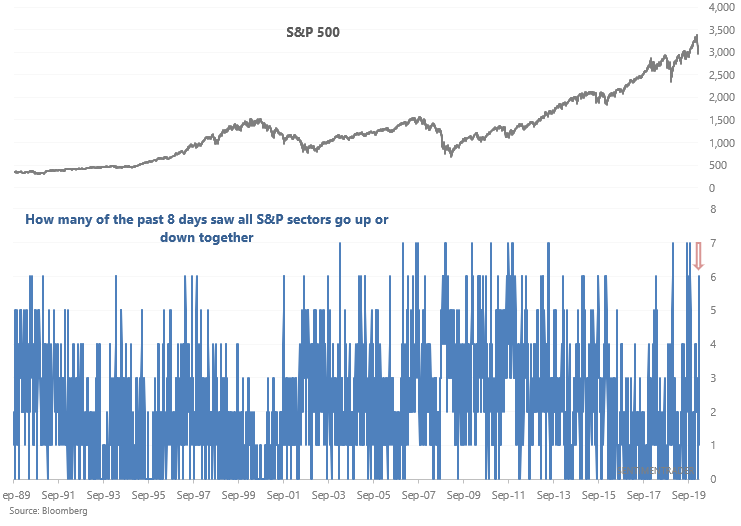
The past few days have been all-or-nothing. On days that the S&P 500 went up, all 10 S&P sectors (excluding real estate, whose data is limited) surged together. On days that the S&P 500 fell, all 10 sectors tanked.
6 of the past 8 days have seen all 10 S&P 500 sectors move in the same direction:
Such moves are common when the S&P 500 is in a long term downtrend. But they're fairly uncommon when the S&P 500 is still in a primary uptrend. There are 2 commonly used ways to define the market's "long term trend":
- Is the market above/below its 200 dma
- Is the market's 200 dma going up/down
Using the first criteria right now is difficult since the S&P 500 is fluctuating around its 200 dma. But it's still possible to use the 2nd criteria since the S&P's 200 dma is going up (and this is unlikely to change from day to day).
The following table looks for historical cases with at least 6 out of the past 8 days having witnessed "all-or-nothing" days, while the S&P was still in an uptrend:
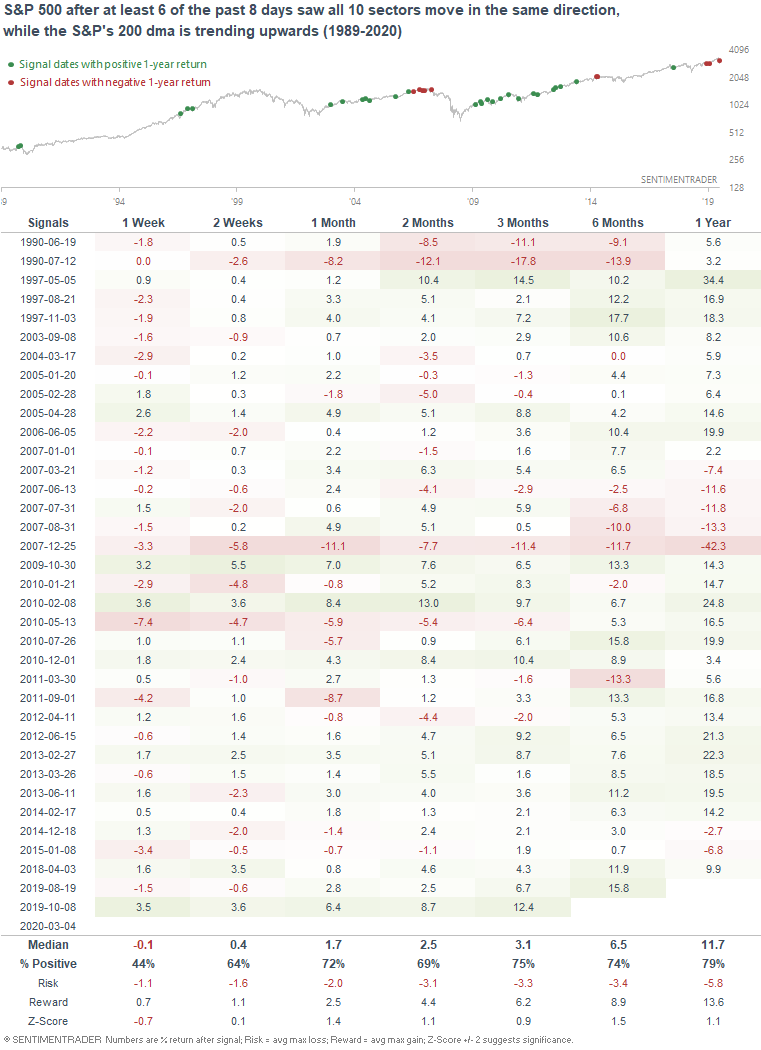
The S&P's returns over the next month were more bullish than random, and this has been particularly true over the past 10 years. Most of the failed cases occurred during the 2007-2009 bear market or the first 2 years of this bull market, when the bull market very choppy and many market participants were still wondering if the 2009-2011 rally was just a major bear market rally.
High yield
As Tiho Brkan noted, high yield credit spreads have widened dramatically over the past 3 weeks as the U.S. stock market crashed. This is to be expected since junk bonds tend to behave more like stocks. The 3 week rate of change is now among the highest over the past 20 years, matched only by 2 historical cases near the 2007-2009 bear market.
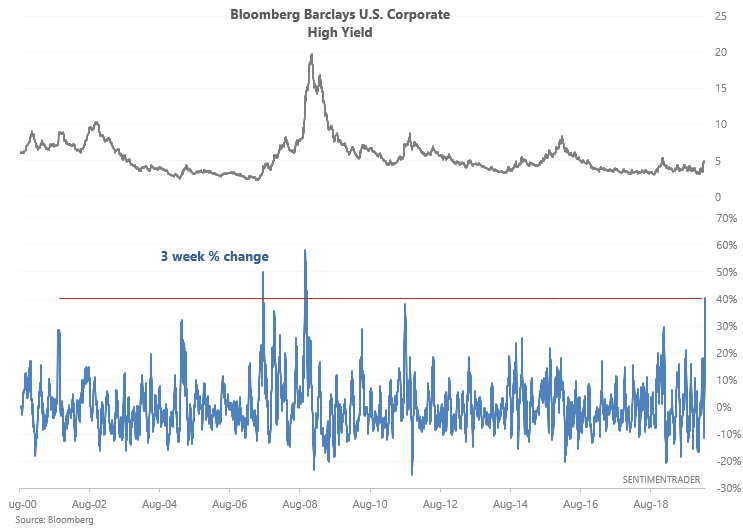
So what does this mean for markets? Relaxing the parameters, we can look for historical cases in which the Bloomberg Barclays U.S. Corporate High Yield's 3 week rate-of-change exceeded 25%:
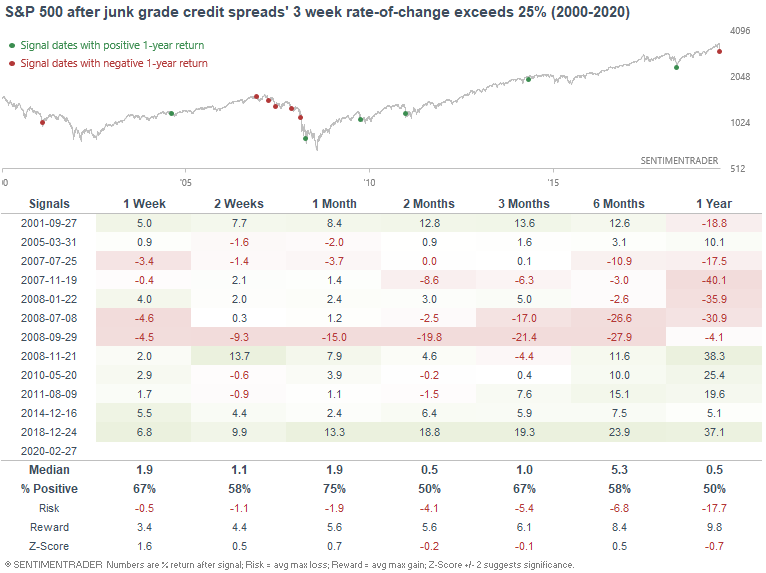
As one would expect, this is about as bad as it gets during a bull market. This has consistently marked meaningful short-medium term bottoms from 2008-present. But using this as a bullish signal in bear markets is iffy. Sometimes it works (see post-9/11), and sometimes it fails (see November 2007 and 2008).
Daily swings
The U.S. stock market continues to experience large daily swings. A 7 day average of the S&P 500's daily high/low range is at the highest level since the August 2011 stock market crash:
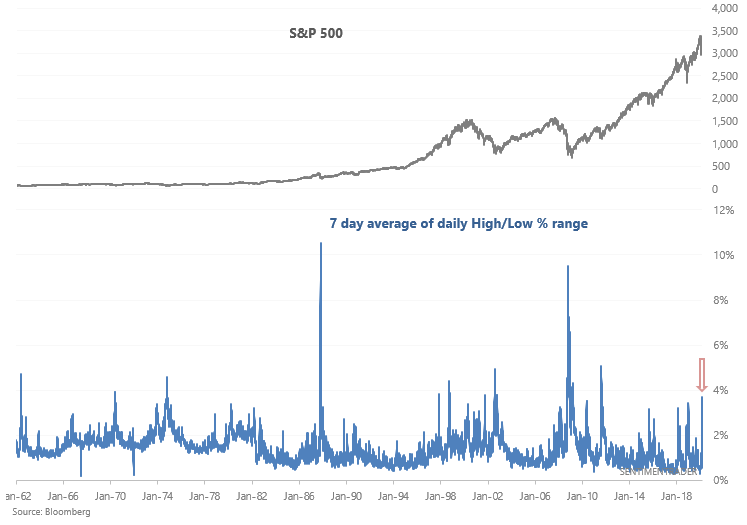
Extreme volatility isn't consistently bullish or bearish in the short term. The market can swing both ways (more often than not, the market crashes, bounces, and then pulls back before bottoming). But since extreme volatility tends to happen after a stock market crash, this was mostly bullish for stocks over the next 3-12 months.
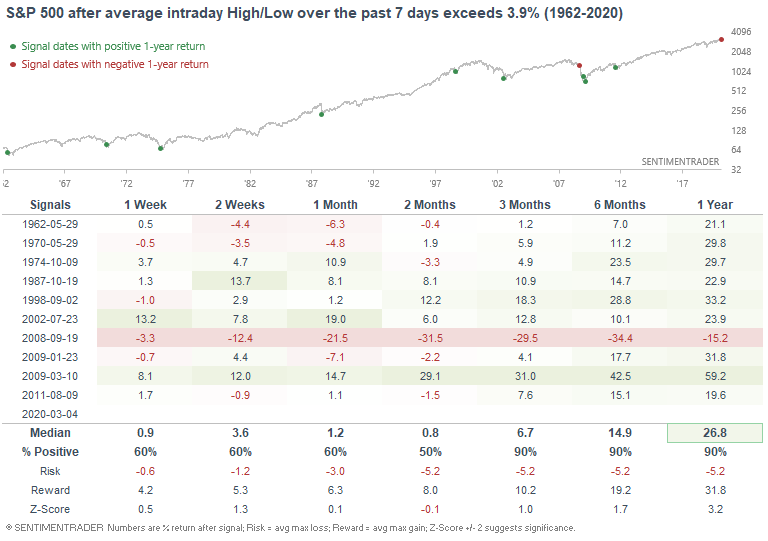
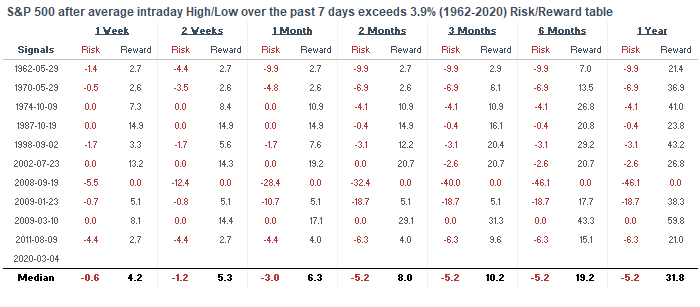
If we look at the S&P's max drawdowns over the next month, it's clear that predicting the short term is difficult. Some cases saw the S&P bottom immediately (i.e. no drawdowns), while others saw large losses followed by a rally. In times like this, I find that it's better to focus on medium term risk:reward than to be driven insane by the market's large intraday movements. I am not a day trader.
2 year Treasury yield
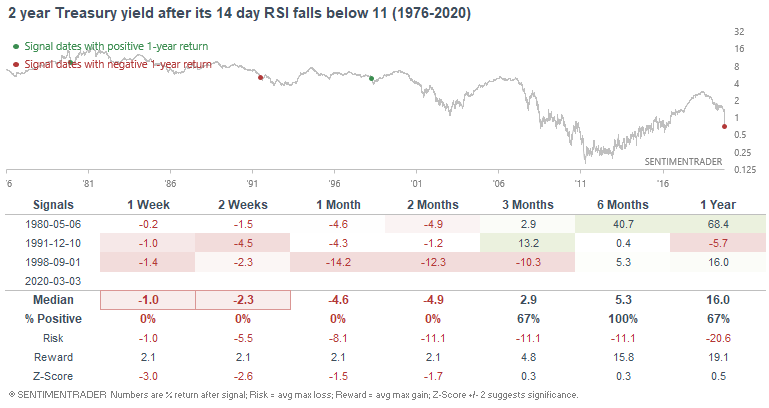
And lastly, Treasury yields continue to sink. The 2 year Treasury yield's 14 day RSI is among the lowest ever.
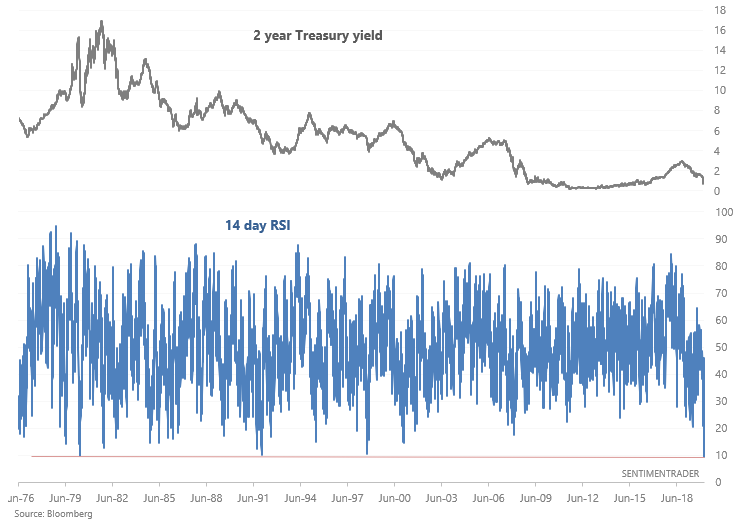
"Eventually" Treasury yields bottomed. But it's difficult to know where that bottom is. Sometimes yields make a temporary bounce, washout oversold momentum, and then fall even more.
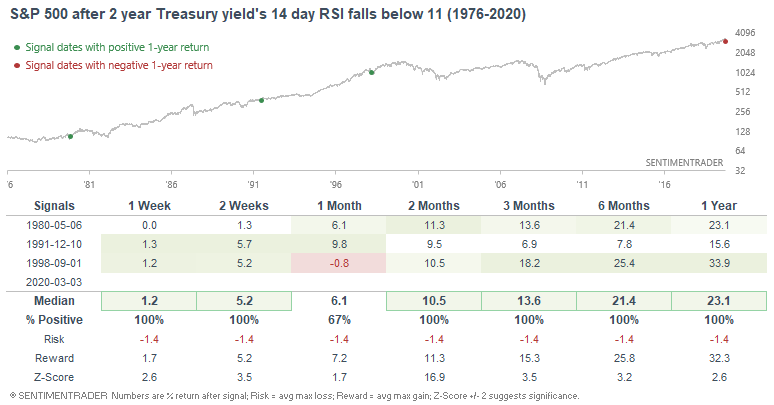
With that being said, here's what the S&P did next:
How I allocate my assets
Instead of sharing how I manage my own trading portfolio, here's how I allocate all my assets for the sake of full transparency. Some of these percentages are approximate, particularly for private assets (since private assets don't have a value on a day to day basis).
- 40% emerging market real estate.
- 20% trading portfolio. My trading portfolio is allocated 50% in the Macro Index Model and 50% in the Simple Trading Model With Fundamentals. Right now I am 25% long stocks and 75% long bonds
- 20% is a buy and hold position for the S&P 500 which I won't sell unless I see better opportunities in private markets. This IS NOT a trading position - here I care about the earnings yield. I expect this portion of the portfolio to see weak returns over the next 5-10 years given that valuations are high (and hence earnings yields are low).
- 20% in short term Treasury bond ETFs. This is a temporary placeholder. When opportunities arise I will sell these cash-like instruments to fund private market investments.
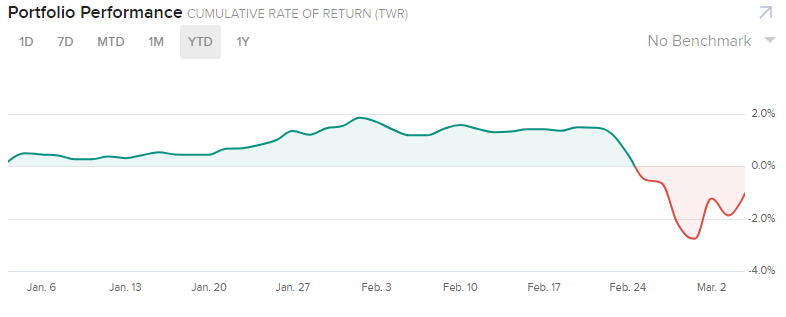
YTD 2020 performance for my public markets portfolio (trading portfolio, buy and hold position, temporary placeholder):
-1.04%