What I'm looking at - Recession Probability Model, emerging markets, Treasury yields, breadth, Consumer Confidence
The S&P has rallied back to the top of this month-long range. Here's what I'm looking at.
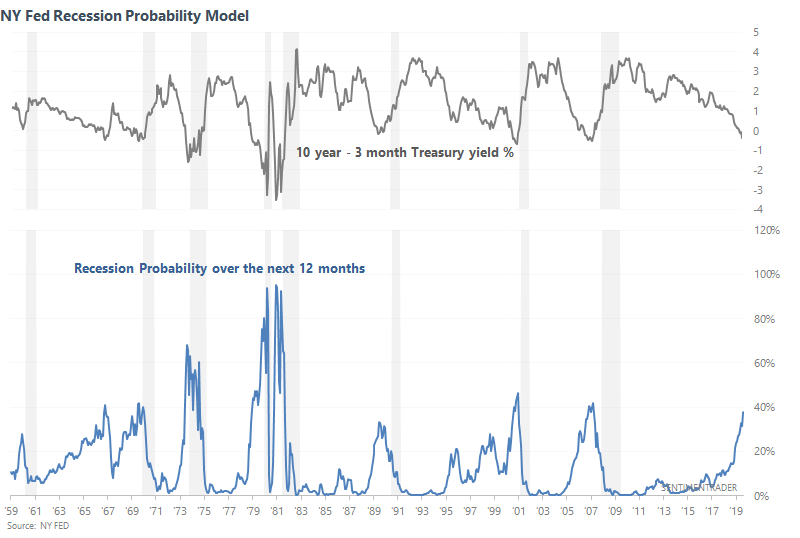
NY Fed Recession Probability Model
With the yield curve pushing deeper into inversion territory, the "probability of a recession" from various popular recession models based on yield curves continues to climb. For example, the NY Fed's Recession Probability Model is now at 37%.
Here's what happened next to the S&P 500 when the NY Fed Recession Probability Model exceeded 37% in the past.
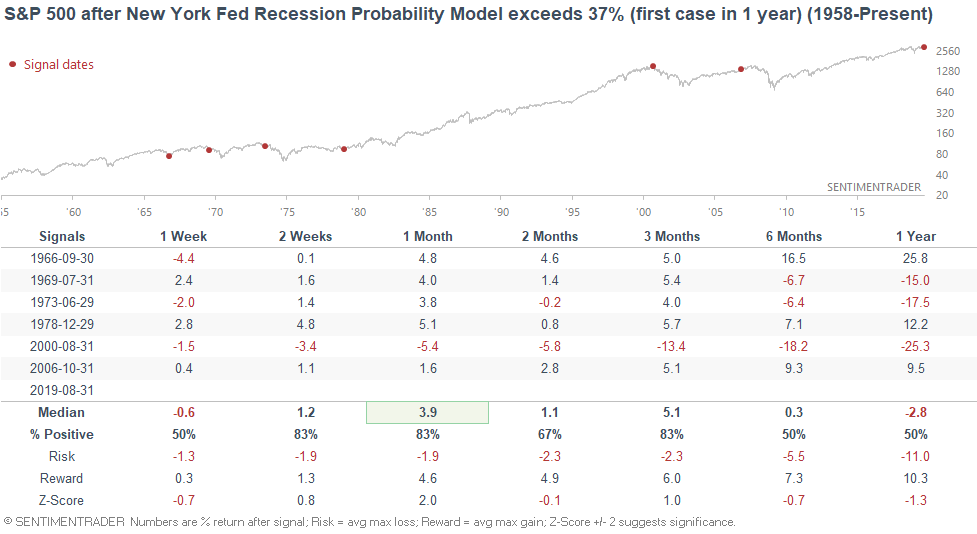
As you can see, this isn't an immediate concern for the S&P 500. It was more of a concern over the next 6-12 months.
*On a sidenote, please remember that many "recession is coming!" media headlines are just repeats of eachother. E.g. if you read 8 articles that say "recession is coming because the yield curve is inverted!", these are really just 1 story. Repeating 1 story in 8 different ways makes it seem more important, but it really isn't. The yield curve is merely one of many macro factors to consider.
Emerging markets
Emerging markets continue to underperform the U.S. stock market, and for good reason. The ongoing trade war has hurt emerging markets (including China) more than the U.S. As a result, the MSCI Emerging Markets Index has underperformed the S&P 500 for 7 months in a row.
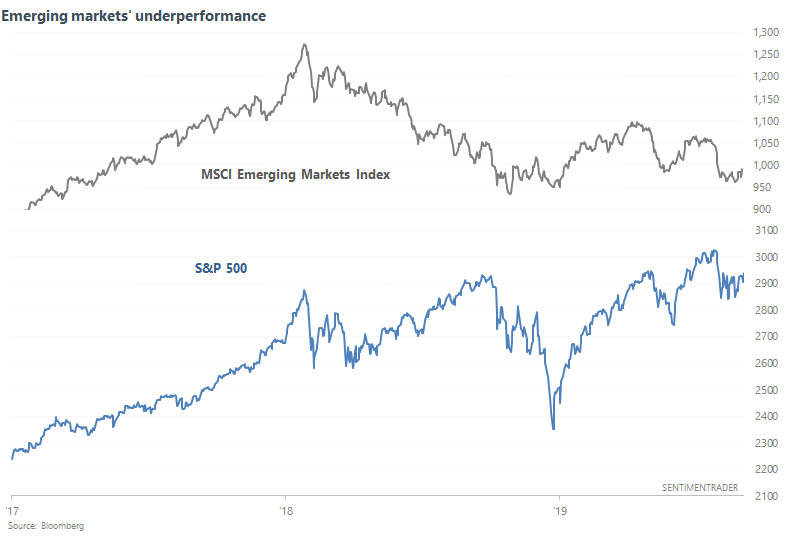
Such a long streak of underperformance has only happened 5 other times, each of which saw the S&P rally over the next 6-12 months.
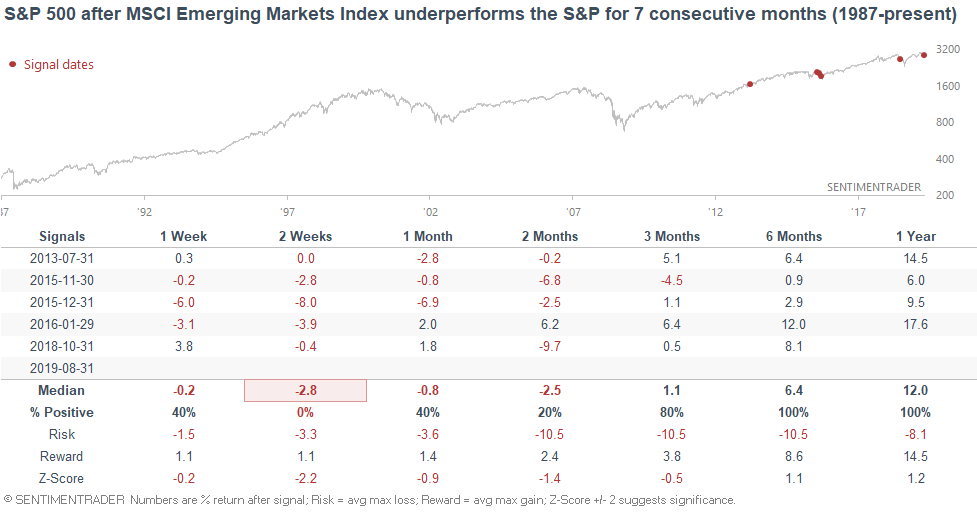
It's hard to treat this as a bullish factor for the S&P 500 over the next 6-12 months, since all of the cases have occurred only in this bull market and the sample size is small. Here's what happened next to the MSCI Emerging Markets Index.
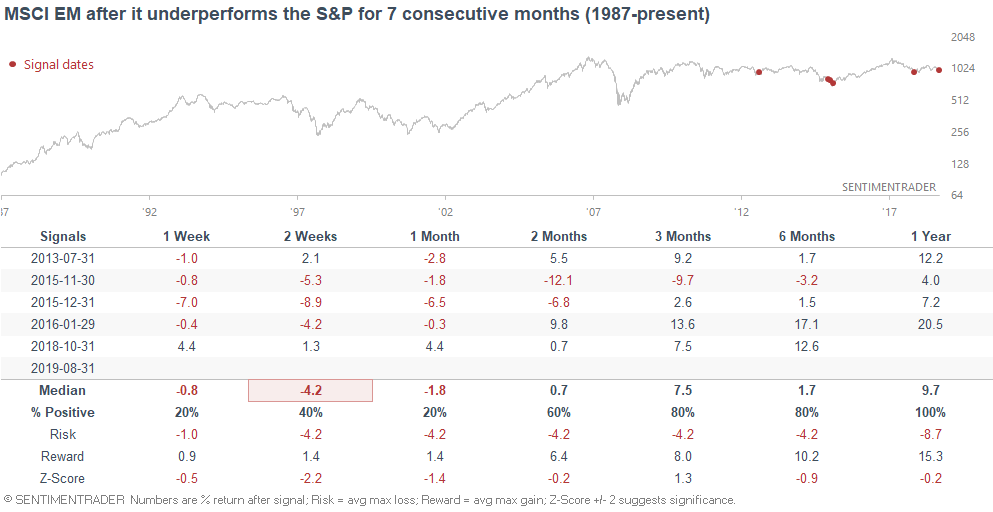
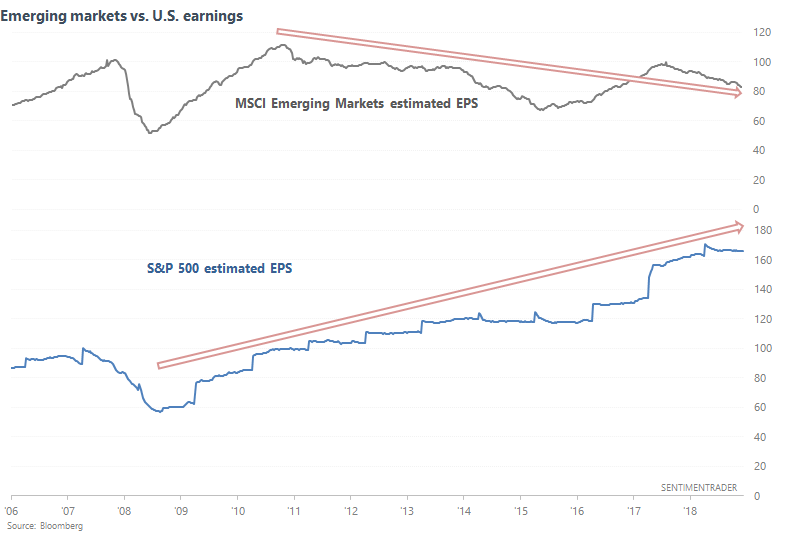
Emerging markets have consistently underperformed the U.S. stock market over the past 10 years because EM corporate earnings have gone nowhere. That's why there are no historical cases of "EM underperforming the S&P for 7 straight months" before the current bull market.
Treasury yields
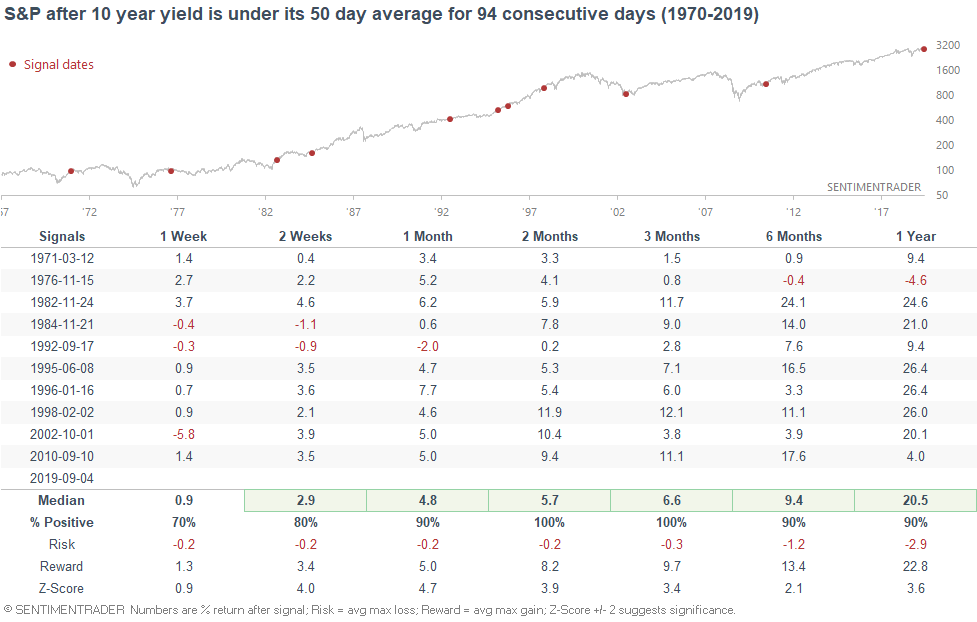
Despite many calls for a rally in Treasury yields, the 10 year Treasury yield continues to fall in a nonstop fashion. As a result, the 10 year yield has been under its 50 day average for 94 consecutive days.
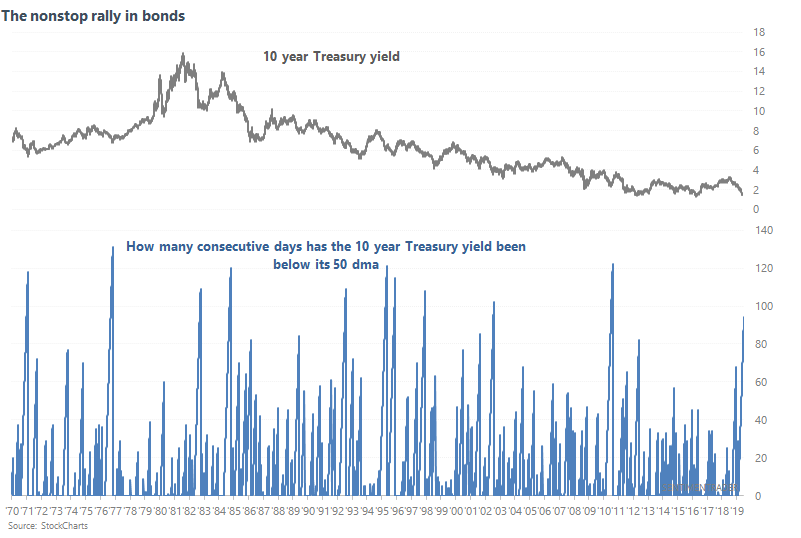
When the 10 year Treasury yield was in a persistent downtrend in the past, it usually rallied over the next 3 months. However, this didn't stop the 10 year yield from falling more in the short term (next few weeks). The exact bottom of a crash is hard to predict, so focus on risk:reward.
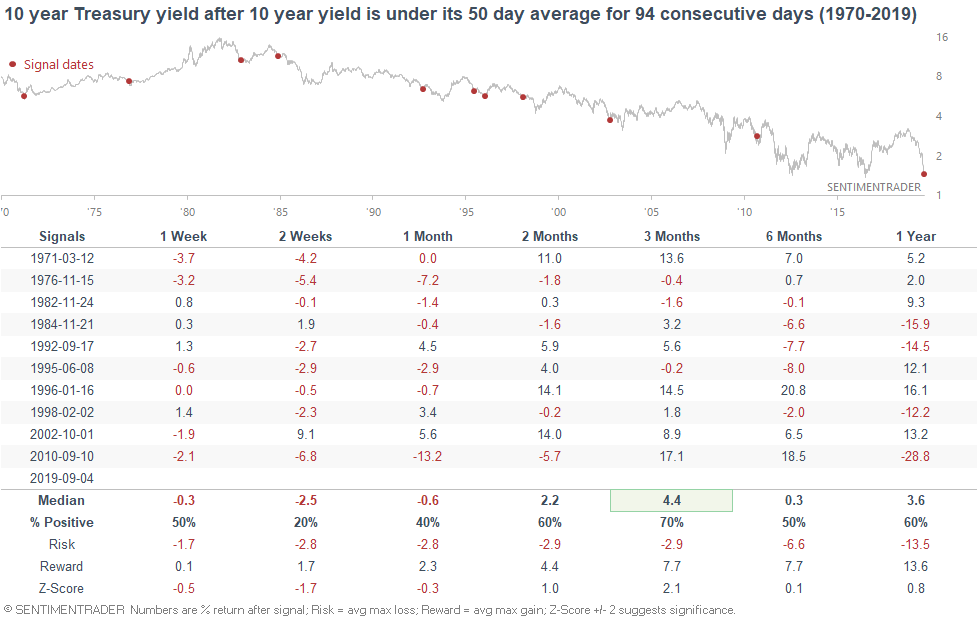
And on a sidenote, this wasn't consistently bearish for U.S. stocks on any time frame.
Volume-based breadth
Stocks surged today, and 88% of volume flowed into NYSE issues that went up.
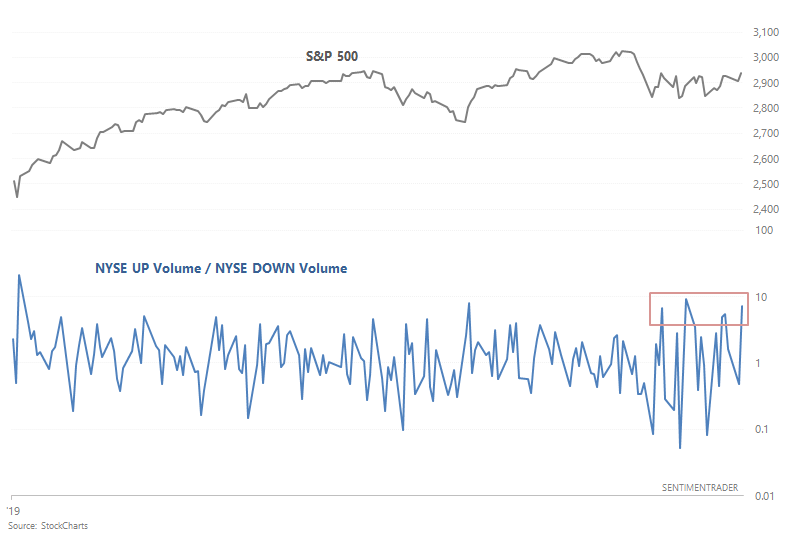
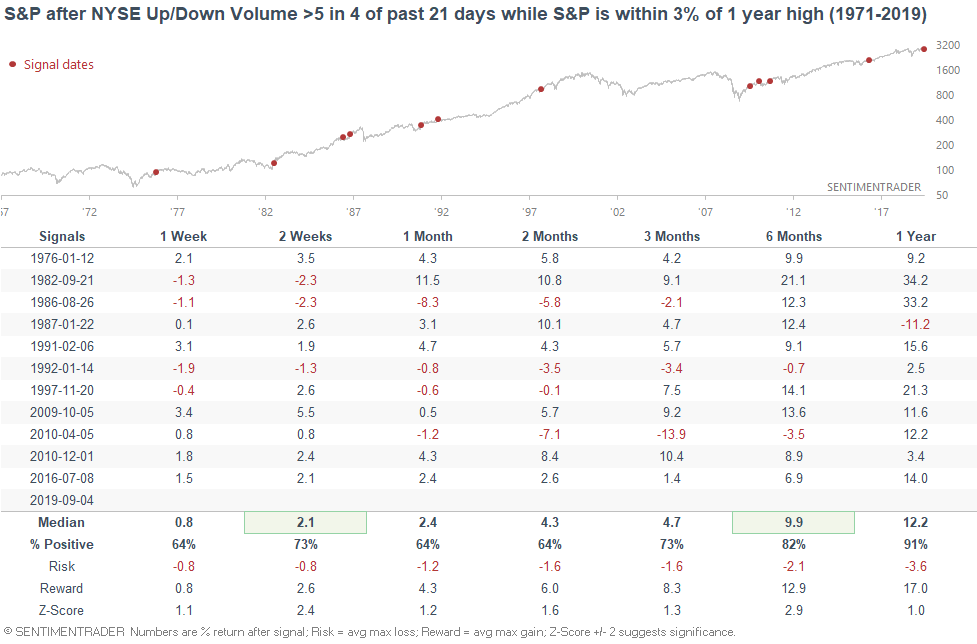
There have been four days of 5-to-1 surges over the past month (5x more NYSE Up Volume than NYSE Down Volume). This is rare when the S&P is so close to an all-time high. In other words, volatility is high, but it's going in the right direction (upwards). When this happened in the past, the S&P often did well over the next 6-12 months.
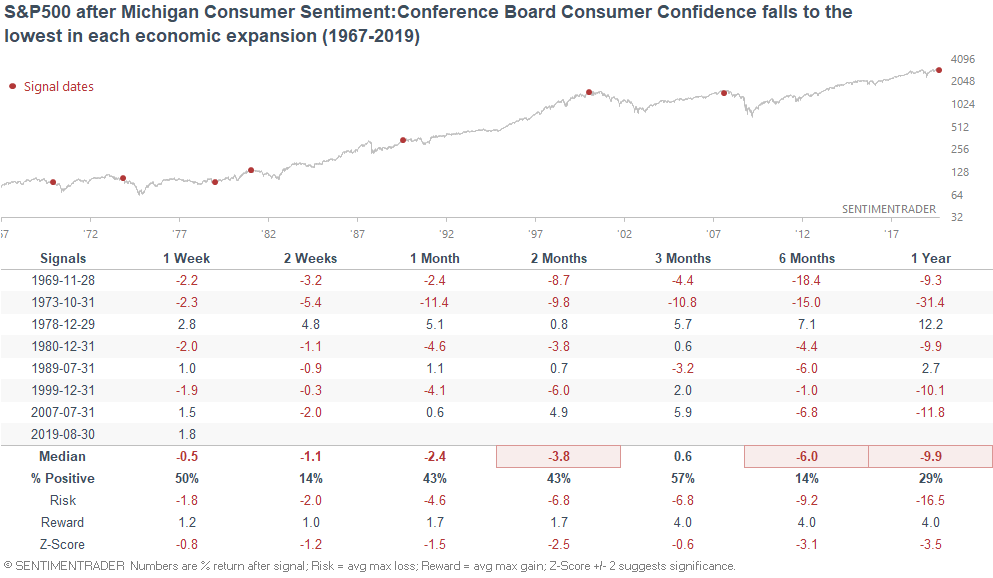
Consumer Confidence
Some market commentators are hoping that a strong consumer can offset weakness in other parts of the U.S. economy (e.g. manufacturing), thereby preventing a recession.
While the ISM Manufacturing PMI has fallen below 50 (i.e. contraction), the Conference Board's Consumer Confidence remains near a high.
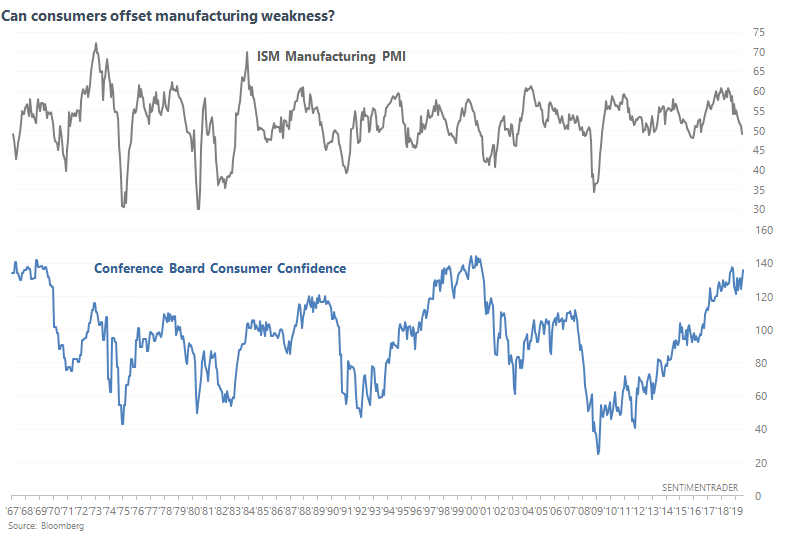
The track record has been mixed. Sometimes this worked, and sometimes it didn't (e.g. August 2000). Here's what happened next to the S&P after the ISM manufacturing PMI fell below 50 while Confidence is within 5% of a 1 year high.