What I'm looking at - rally ahead, new lows breadth, Put/Call, Treasuries
Here’s what I’m looking at:
Rally ahead
The S&P 500 has fallen almost -20% from top to bottom. Even if this is the start of a big -30% to -50% bear market, will the stock market make a tradable bounce from here? I.e. if you go long right now, does risk:reward favor the bullish side of the market?
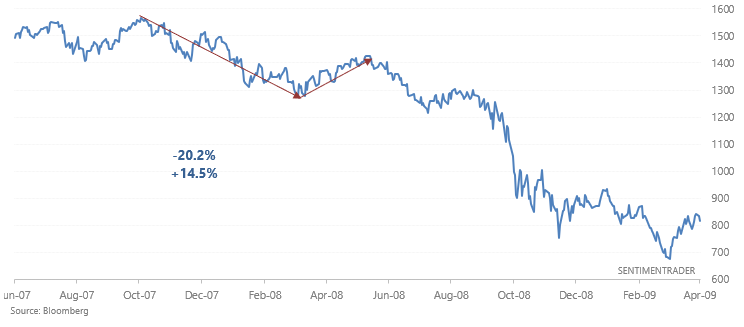
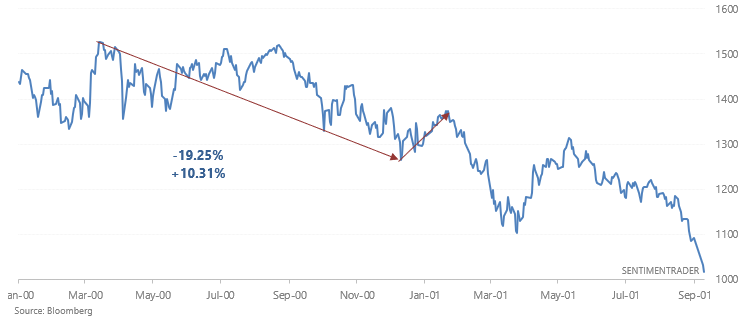
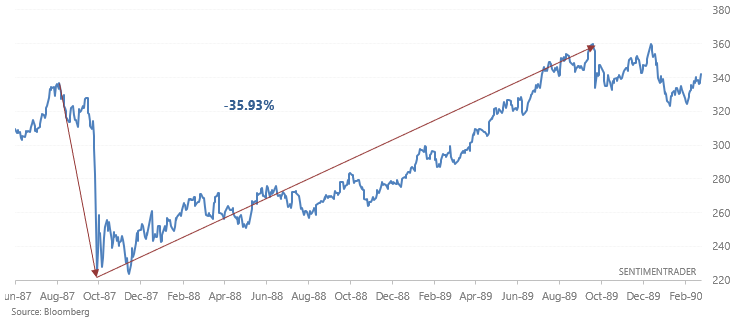
The following charts look at major bear markets and look for the first meaningful bounce after the S&P fell approximately -20%. We'll skip over comparisons between today and e.g. 2011 since historical cases like 2011 were best case scenarios: the market merely made a 20% correction, followed by new all time highs. We're looking at a worst case scenario here.
Here's the 2007-2009 bear market:
Here's the 2000-2002 bear market:
Here's the 1987 stock market crash:
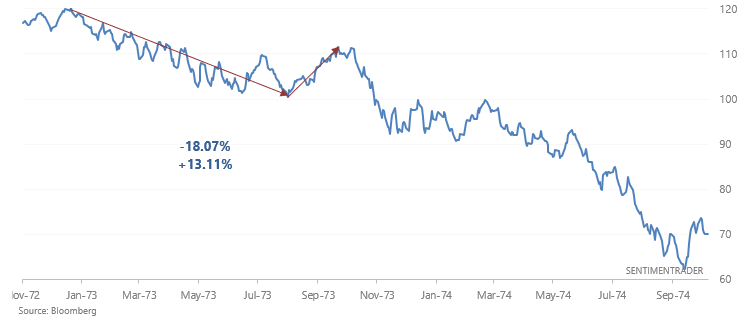
Here's the 1973-1974 bear market:
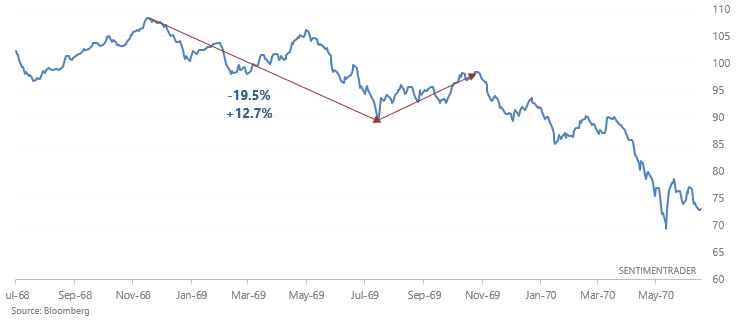
Here's the 1969-1970 bear market:
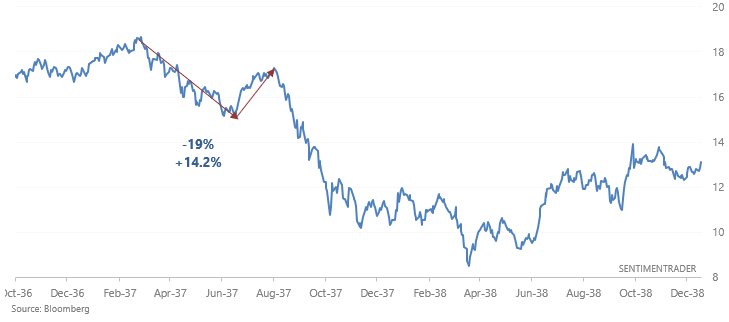
Here's the 1937-1938 bear market:
And finally, here's the 1929-1933 mega-crash:
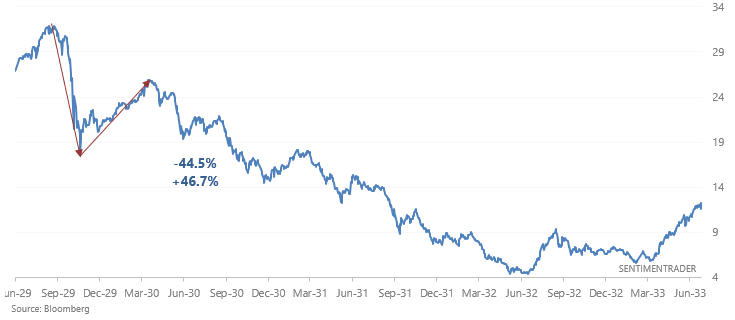
Aside from 1987 and 1929, buying when the S&P fell approximately -20% was the smart thing to do from a risk:reward perspective. In the case of 1929, the stock market crashed further but allowed bulls who bought at -20% to breakeven within 6 months. As for 1987, it's hard to call that a "bear market" since it was very short in terms of time duration and didn't have multiple DOWN waves. Overall, risk:reward favors bulls right now.
New lows breadth
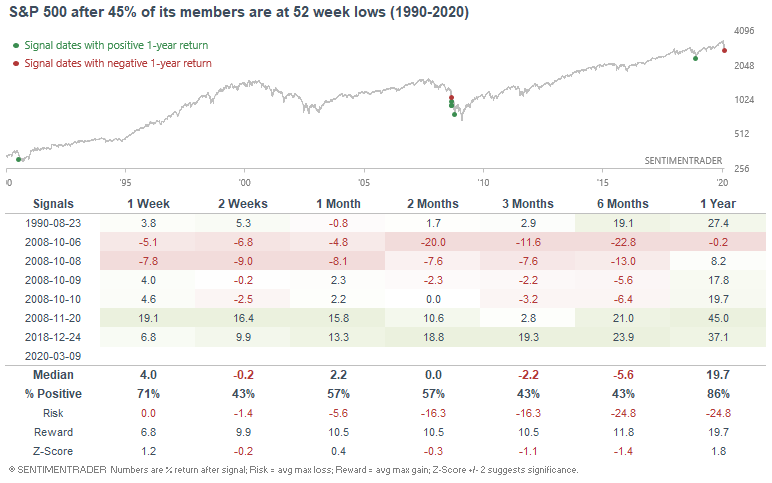
The stock market's collapse on Monday was epic, to say the least. More than 45% of the S&P 500's members are now at 52 week lows, a level that has only been matched several times since 1990.
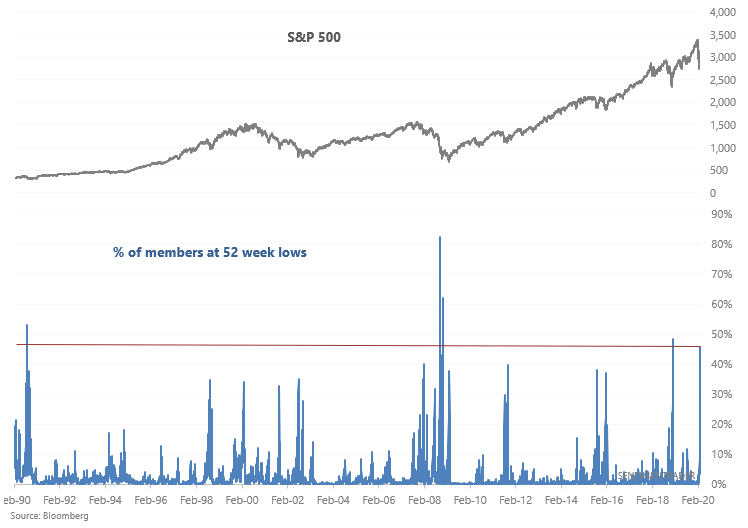
This marked the bottom of the 2018 panic and came close to marking the bottom of the 1990 selloff. But as you would expect, this didn't mean much during the 2008 financial crisis:
We can take an average of the % of S&P 500 members at 52, 24, 12, 8, and 4 week lows to look at new low breadth more holistically:
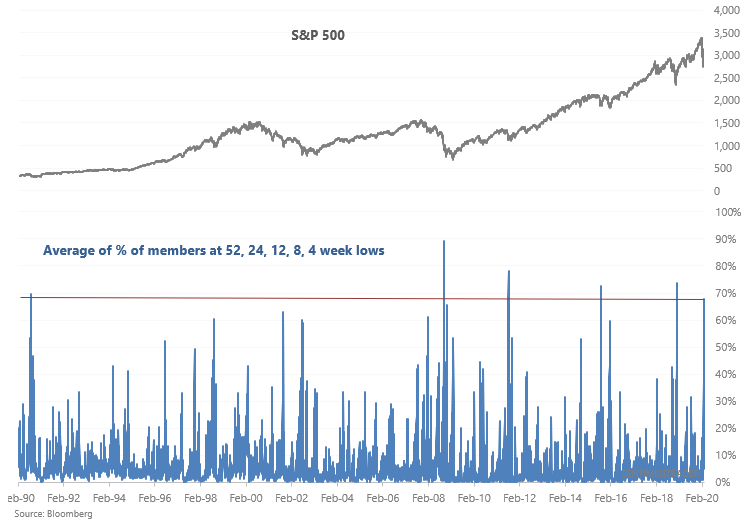
When average new low breadth was above 67% in the past, the S&P's returns over the next 2 months were mixed. This was a bullish sign during the previous two -15% to -20% corrections (2018 and 2015). But in the 2011 correction, the stock market sold off a little further before it bottomed. And of course during the 2008 bear market this was followed by more selling.
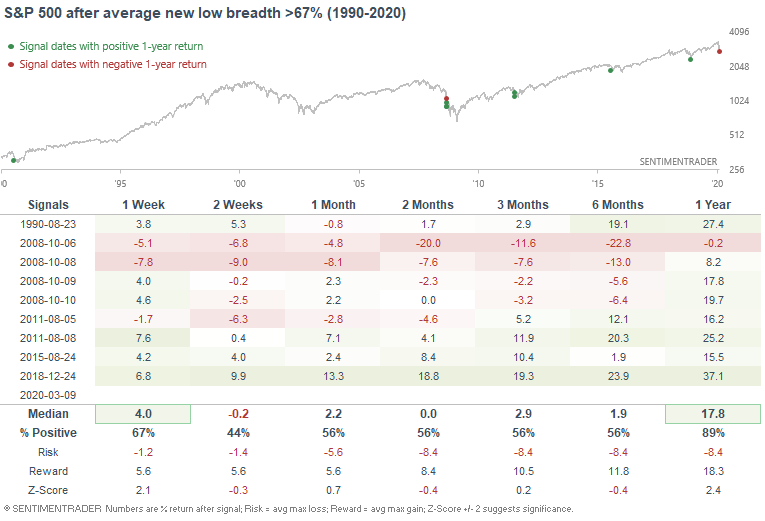
On the positive side, this usually led to a gain over the next year for U.S. equities.
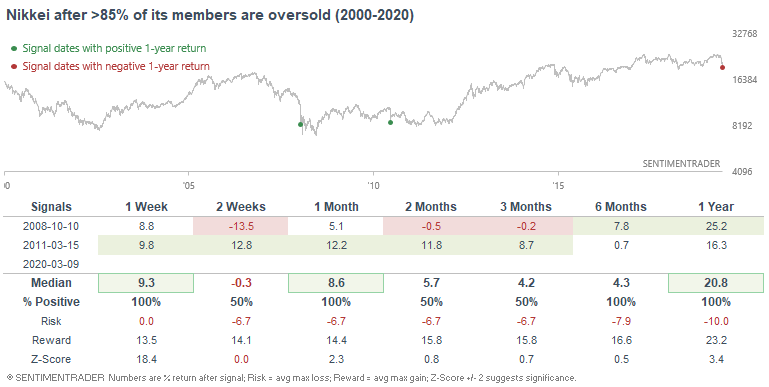
Looking overseas, more than 85% of the Nikkei 225's members are oversold (RSI < 30).
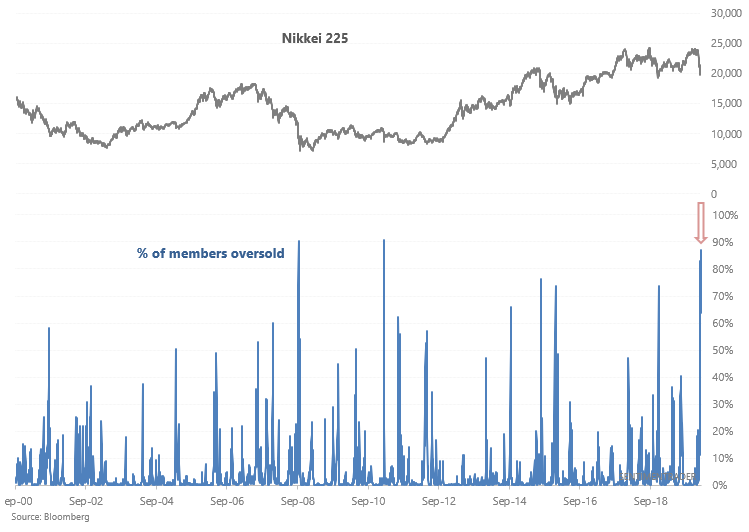
There are only 2 historical cases that were this extreme, and both led to strong rallies over the next few weeks:
Put/Call
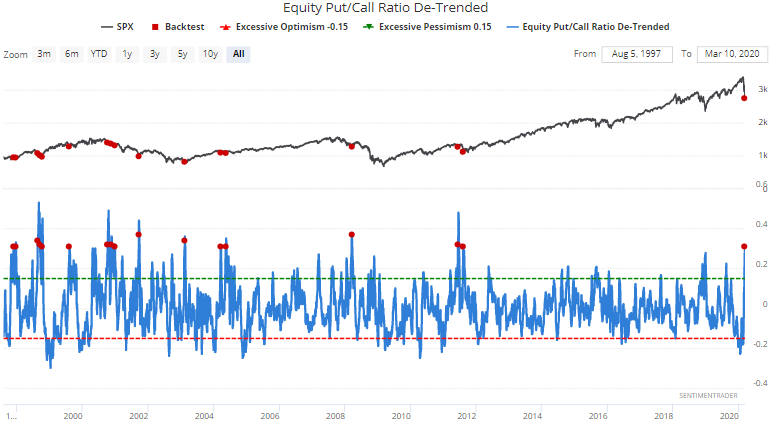
As plenty of market watchers on Twitter have noted, the Put/Call ratio spiked on Monday's stock market crash. Our De-Trended Equity Put/Call ratio is at a level that in the past, usually led to a S&P 500 rally over the next month:
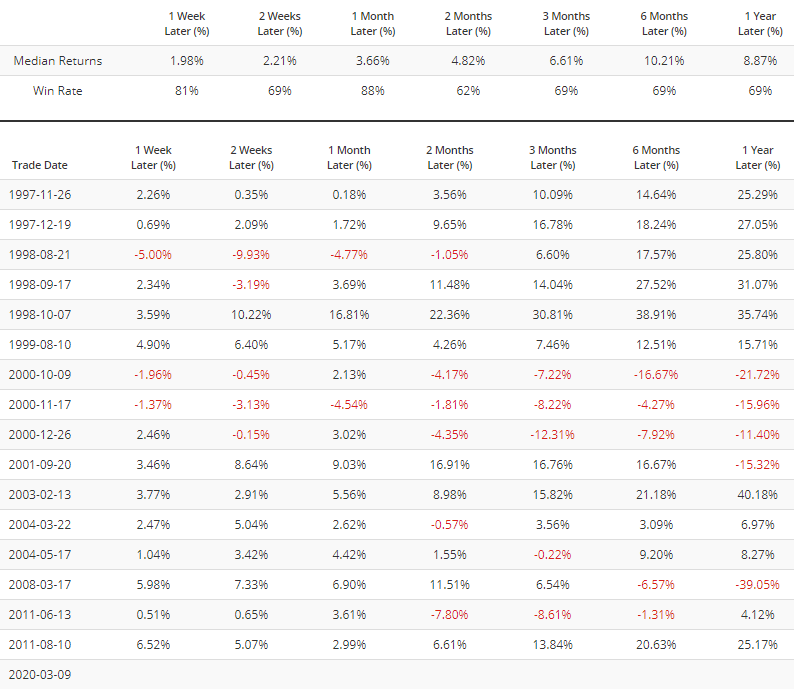
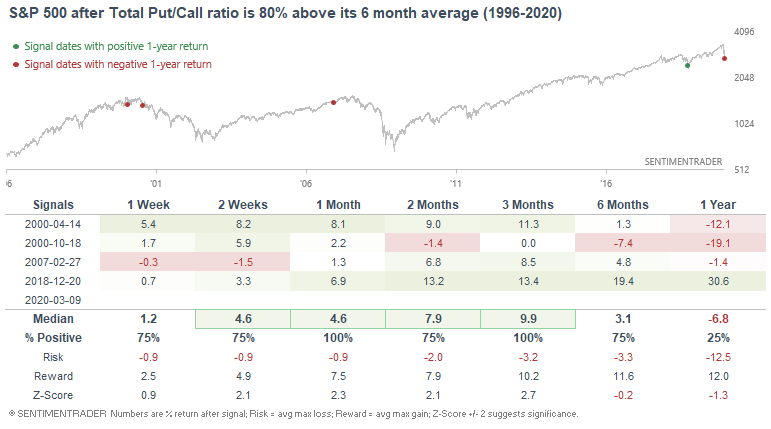
The Total Put/Call ratio is now the most above its 6 month average ever:
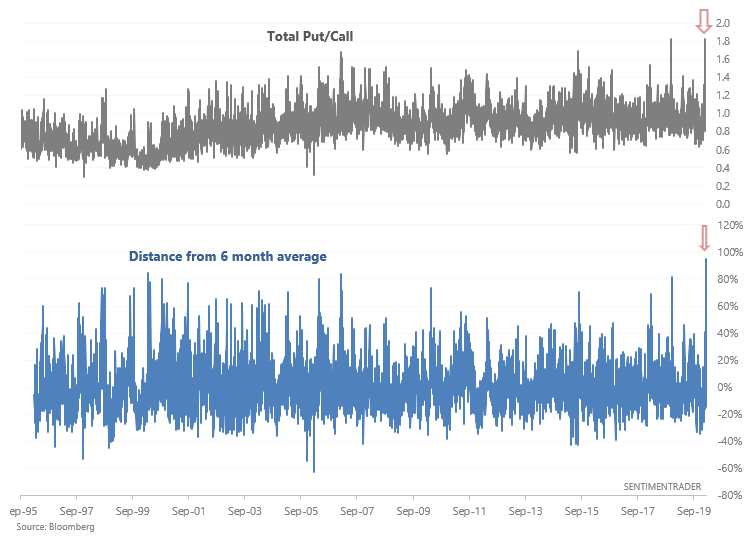
The only few comparable cases saw the S&P 500 rally over the next few weeks and months, even though 2 of these cases (April and October 2000) occurred at the start of a major bear market:
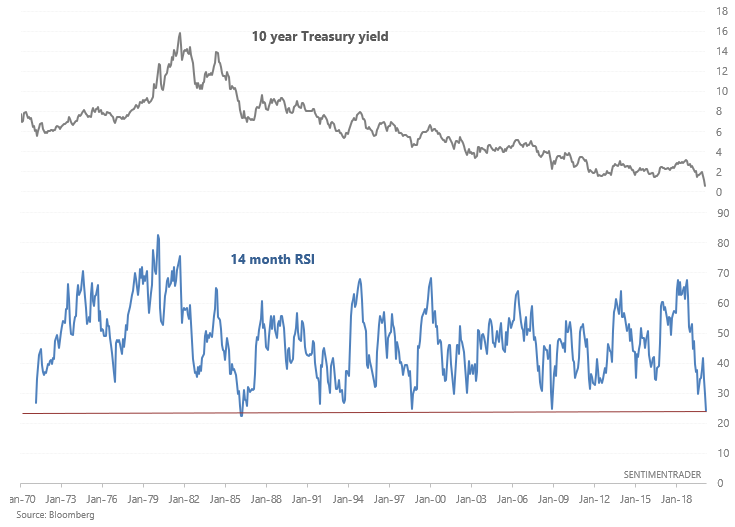
Soaring Treasuries
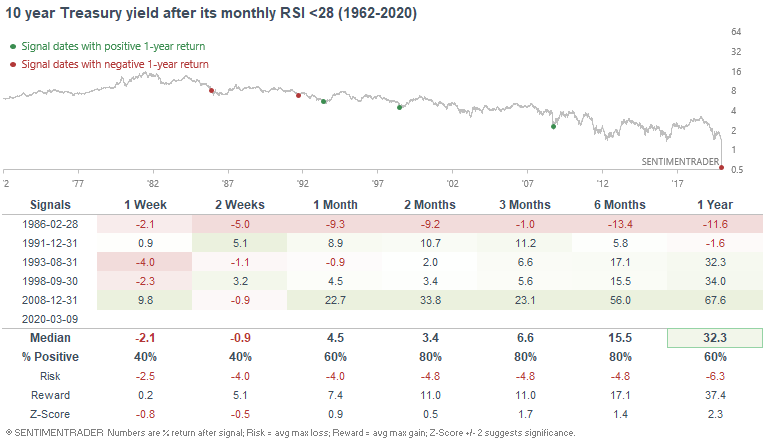
And finally, Treasury yields have completely collapsed. The 10 year Treasury yield's MONTHLY rsi is now at one of the lowest levels ever. Granted, March isn't over. But this still highlights the parabolic surge in Treasury bonds.
When the 10 year Treasury yield's monthly RSI was this low in the past, the S&P rallied over the next year by a median of +23.5%:
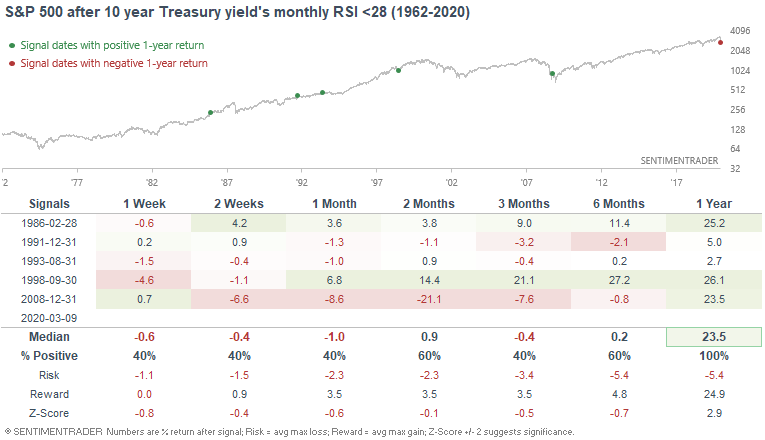
And this was usually bullish for Treasury yields (bearish for bonds) over the next 2+ months:
How I allocate my assets
Instead of sharing how I manage my own trading portfolio, here's how I allocate all my assets for the sake of full transparency. Some of these percentages are approximate, particularly for private assets (since private assets don't have a value on a day to day basis).
- 40% emerging market real estate.
- 20% trading portfolio. My trading portfolio is allocated 50% in the Macro Index Model and 50% in the Simple Trading Model With Fundamentals. Right now I am 25% long stocks and 75% long bonds
- 20% is a buy and hold position for the S&P 500 which I won't sell unless I see better opportunities in private markets. This IS NOT a trading position - here I care about the earnings yield. I expect this portion of the portfolio to see weak returns over the next 5-10 years given that valuations are high (and hence earnings yields are low).
- 20% in short term Treasury bond ETFs. This is a temporary placeholder. When opportunities arise I will sell these cash-like instruments to fund private market investments.
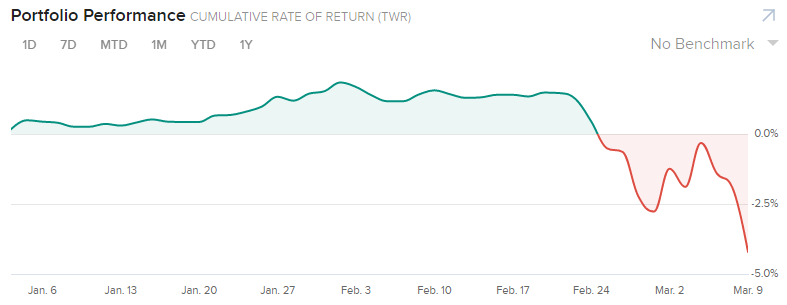
YTD 2020 performance for my public markets portfolio (trading portfolio, buy and hold position, temporary placeholder):
-4.21%