
What I'm looking at - OECD, low volatility, SKEW, Bullish Percent Index, emerging markets
Here's what I'm looking at:
OECD U.S. Composite Leading Indicator
As Willie Delwiche mentioned, the OECD U.S. Composite Leading Indicator continues to sink to levels that were often reached during recessions. This indicator looks at Consumer Confidence, interest rate spreads, new orders, manufacturing, among others. Not surprisingly, manufacturing continues to weigh on this indicator:
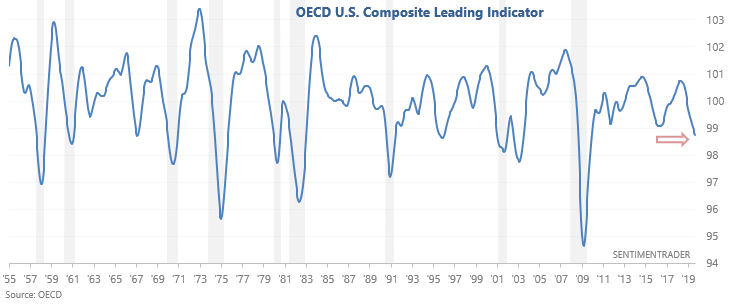
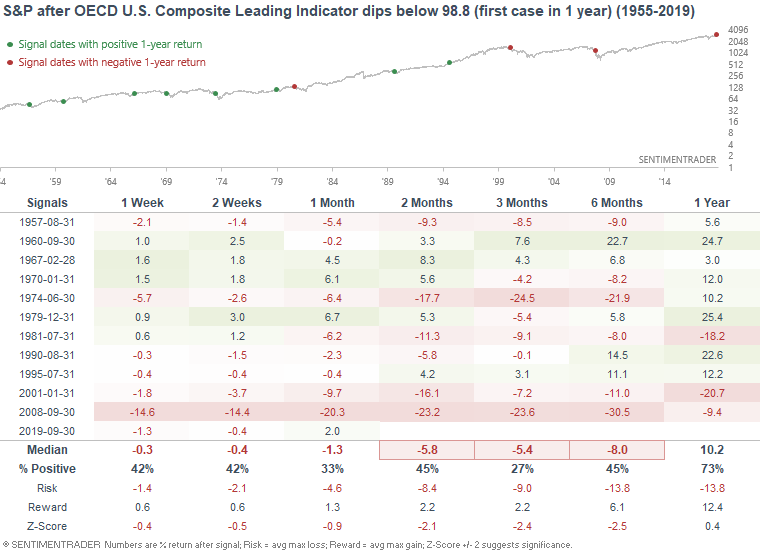
When this indicator fell below 98.8 in the past, the S&P's returns over the next few months were often extremely weak due to the fact that many cases occurred during recessions. There were some exceptions (e.g. 1995), but the recessionary cases far exceeded the non-recessionary cases:
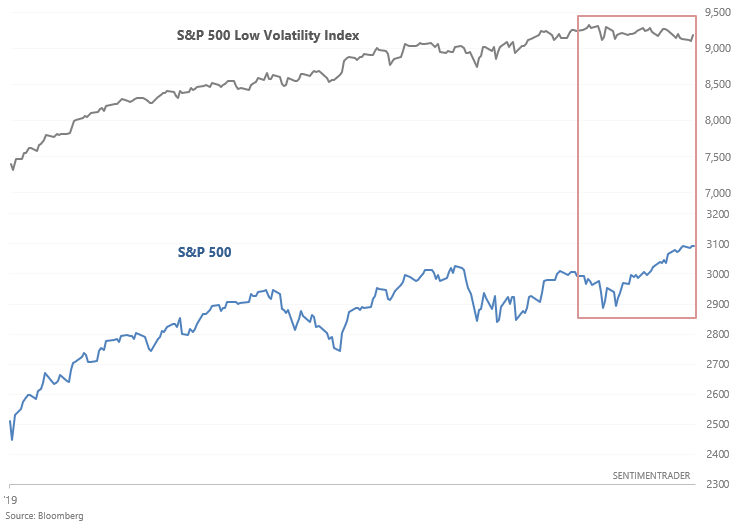
S&P 500 Low Volatility
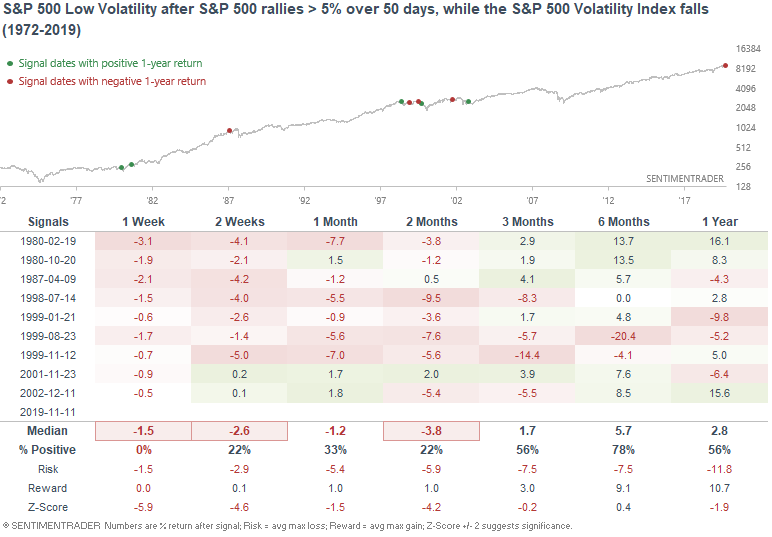
Investors and traders have been shifting away from defensive assets over the past few weeks. As the WSJ noted, the S&P 500 Low Volatility Index (which had rallied nonstop earlier this year) has been stagnant over the past 2 months while the S&P 500 continues to rally.
When the S&P 500 rallies more than 5% over a 50 day period, while the Low Volatility Index falls, the S&P 500 typically does poorly over the next few weeks...
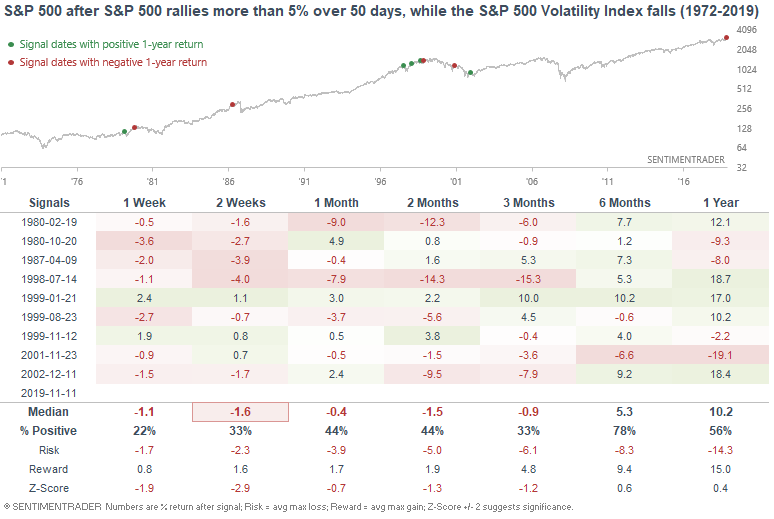
...and so does the Low Volatility Index:
SKEW Index
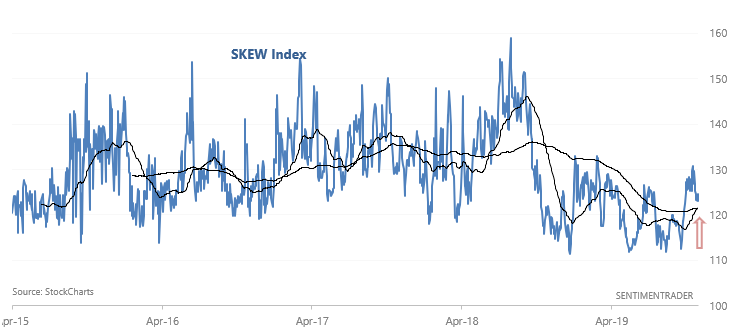
A few weeks ago I mentioned that while high SKEW readings aren't great for stocks, breakouts in SKEW often coincide with breakouts in stocks. With SKEW staying elevated, its 50 dma has risen above its 200 dma for the first time since November 2018:
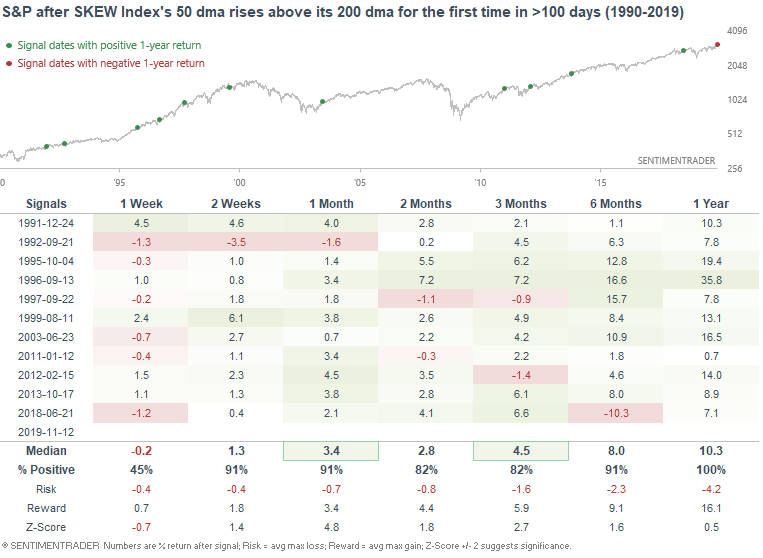
When SKEW's 50 dma rose above its 200 dma for the first time in > 100 days, while the S&P was in an uptrend (> its 200 dma), the S&P typically experienced more gains over the next year:
NYSE Bullish Percent Index
Our recent takes on breadth have mostly been short term negatives for the stock market. Here's another one.
The NYSE Bullish Percent Index (breadth based on point & figure buy signals) has increased to 60% for the first time since May. Since it had been a rather long streak of weakish breadth, but perhaps it is now improving?
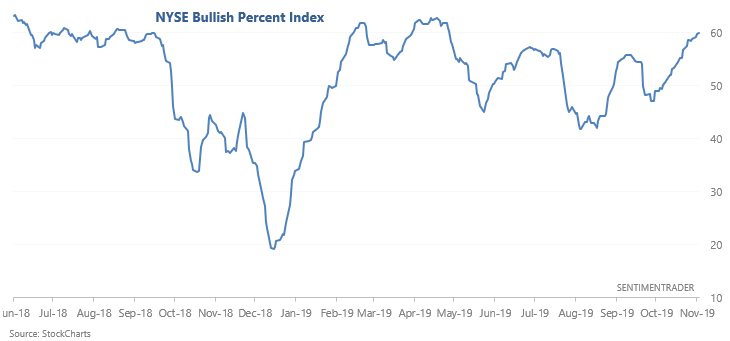
The following table looks at every case in which the NYSE Bullish Percent Index reaches 60% for the first time in more than 6 months.
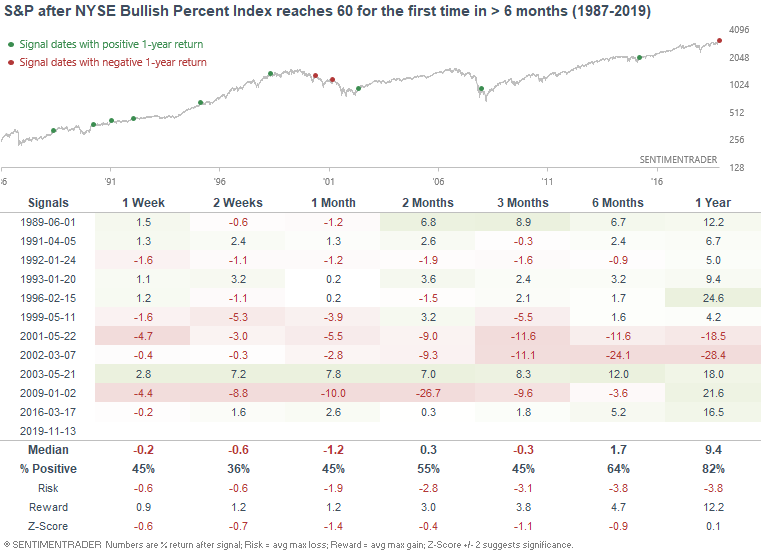
The S&P's returns over the next 2 weeks tend to be weak. 1 year forward returns were mostly bullish, with the exception of cases in 2001 and 2002. However, those 2 environments were very different from today (e.g. far off all-time highs, recession or post-recession, etc).
Emerging markets
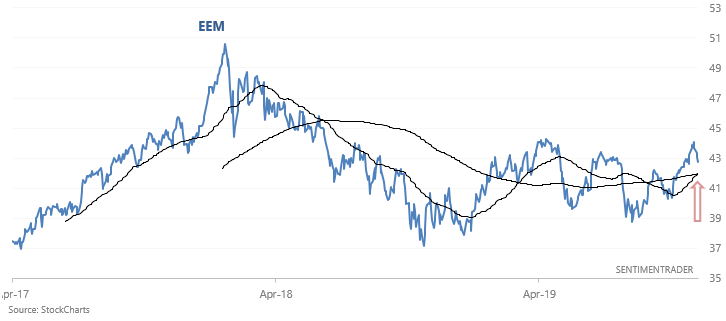
And lastly, EEM (emerging markets) ETF has formed a golden cross (50 dma crossed above 200 dma):
But the history of golden crosses for emerging markets is mixed, particularly over the past 10 years. It hasn't been consistently bullish for emerging markets:
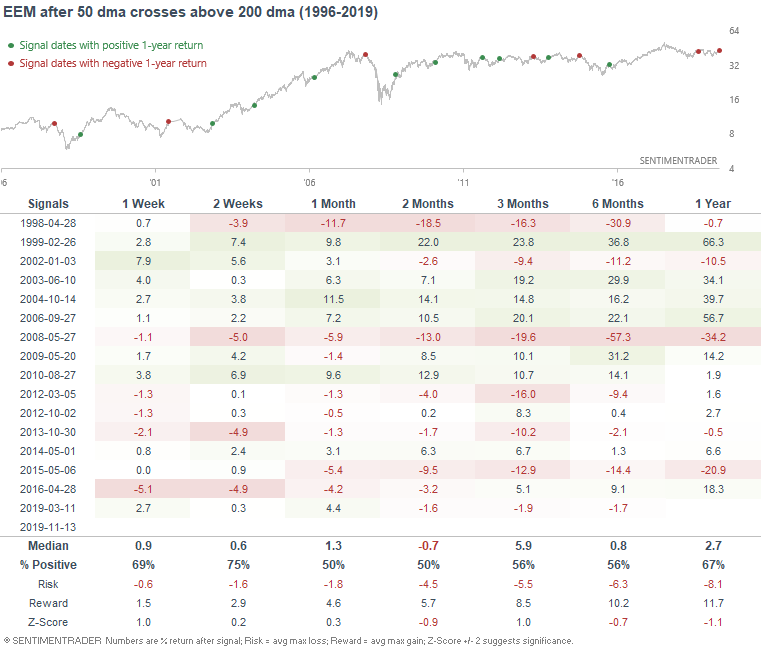
This highlights one of the key problems with price-only trend following. In a choppy market, such a strategy is prone to death by a thousand cuts.