What I'm looking at - New Home Sales, sharp pullback, oversold breadth, safe haven sentiment
Here’s what I’m looking at:
New Home Sales
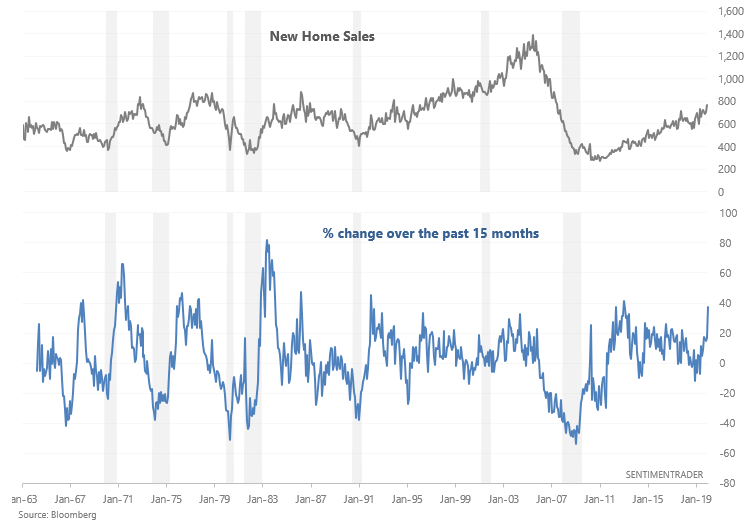
It's important to not forget the bigger picture during stock market pullbacks/corrections such as the one we're experiencing right now. While our prediction that the S&P would make a pullback/correction was correct (the S&P has fallen below the level when we started these predictions), the bigger picture isn't that gloomy. Housing, a key leading sector of the U.S. economy, continues to improve. New Home Sales has risen almost 40% since its low in 2018:
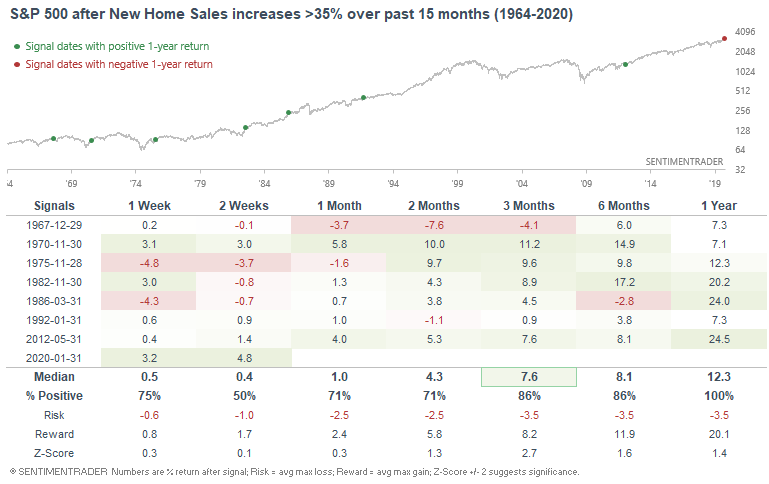
When New Home Sales jumped out of a slump (i.e. New Home Sales slumped in 2018), the S&P's returns over the next year were uniformly positive.
Price Pattern
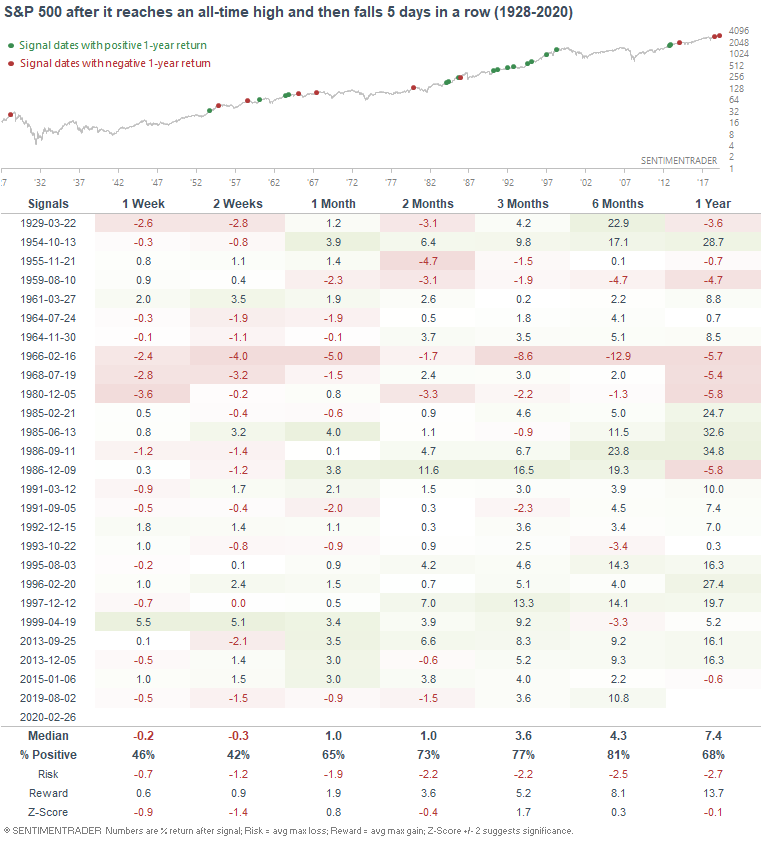
As Ryan Detrick noted, the S&P has fallen 5 days in a row from an all-time high. The pace of this pullback/correction has been rapid, which isn't surprising given the extreme sentiment readings we'd been covering over the past few weeks/months. With that being said, it isn't very common to see such sharp pullbacks. Historically, this was slightly more bullish than random for the S&P over the next 3 months:
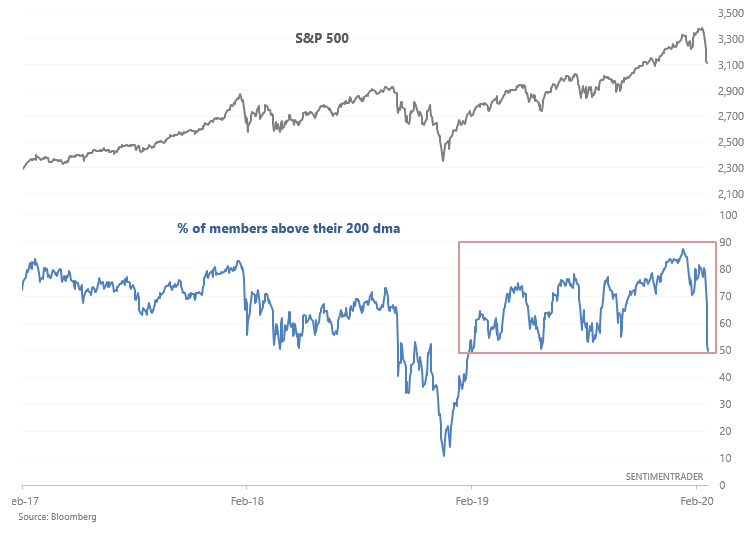
With that being said, there's no guarantee where the market's short term bottom is. The short term is always extremely hard to predict (although "predictions" tend to be perfect with 20/20 hindsight bias!). Fewer than 50% of the S&P 500's members are above their 200 day averages for the first time in more than a year:
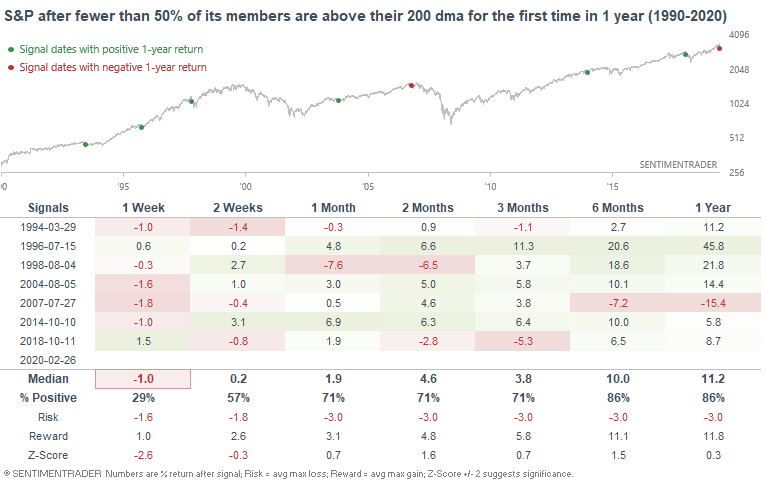
When such long uptrends were broken, the S&P often faced weakness over the next week:
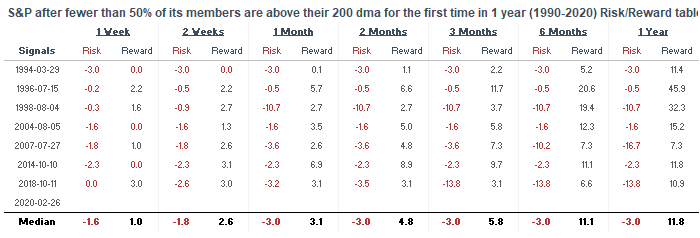
Here's the risk:reward table:
Breadth
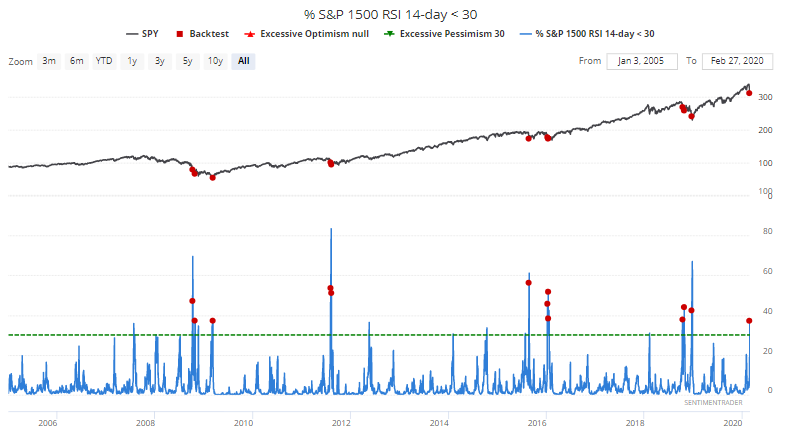
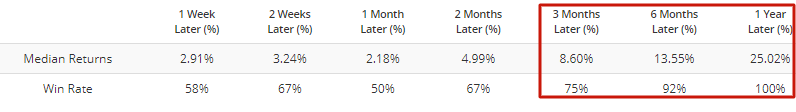
Wednesday's selling pushed more than 37% of the S&P 1500's members into oversold territory (defined as RSI < 30). When there was such widespread selling in the past, the S&P's short term returns varied significantly. Some cases saw the S&P rebound immediately, whereas other cases saw the S&P fall even more in the short term. But this was mostly bullish from a 3-12 month forward perspective:
Sentiment
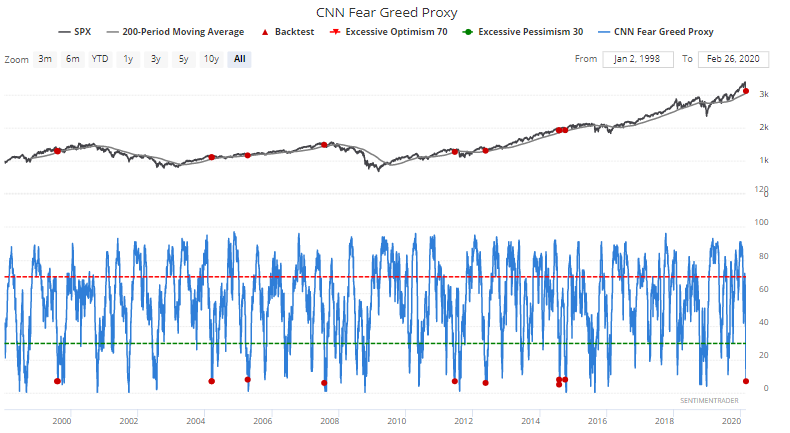
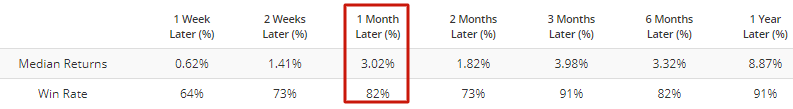
Our proxy for the CNN Fear Greed Index is now at 7, even though the S&P is still above its 200 day moving average. This usually led to a bounce for the S&P over the next month:
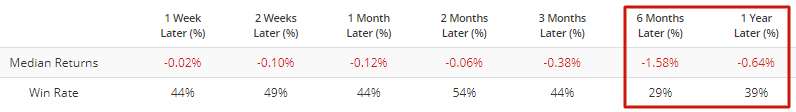
Safe haven
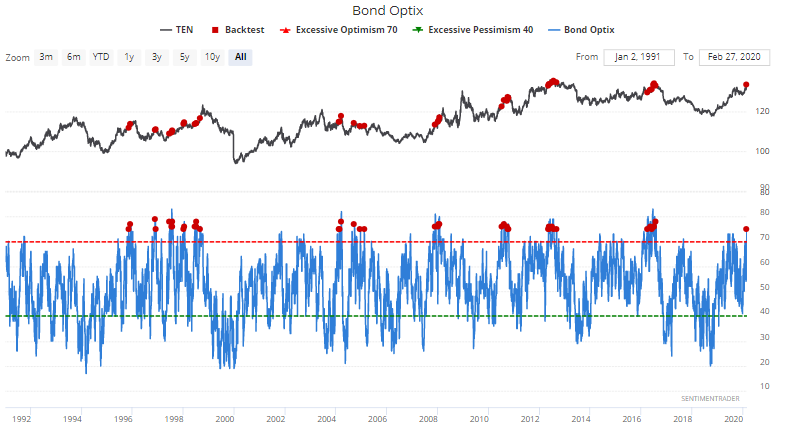
And lastly, the stock market's selloff has led to investors and traders charging headlong into bonds, pushing Bond Optix to 75. When investors were this optimistic towards bonds in the past, it wasn't a guarantee that bonds would drop immediately. But on a 6 month forward time frame, bonds' performance was worse than random:
How I allocate my assets
Instead of sharing how I manage my own trading portfolio, here's how I allocate all my assets for the sake of full transparency. Some of these percentages are approximate, particularly for private assets (since private assets don't have a value on a day to day basis).
- 40% emerging market real estate.
- 20% trading portfolio. My trading portfolio is allocated 50% in the Macro Index Model and 50% in the Simple Trading Model With Fundamentals. Right now I am 25% long stocks and 75% long bonds.
- 20% is a buy and hold position for the S&P 500 which I won't sell unless I see better opportunities in private markets. This IS NOT a trading position - here I care about the earnings yield. I expect this portion of the portfolio to see weak returns over the next 5-10 years given that valuations are high (and hence earnings yields are low).
- 20% in short term Treasury bond ETFs. This is a temporary placeholder. When opportunities arise I will sell these cash-like instruments to fund private market investments.
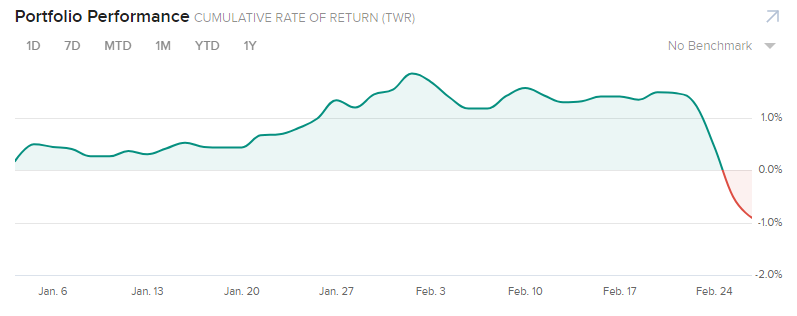
YTD 2020 performance for my public markets portfolio (trading portfolio, buy and hold position, temporary placeholder):
-0.91%