
What I'm looking at - new highs, smart money/dumb money, emerging markets, optimism, bond Optix
Here's what I'm looking at:
New highs
As the S&P continues to trend higher, there has been a spike in new 52 week highs relative to new 52 week lows. The following chart looks at NYSE New Highs / NYSE New Lows, which has spiked to the highest level since February, just as stocks were taking off:
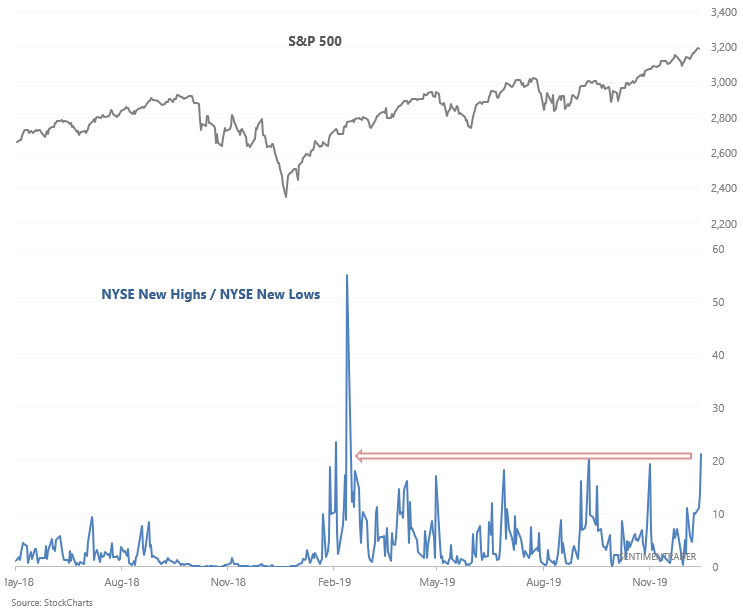
When new highs relative to new lows spiked to the highest level in 200 days, the S&P's returns over the next several months and year were typically bullish.
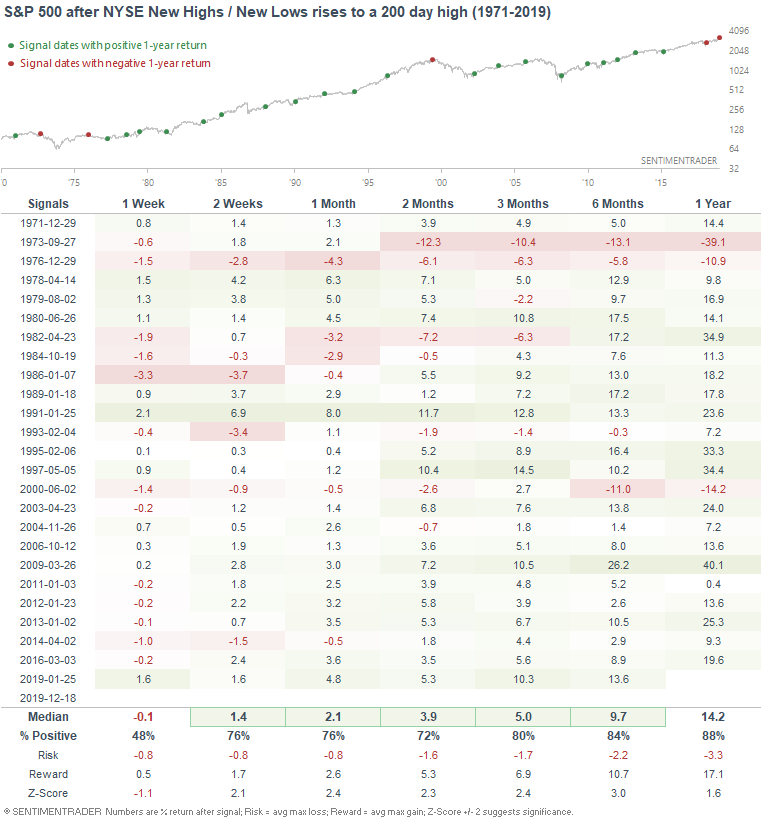
In the face of very high sentiment, I wouldn't consider this to be a short term positive for stocks. But it is a positive factor for stocks over the next 6-12 months.
Smart Money/Dumb Money
One of our subscribers asked "is it normal for the Smart Money/Dumb Money Confidence Spread to remain this wide for this long?"
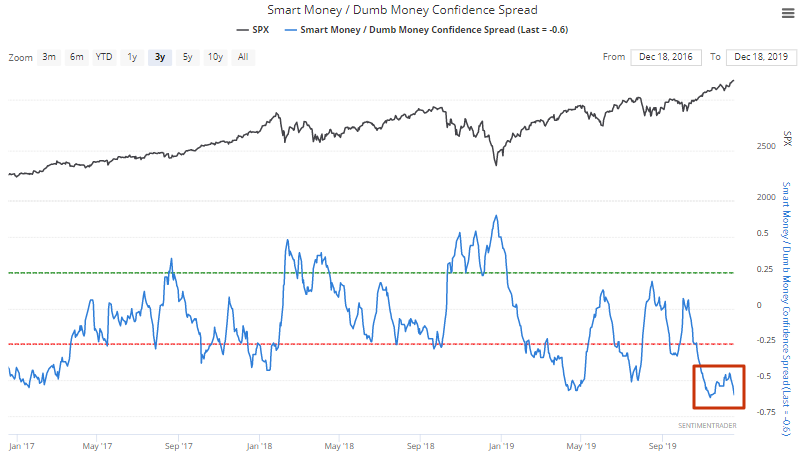
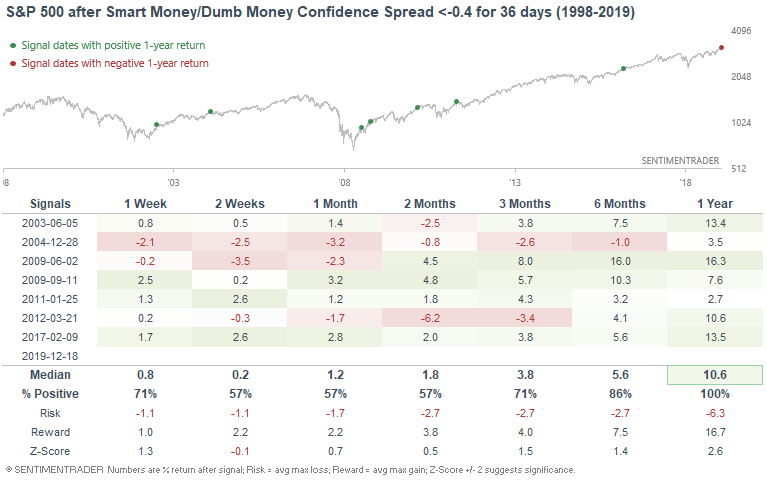
To answer this question, we can look at all the cases in which the spread was below -0.4 for 36 days. Historically, this led to mixed returns over the next 1-2 months. But beyond that, this was bullish for stocks over the next 6-12 months. Excessively optimistic sentiment readings tend to occur during bull market rallies and not bear market rallies.
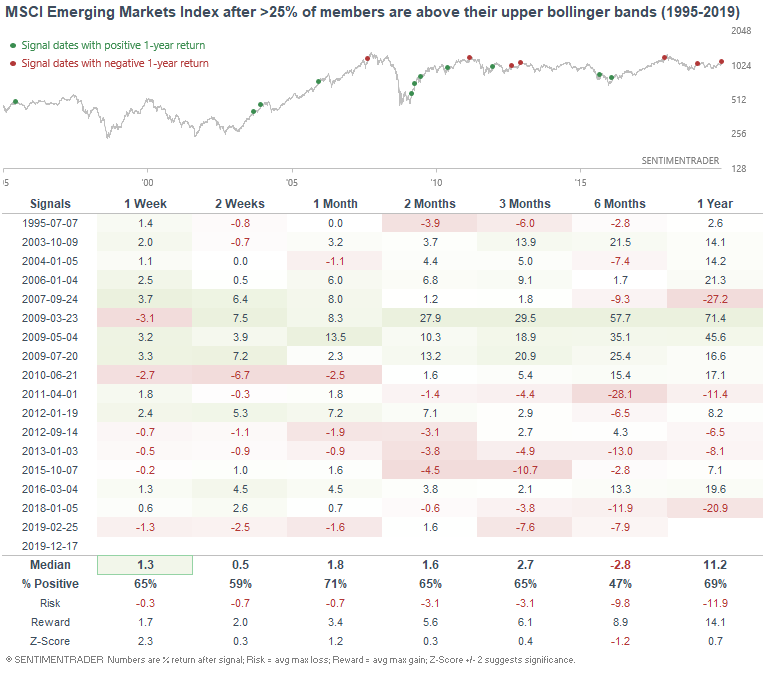
Emerging markets spike
Emerging markets have been on a tear recently. The % of MSCI Emerging Markets Index members above their upper Bollinger Band recently exceeded 25%:
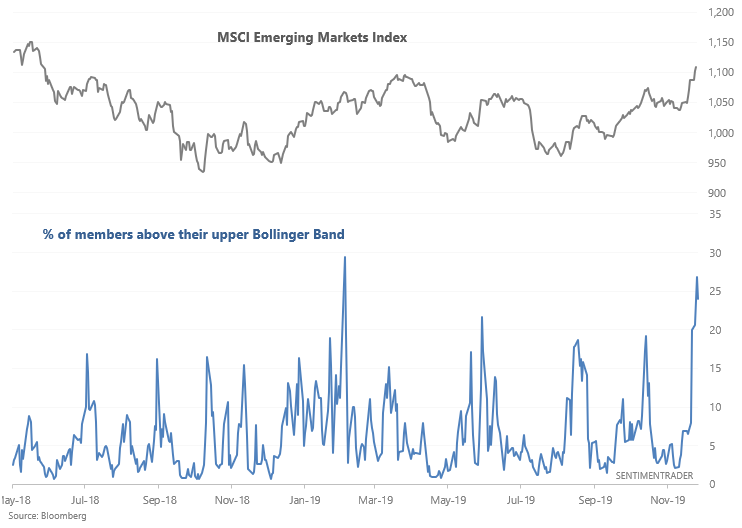
While this may have slowed down emerging markets 3-6 months later, it didn't always lead to short term bearishness. It sometimes led to an extension of the rally over the next week, after which the MSCI Emerging Markets Index made a pullback.
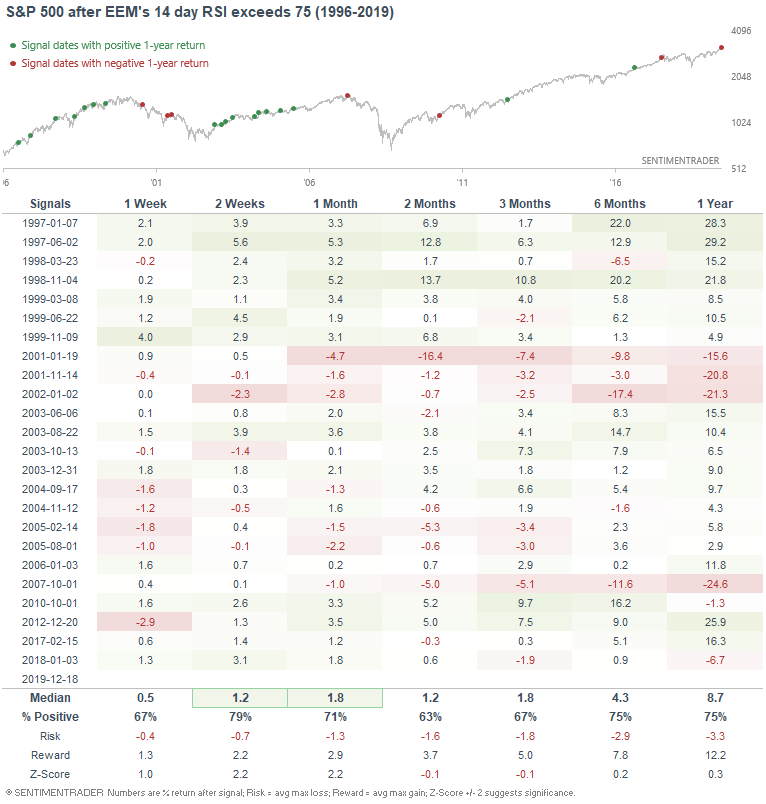
In a similar vein, EEM's 14 day RSI is quite high:
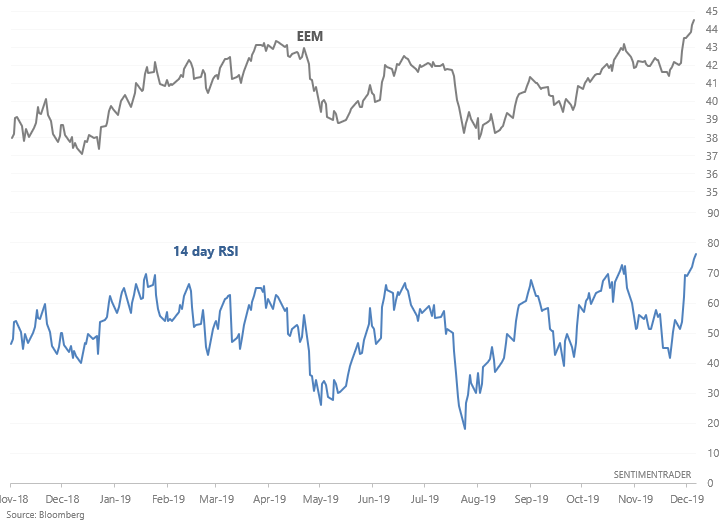
When EEM's momentum was this high in the past, it didn't usually peak immediately. More often than not it continued to rally over the next 2 weeks:
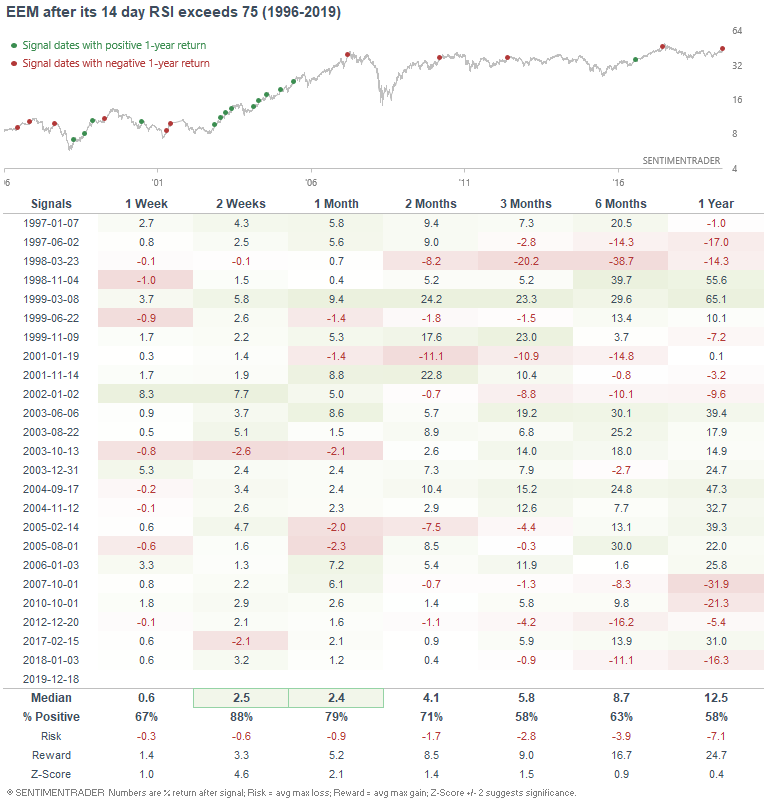
For what it's worth, here's what the S&P 500 did next:
Optimism
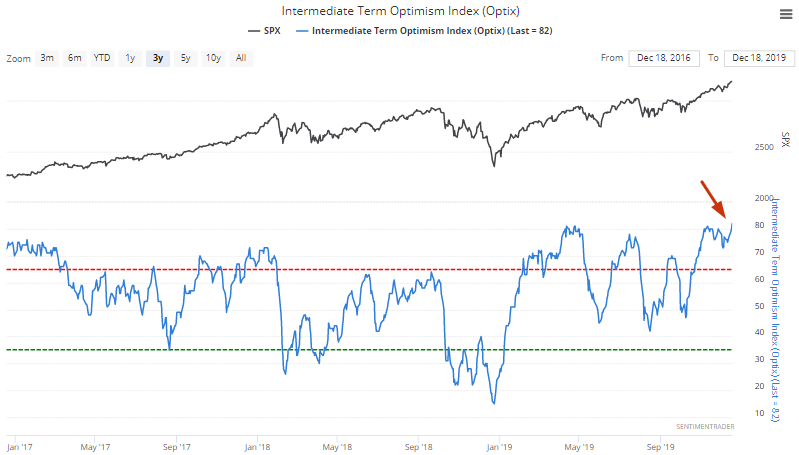
Our Intermediate Term Optimism Index is now at its highest level in years. At this point, most of our sentiment indicators are demonstrating excessive optimism:
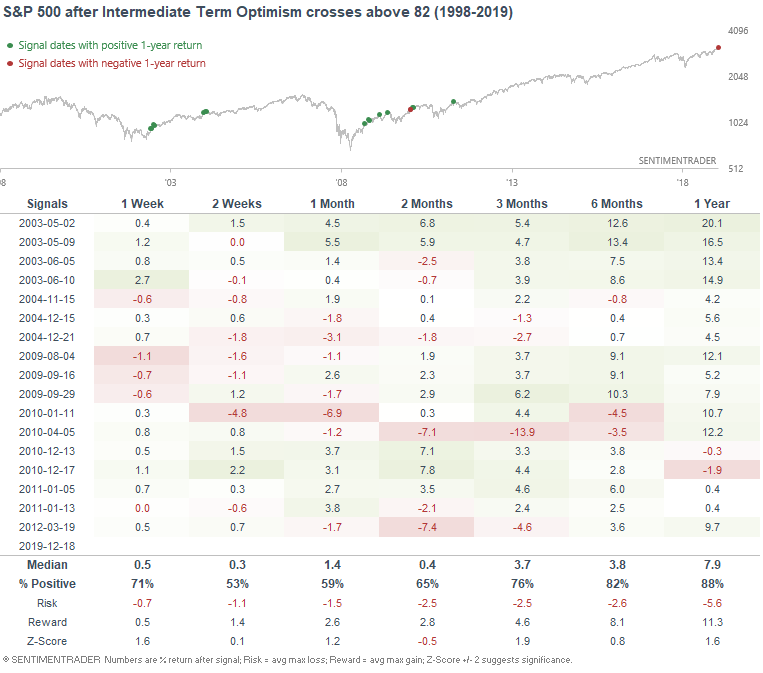
When the Intermediate Term Optimism Index crossed above 82, the S&P's median returns over the next 2 months were below average, even though most of the 1 year forward returns were bullish:
Bonds
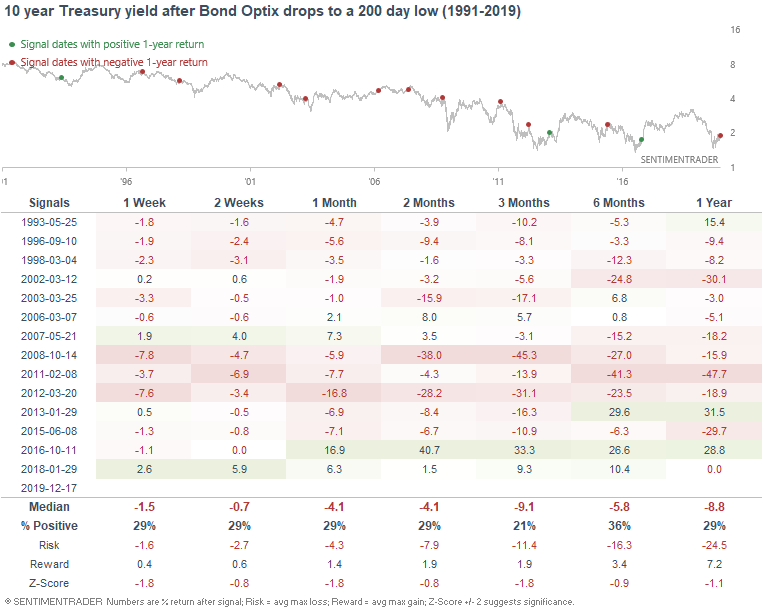
Amidst the recent pullback in bonds, their Optix has fallen to the lowest level in more than 200 days:
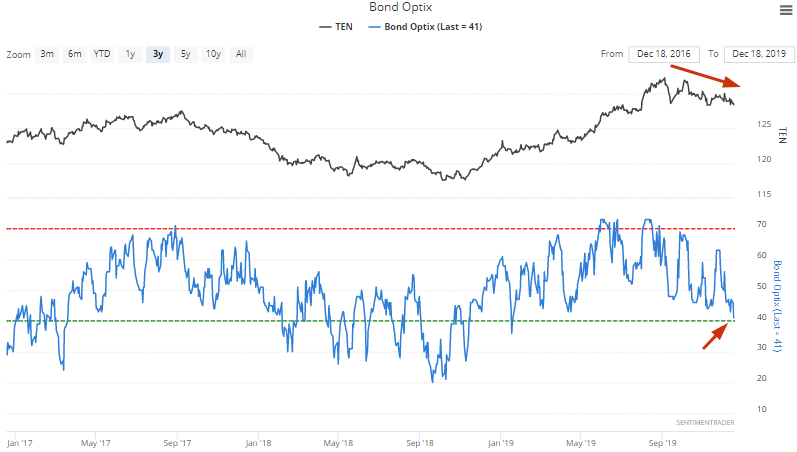
When this happened in the past, the 10 year Treasury yield usually fell over the coming weeks and months:
My trading portfolio
I've been moving countries and changing residencies over the past half year, so I haven't done much trading up until a month ago. Now that I've settled down, I've reopened trading accounts. In the interest of transparency, I'm going to show you what my own trading portfolio is doing, similar to what Jason does.
From October 25 (when I started to trade again) - present:
- My account is up 2.34%
- Currently 100% in bonds
I don't place discretionary trades - these are purely based on my quantitative models.