What I'm looking at - new highs, job openings, VIX, economic surprise
Here's what I'm looking at:
New highs
The U.S. stock market continues to make new highs, with tech stocks leading the way. As a result, the % of NYSE issues making new highs has risen to the highest level in more than 2 years (since January 2018).
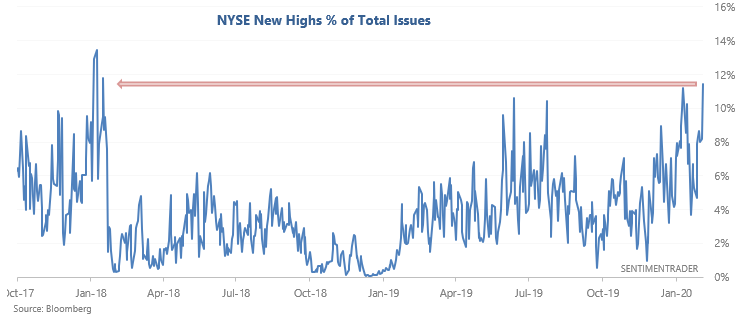
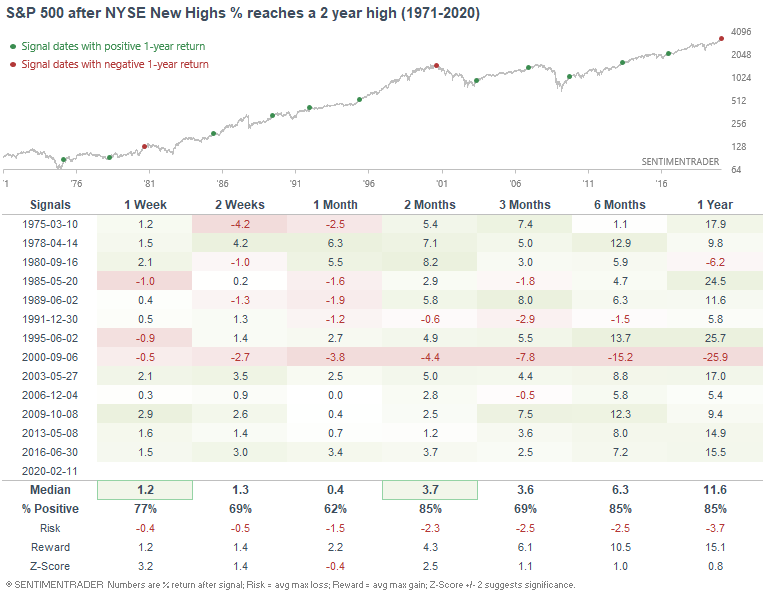
When New Highs % surged to the highest level in 2 years, it usually led to more gains for equities over the next 2 months. This is another example of the market's strong momentum, which thusfar has won out over sentiment:
Job Openings
As the WSJ noted, U.S. Job Openings have plunged -13% over the past 2 months. "This is reminiscent of 2008" *insert scary music*.
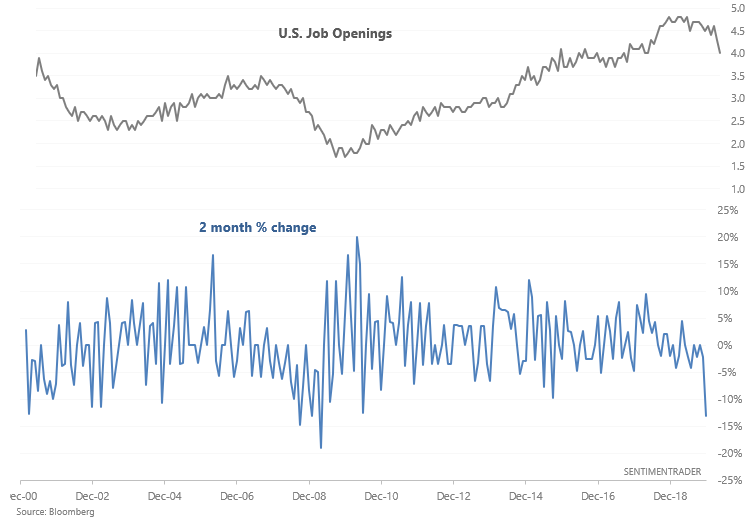
All jokes aside, this did happen around the previous 2 bear markets (2001-2002 and 2008-2009). However, it wasn't a consistently bearish sign since it sometimes happened at the END of a recession/bear market.
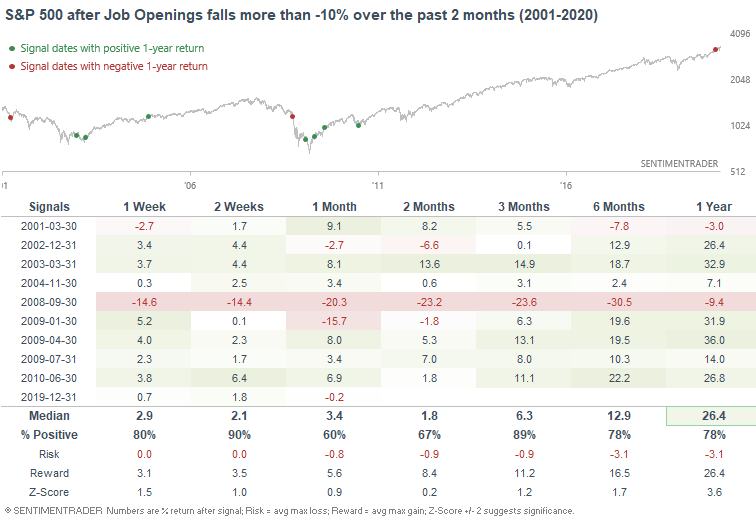
Overall, I'm not too concerned about recent weakness in U.S. Job Openings:
- The economic data series only goes back to December 2000, so the historical data is limited. We don't know how this indicator performed before the prior 2 recessions. Only comparing the "upcoming recession" to the last 2 recessions is recency bias.
- The Unemployment Rate is more useful for long term market timing than Job Openings. And right now, the Unemployment Rate is still a bullish factor for stocks.
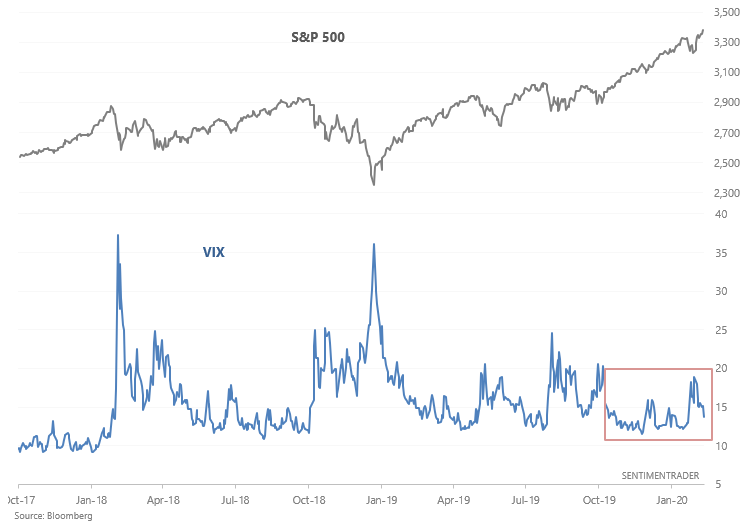
VIX
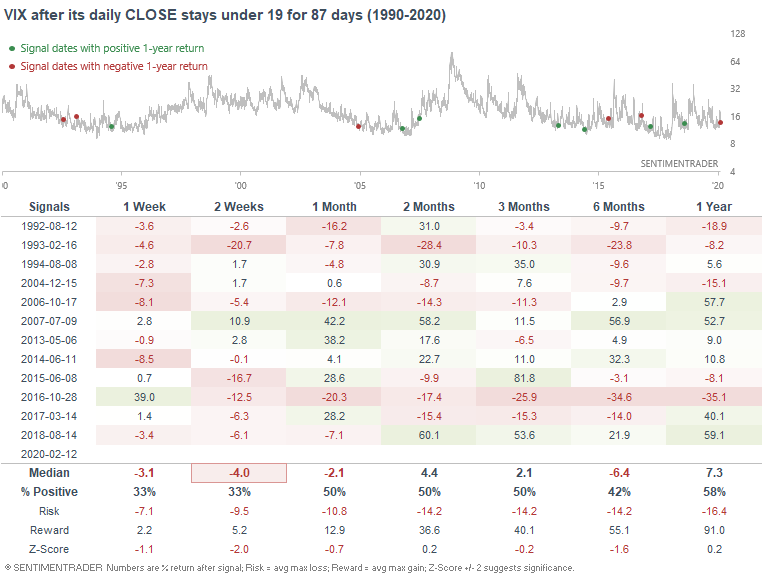
Mirroring the stock market's incessant rally is VIX's consistent inability to spike. Sure, VIX spiked a little during the stock market's recent -3% pullback, but that "spike" was nothing like the spikes of 2018 or even last year. So while the stock market has rallied, VIX has remained below 19 for 87 days (on a daily CLOSE $ basis):
When VIX's volatility was low for a long time, it wasn't consistently bullish for VIX. VIX "eventually" spiked, but it's hard to pinpoint WHEN it spiked.
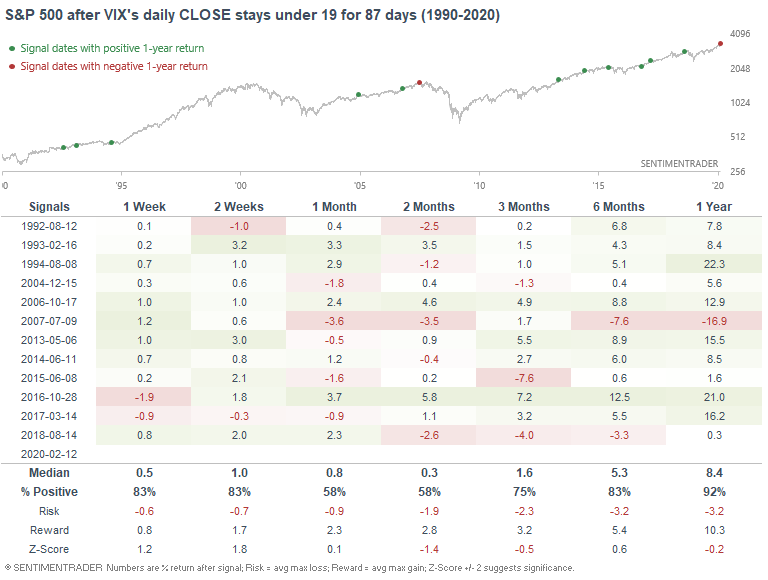
And in another example of momentum, this didn't usually lead to losses for the S&P over the next 2 weeks, although the stock market did often experience weakness over the next 2 months:
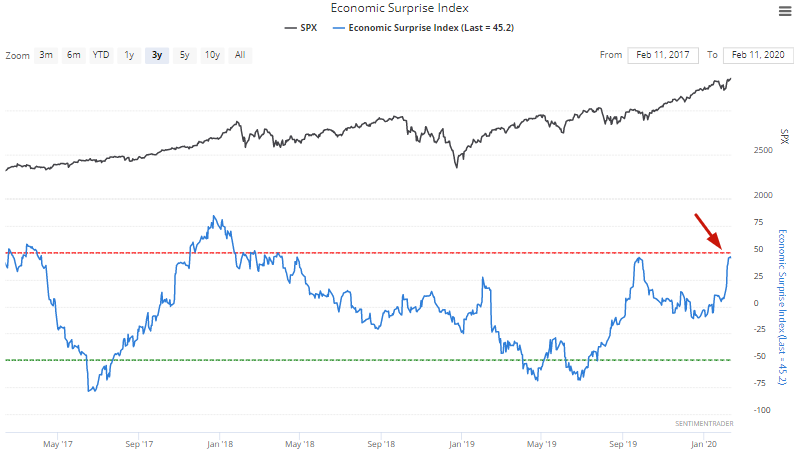
Citigroup Economic Surprise Index
And finally, the Citigroup Economic Surprise Index recently increased to the highest level since mid-2018:
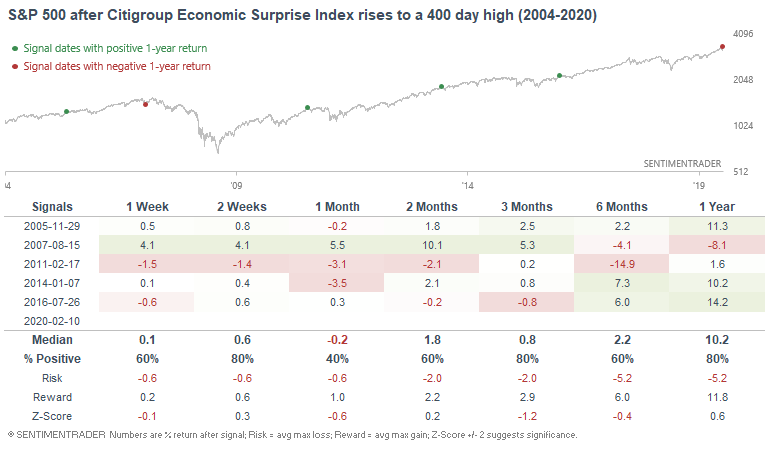
The few other times the Citigroup Economic Surprise Index made a 400 day high, the S&P's returns over the next month were weak:
My trading portfolio
My trading portfolio is allocated 50% in the Macro Index Model and 50% in the Simple Trading Model With Fundamentals. At the moment I have instituted a discretionary override and gone 100% long bonds (instead of long stocks) due to the extreme nature of many of our core indicators, even though some of these core indicators aren't in the models.
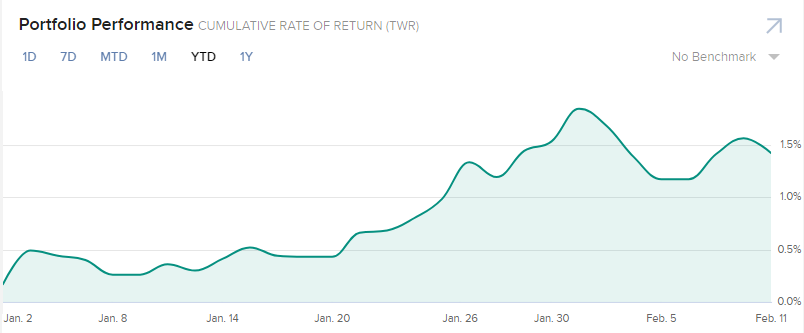
Performance YTD 2020:
- My trading account is up 1.42%
- Currently 100% in bonds