
What I'm looking at: National Activity Index, SPY breadth, short term breakout, bond yields, Ifo
The stock market remains volatile within a narrow range. Here's what I'm looking at.
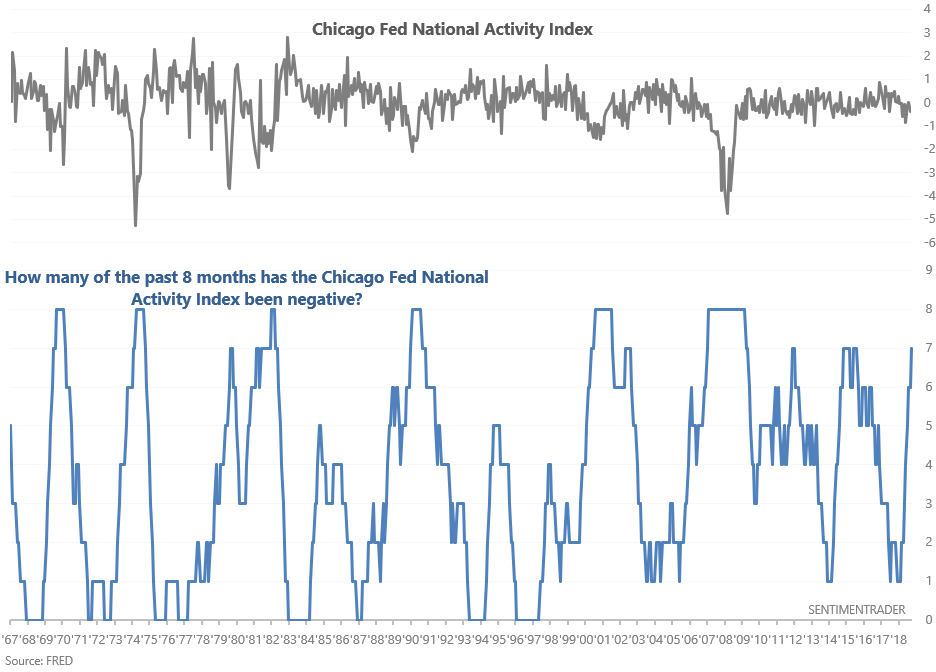
Chicago Fed National Activity Index
The Chicago Fed publishes a National Activity Index that gauges whether the national economy is growing above or below its average historical rate. Readings > 0 indicate above-average growth, whereas readings < 0 indicate below-average growth.
This index has been negative for 7 of the past 8 months.
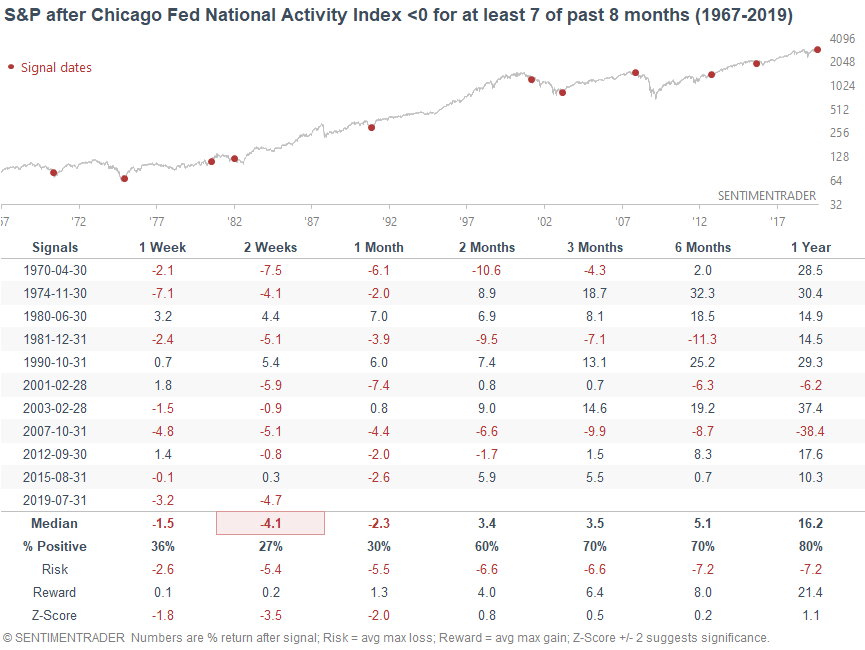
From 1967-2008, readings of ">= 7" (at least 7 of the past 8 months with the National Activity Index < 0) mostly coincided with recessions. But from 2008-present, many readings of ">=7" were merely growth scares. This illustrates a new norm with the current economic expansion - the expansion is weaker than past expansions.
Either way, this hasn't been consistently bearish for stocks in the past over the next 6-12 months. Even when it did happen in recessions, it sometimes occurred at the end of a recession and bear market.
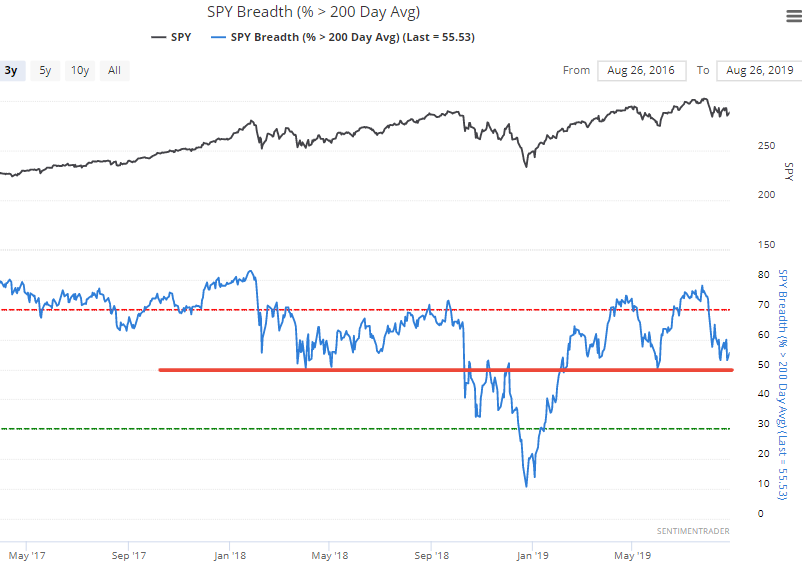
Breadth
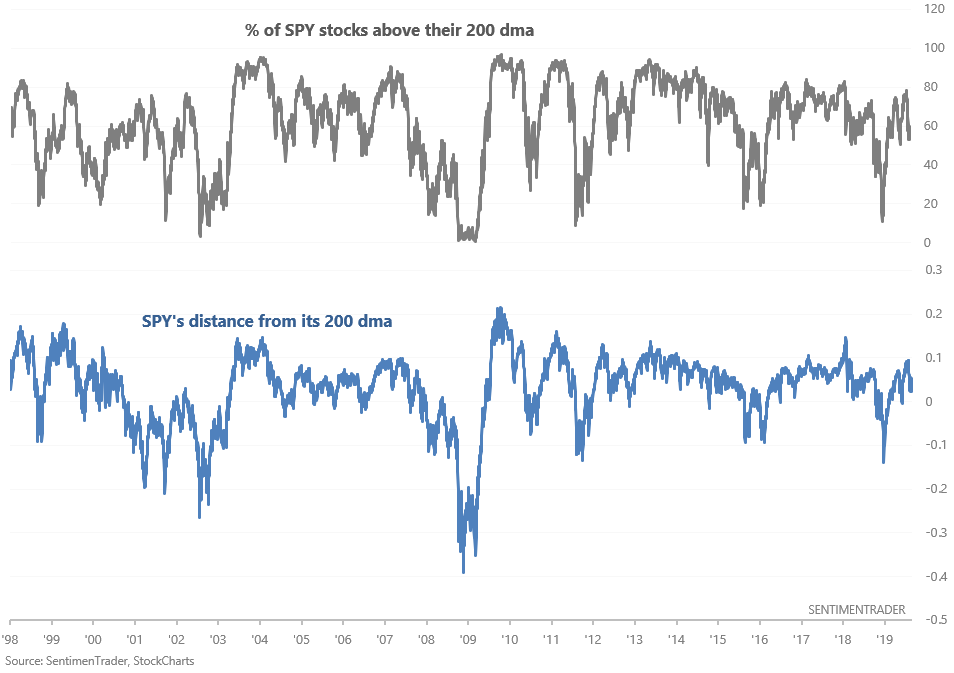
The % of S&P (or SPY) stocks above their 200 dma hovers just above 50% right now.
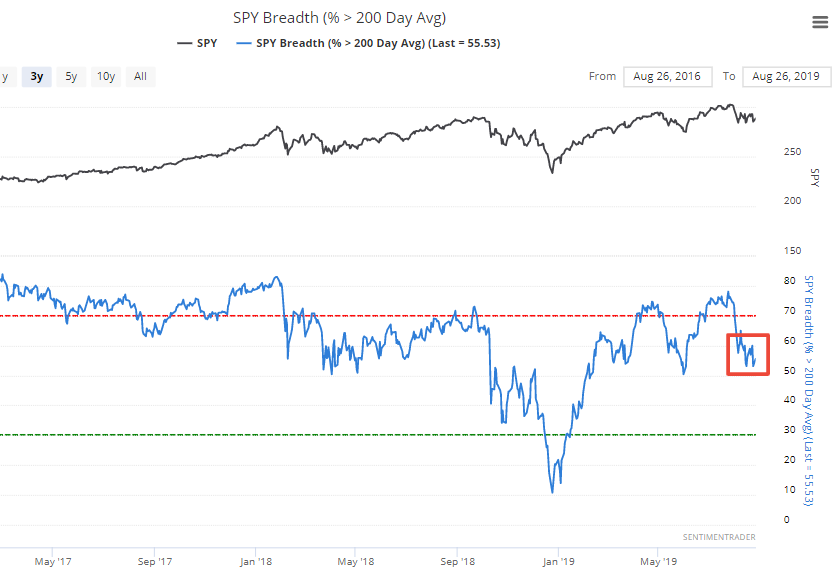
Many market observers have noted that over the past 2 years, 50 seems to have been an important area of support. I.e. when the % of S&P (or SPY) stocks above their 200 dma fell below 50%, bad things happened (e.g. October-December 2018).
In my opinion, this is slightly inaccurate. Here's what happened next to the S&P when the % of SPY stocks above their 200 dma fell below 50%.
As you can see, this was more bearish than random over the next 6 months, but wasn't consistently bearish. The problem with this indicator is that it mostly mirrors the S&P's (or SPY's) distance from its 200 dma. I.e. the more S&P stocks that are above their 200 dma, the higher the S&P will be from its 200 dma. The fewer S&P stocks that are above their 200 dma, the lower the S&P will be from its 200 dma.
From 1998-present, the correlation between "the % of SPY stocks above their 200 dma" and "SPY's distance from its 200 dma" is 0.84
So using this as a breadth indicator is similar to saying:
- If the S&P is above its 200 dma, be bullish.
- If the S&P is below its 200 dma be bearish.
Using the 200 dma as a buy/sell signal (or using 50% of SPY stocks above their 200 dma) doesn't significantly beat buy and hold in the long run because there are too many false sell signals. However, it does avoid the really nasty drawdowns. Moreover, there is nothing particularly "special" about the 200 dma. Using it as a buy/sell signal is not much different from using the 198, 199, 201, 202, 203 dma etc.
Short term breakout?
Despite many large daily and intraday swings, the S&P remains stuck within a narrow range.
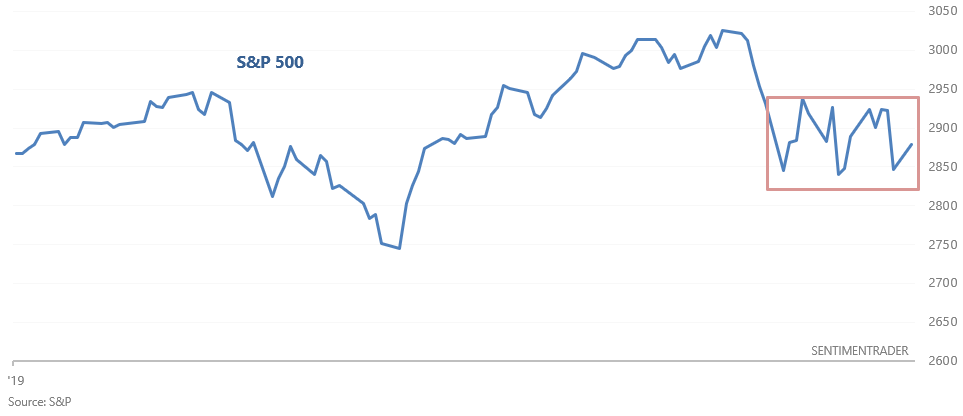
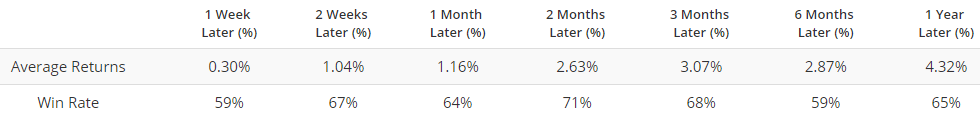
This demonstrates the market's indecisive nature. One day the market focuses on "recession fears", so stocks plunge. The next day the market focuses on Trump's "conciliatory tone", so stocks rally. A lot of noise, but no clear direction. When this happened in the past, the S&P often rallied over the next month.
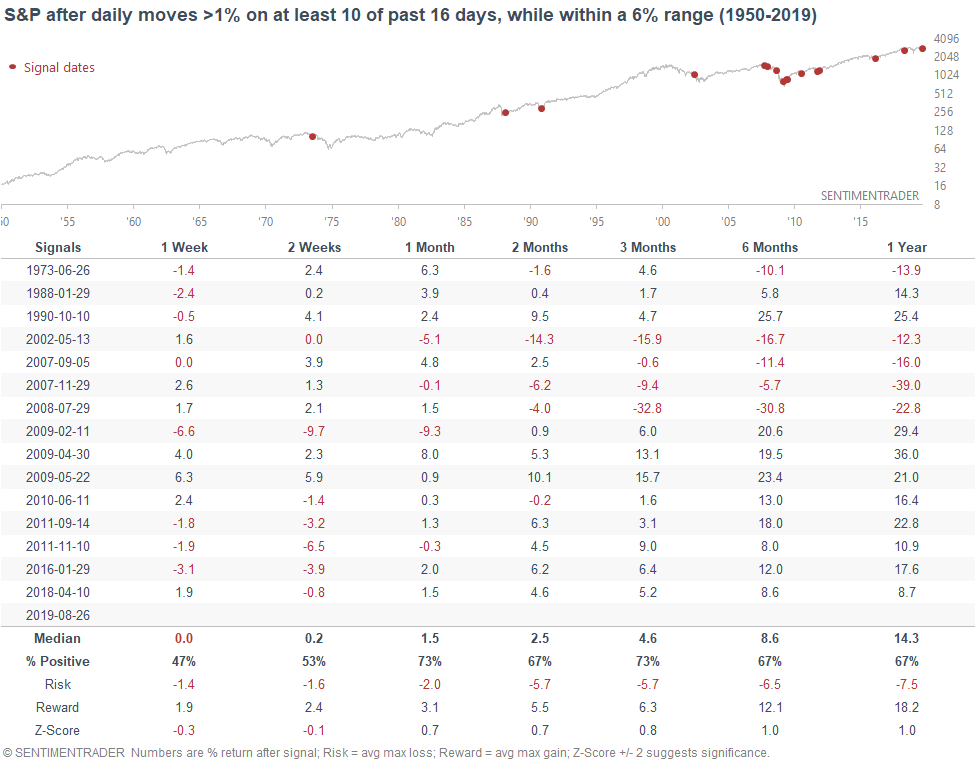
However, the S&P's risk:reward over the next month wasn't incredibly bullish either, which demonstrates that these types of markets usually continue to be choppy. A non-stop breakout on the upside is unlikely.
10 year Treasury yield
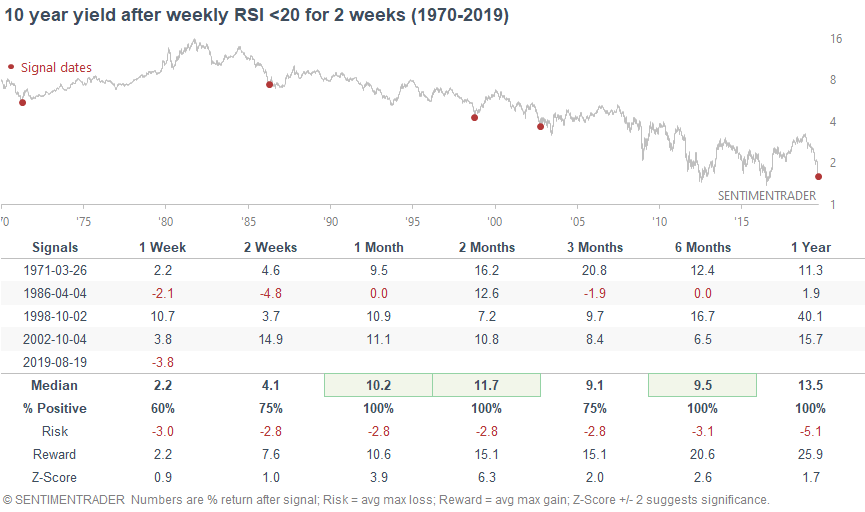
The 10 year Treasury yield continues to trend downwards, despite being oversold for weeks. But at this point, the rally in bonds seems to be overdone. The 10 year yield's 14 weekly RSI has been below 20 for 2 consecutive weeks.
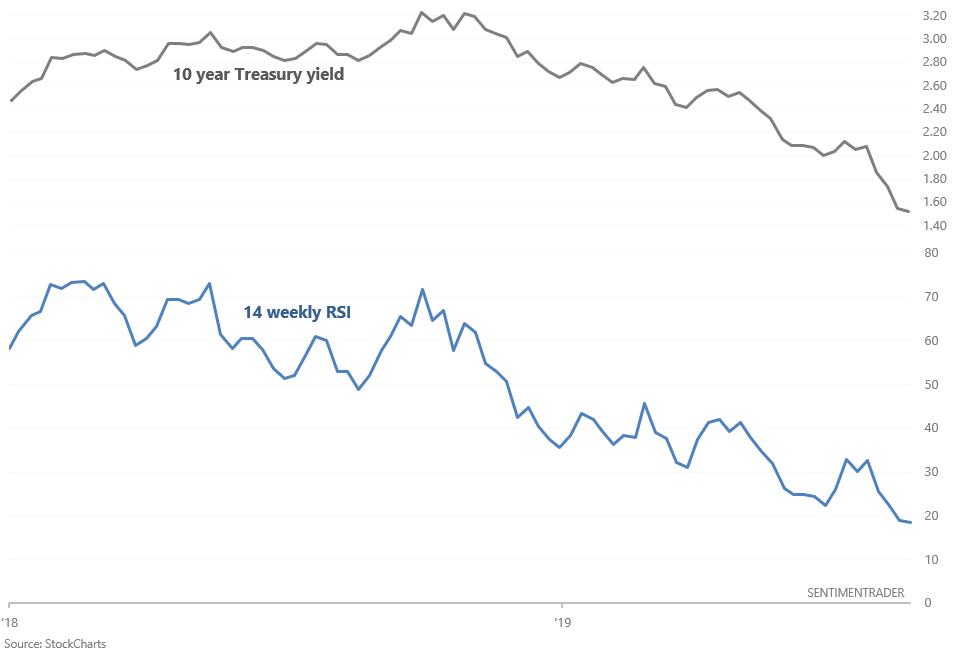
In the past, this was about as extreme as it gets. The only 4 cases that were this extreme all saw the 10 year yield rally over the next 2 months.
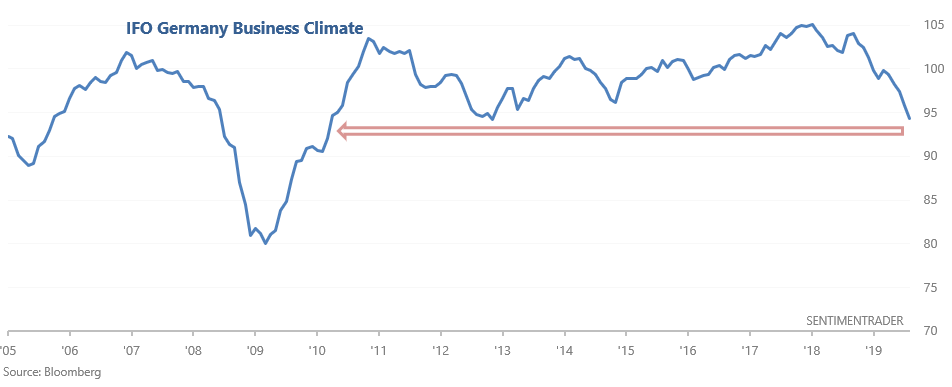
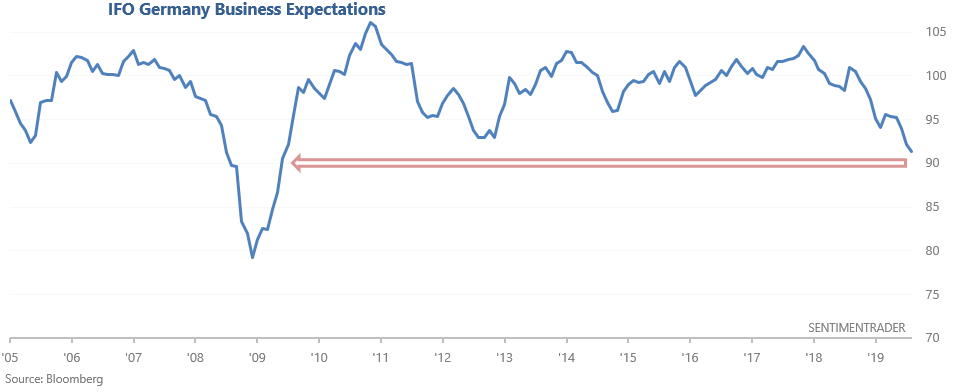
Ifo
Ifo produces several closely followed indicators that are useful for understanding the German economy:
- Business Climate Index
- Business Expectations Index
- Manufacturing Business Expectations Index
Together, these 3 indicators demonstrate that the German economy is in a slump.
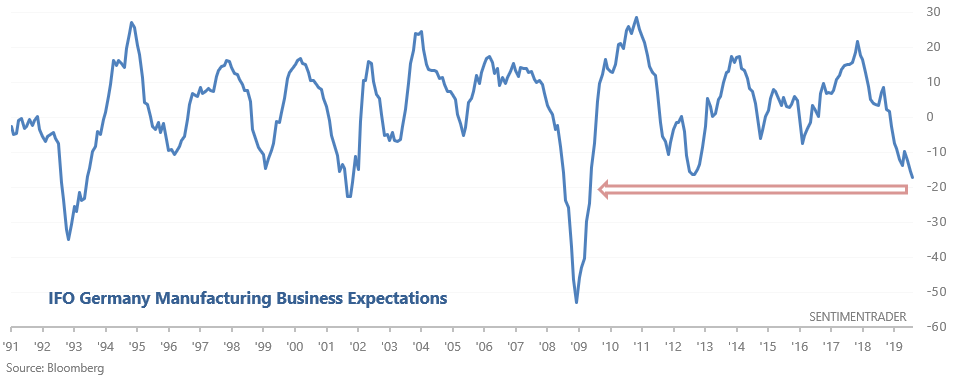
For the sake of this stat, let's use Manufacturing Business Expectations, which has more historical data. Here's what happened next to the German DAX when the Manufacturing Business Expectations Index fell below -16.
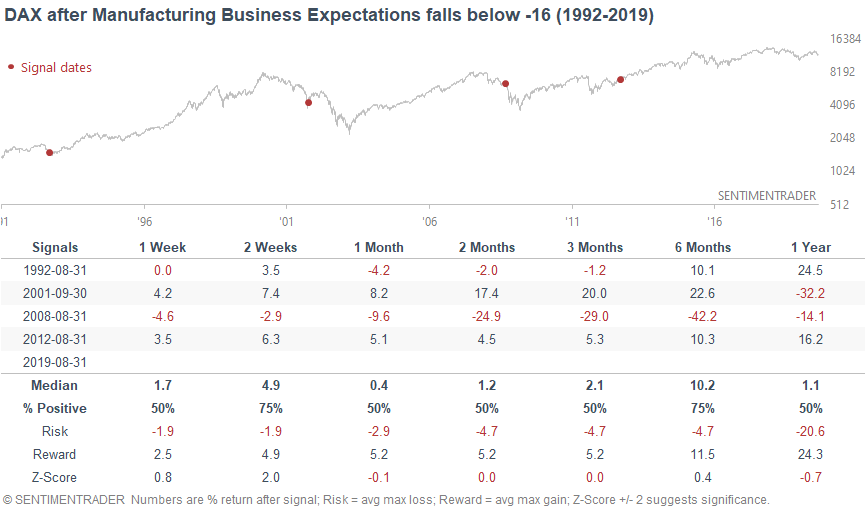
This hasn't been consistently bullish or bearish for the DAX. But in general, this tends to happen during a German recession.