
What I'm looking at - momentum's resurgence, new highs-lows, Index Put/Call, job openings, soft data
With stocks still swinging wildly on the latest trade war news, here's what I'm looking at.
Momentum's resurgence
Momentum crashed in September, prompting some market watchers to predict that the 10 year bull market in equities was over. Jason looked at momentum from several ways over the past 1.5 months, demonstrating that this argument was questionable (here, here, here, and here).
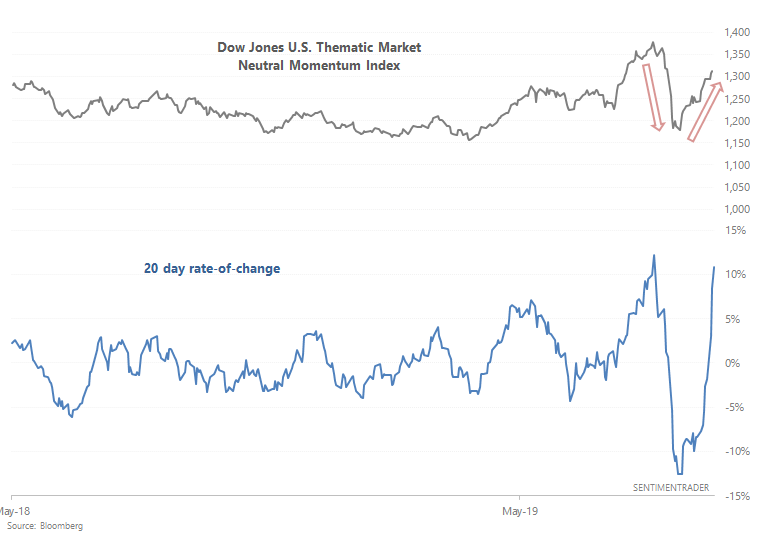
But after crashing in September, momentum is once again on the rise.
*The Dow Jones U.S. Thematic Market Neutral Momentum Index looks at what happens if you long high momentum stocks and short low momentum stocks.
Here's a longer term look at this chart:
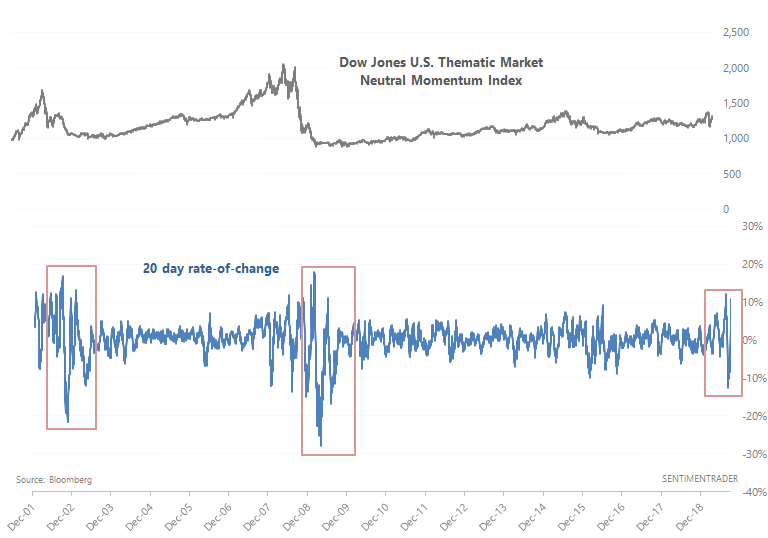
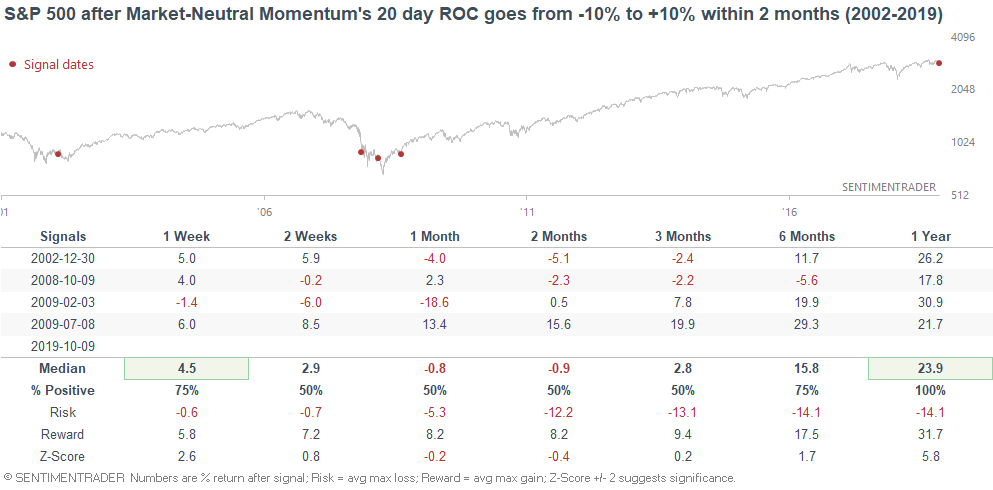
Such a rapid drop+surge in momentum has occurred 2 other times since 2001: at the stock market's bottom in 2002 and 2008/2009:
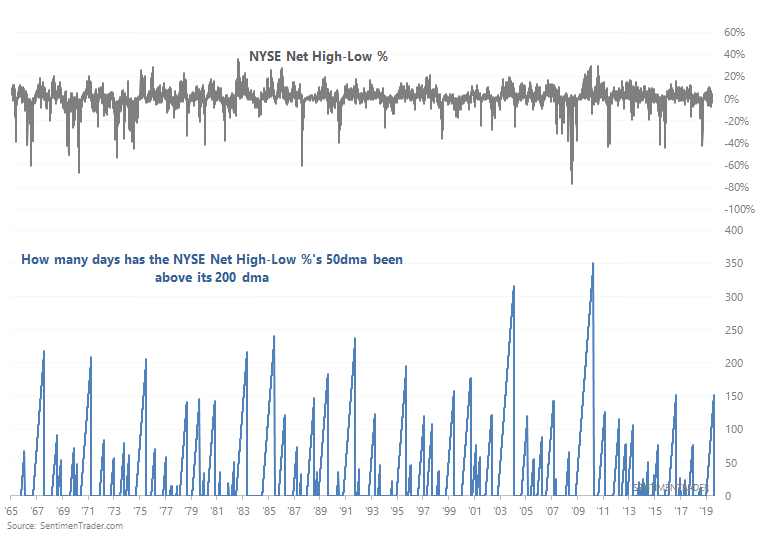
NYSE Net High-Low %
After a surge in the first half of this year, the S&P 500 has been meandering sideways for the past few months. This was to be expected (years in which the S&P surges 30-40% are very rare). Along with the surge in stock indices like the S&P 500 and NYSE Composite came a surge in issues making new highs. Now that the stock market is trending sideways, the NYSE Net High-Low % is slowly rolling over.
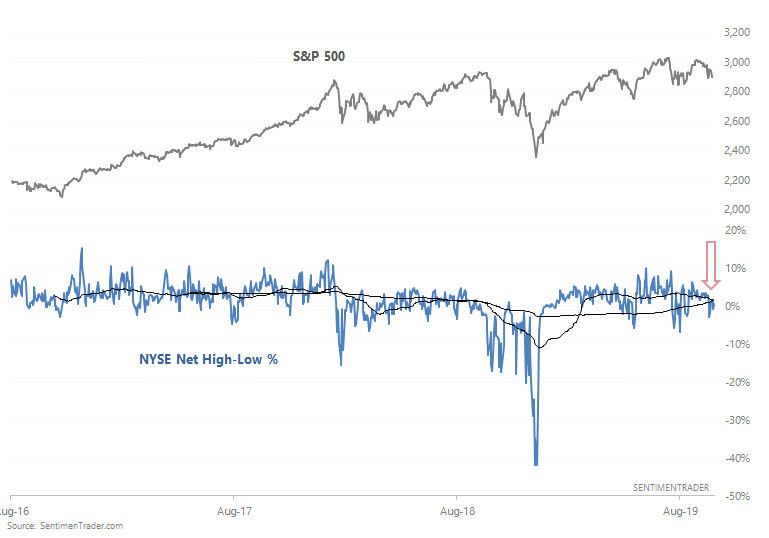
The 50 day average in NYSE Net High-Low % fell below the 200 day average for the first time in more than 150 days. This is quite a long streak, which demonstrates that the previous strong uptrend in U.S. stocks is slowing down:
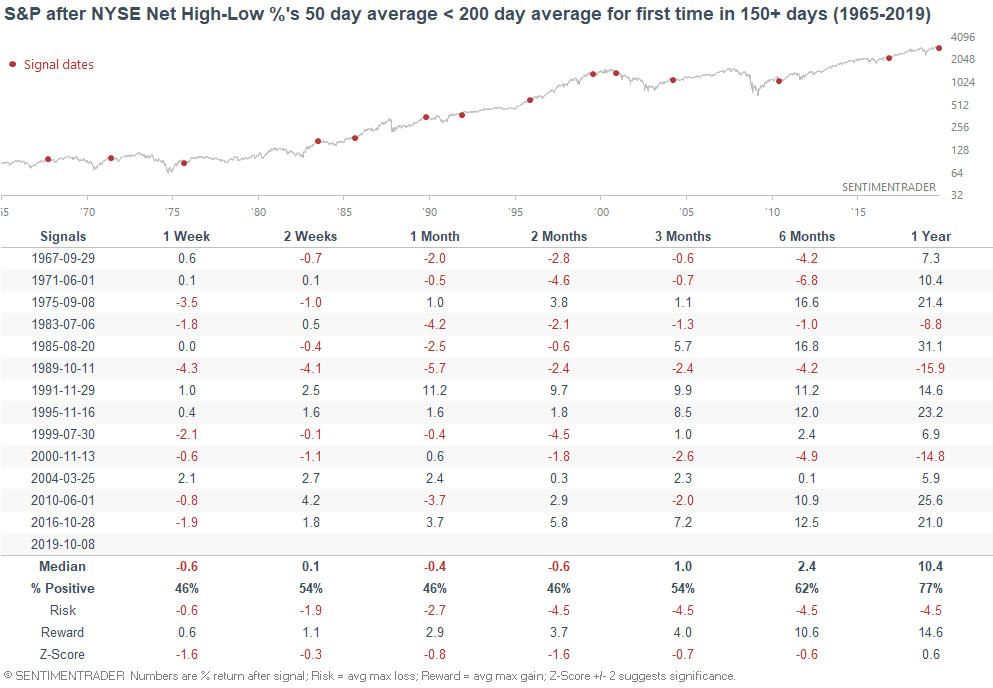
When this figure rolled over in the past for the first time in 150+ days, the S&P's returns over the next 2 months were more bearish than average:
Index Put/Call
With the S&P choppy over the past few months, plenty of days have seen high Index Put/Call ratios. As a result, the Index Put/Call ratio's 50 dma is more than 10% above its 200 dma: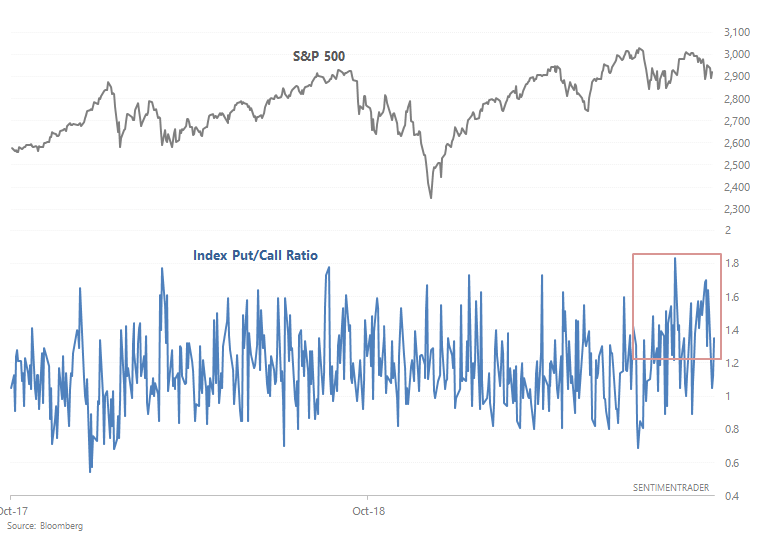
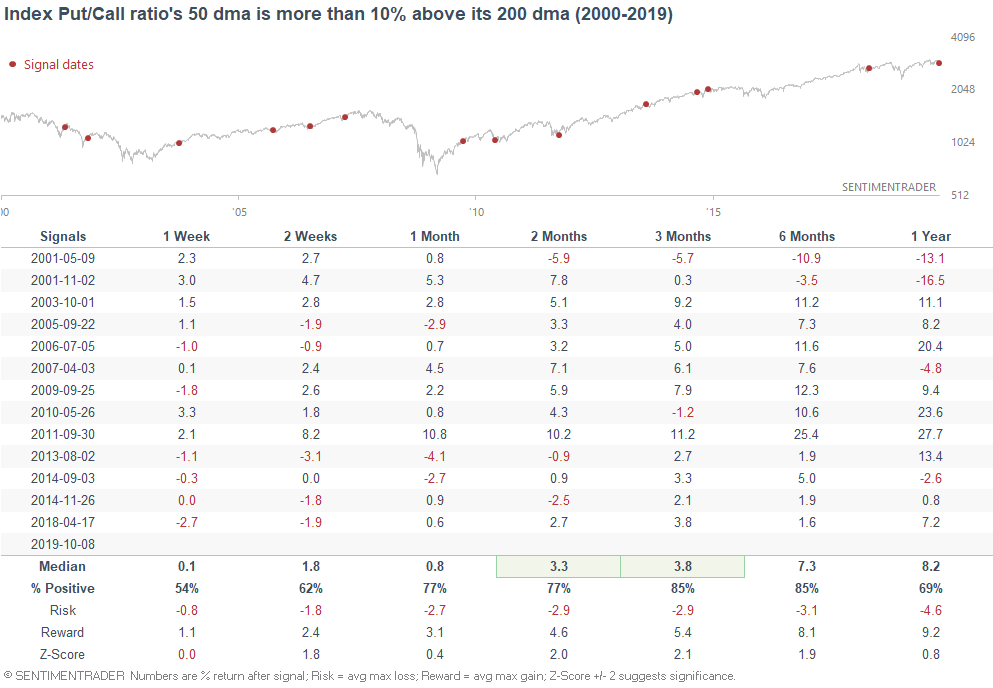
When sentiment was this bearish in the past (at least based on the Index Put/Call ratio), the S&P's 2-3 month forward returns were mostly bullish:
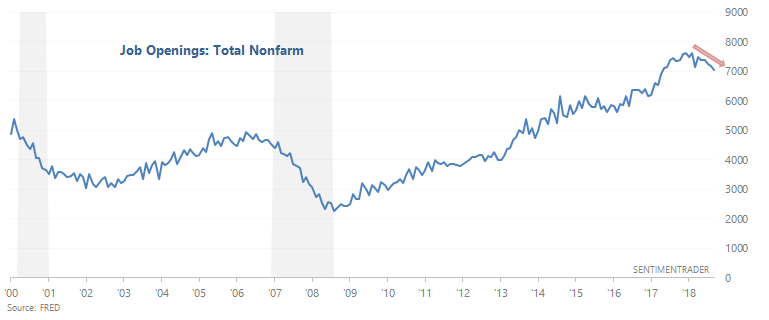
Job Openings
As Mikael Sarwe noted, job openings are falling:
The following chart illustrates what happens when you:
- Buy the S&P 500 if Job Openings' 10 month average is going up,
- Otherwise, buy the Bloomberg Barclays U.S. Treasury Bond Index
*This is not an investment model, because these equity curves don't take into consideration the fact that JOLTS is released with a 1+ month delay. As a rule of thumb, don't use indicators that are released with long delays in your investment/trading models.
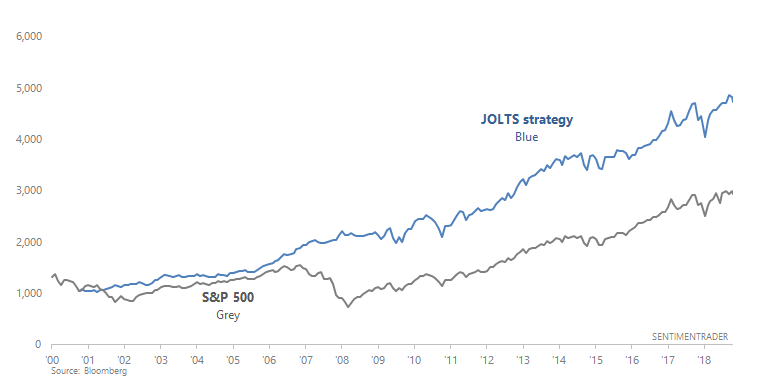
As you can see, it's better to buy stocks when Job Openings are trending higher.
This stands in contrast with the Unemployment Rate and Initial/Continued Claims, which are trending downwards and sideways, respectively (a bullish sign). Overall, I would put much more weight on the Unemployment Rate, Initial Claims, and Continued Claims than on Job Openings because Job Openings' historical data is quite limited. We don't know how useful this data series was for market timing prior to the past 20 years.
The labor market remains a long term bullish factor for stocks right now, but this may change IF labor market conditions deteriorate over the next few months. This hasn't happened yet, but watch out in case it does.
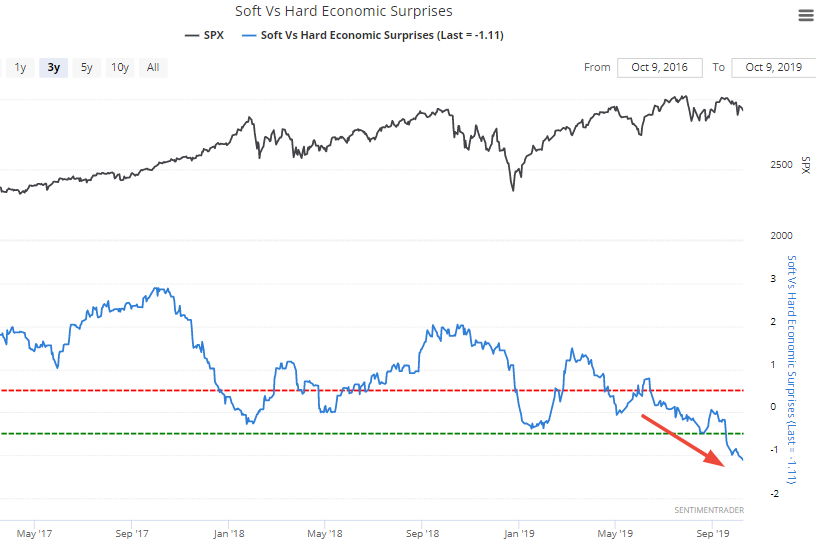
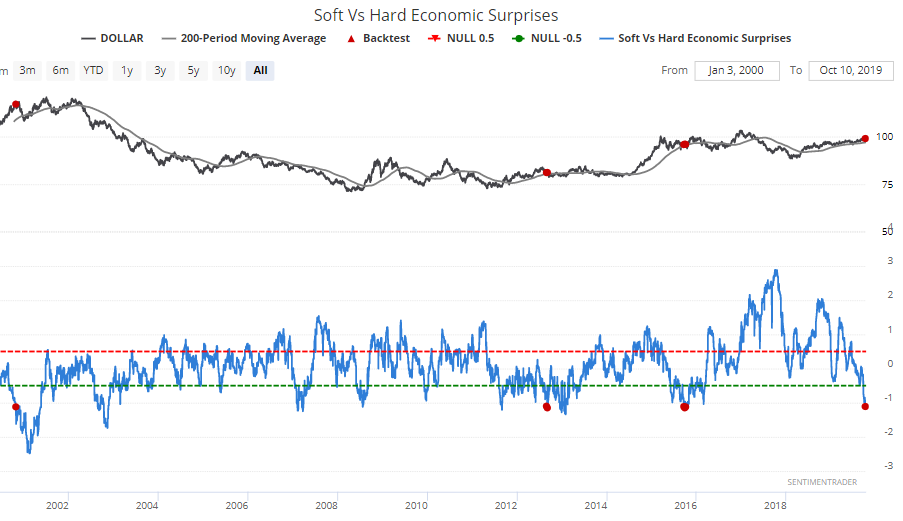
Soft economic data - still weak
As I noted last week, soft economic data has been significantly worse than hard economic data. The gap between the 2 has widened even more since then, falling below -1.1
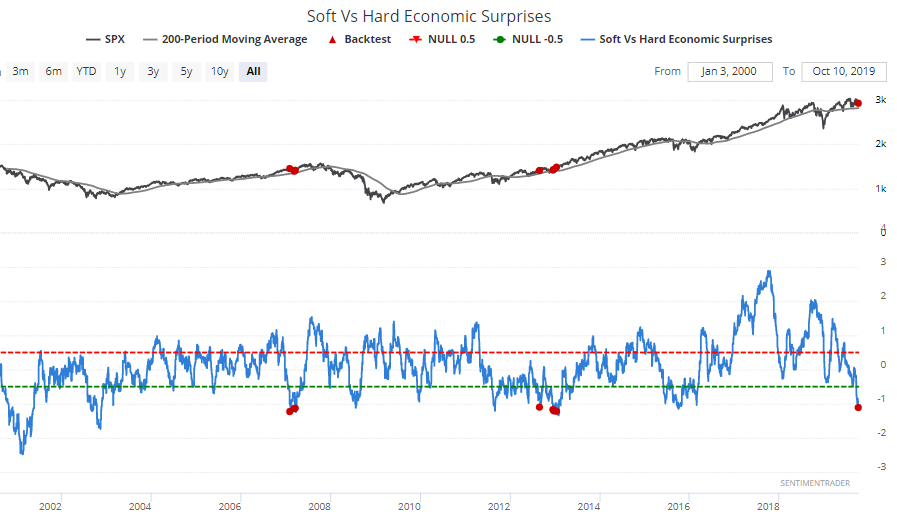
Last time I said that whether this is bullish or bearish depends on the environment in which it occurs:
- In a bear market, this is a bearish sign.
- In a bull market, this is a bullish sign.
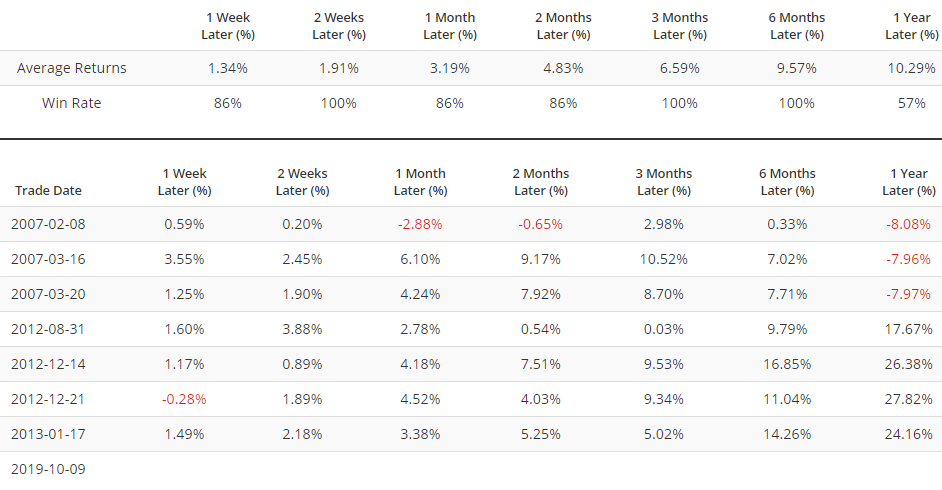
Once again, let's look at the few historical cases in which the spread was this wide, while the S&P was above its 200 dma:
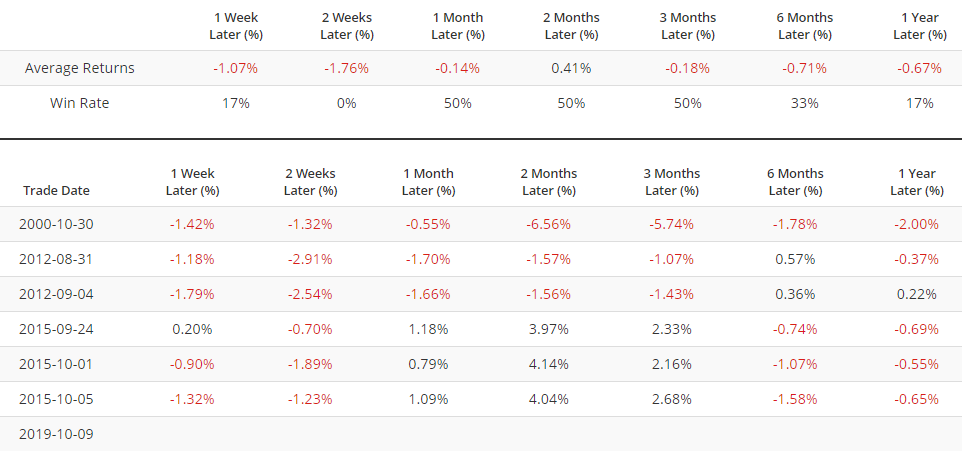
More importantly, this wasn't good for the U.S. Dollar over the next 6-12 months (the Economic Surprise Index was originally designed to trade currencies).
Got questions or comments? Feel free to email me at [email protected]