
What I'm looking at - Index Put/Call, Hard vs. Soft data, earnings estimates collapse, Arms Index, REITs
With stocks sensitive to weak manufacturing news, here's what I'm looking at:
Index Put/Call ratio
There is a fair amount of fear in the markets, and yesterday's weak ISM manufacturing report did not help. As a result, the Index Put/Call has remained consistently high over the past 1-2 weeks.
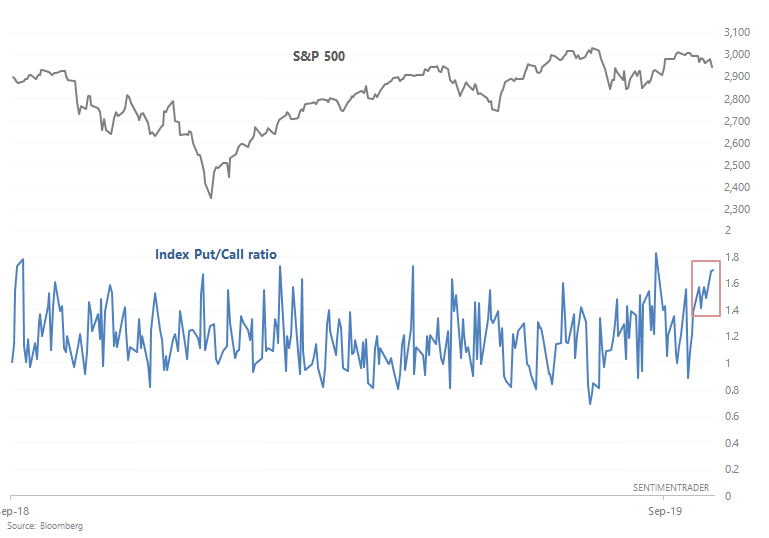
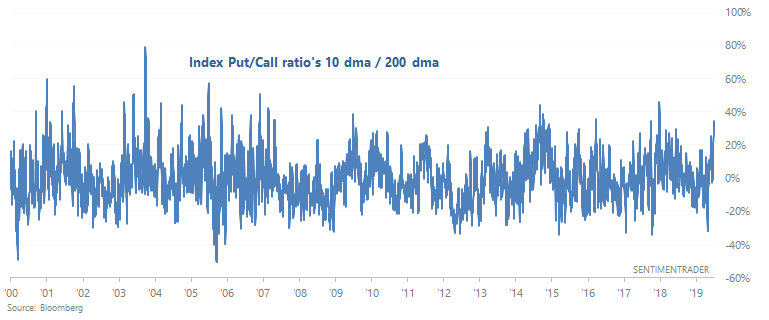
Since the Index Put/Call ratio's long term average tends to fluctuate over time, it's better to look at the ratio's 10 day average vs. its 200 day average. This gap has climbed to 34%.
When the Index Put/Call ratio's 10 day average was more than 34% above its 200 day average, the S&P's 2 month forward returns were slightly more bullish than random.
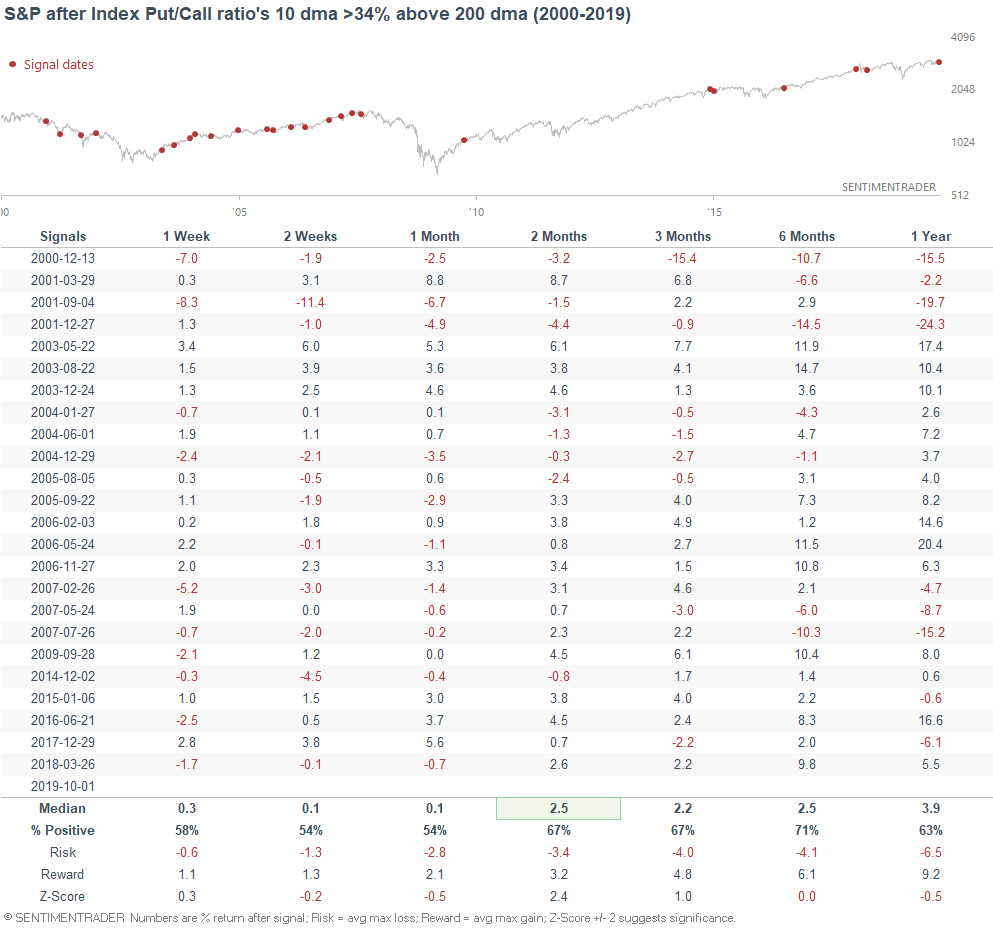
Some of these bearish cases occurred when the stock market was in a strong downtrend (e.g. 2001-2002). So if we only examine the cases in which the S&P was above its 200 dma...
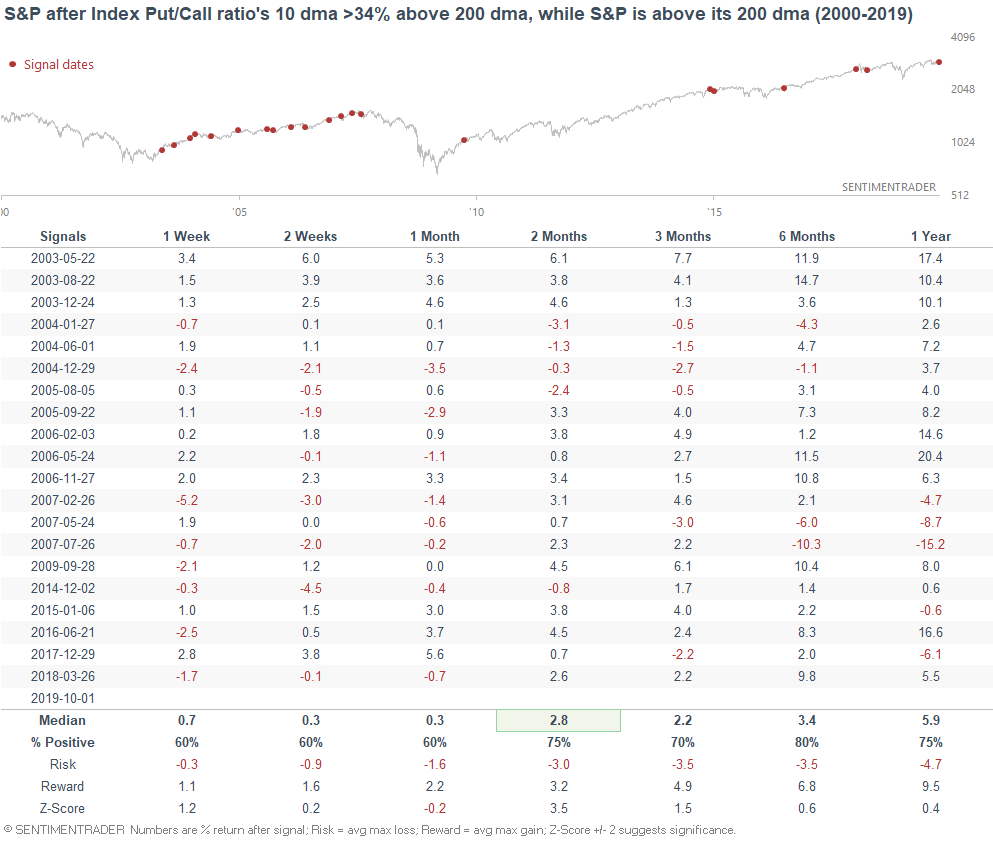
2 month forward returns improve.
Hard vs. soft data
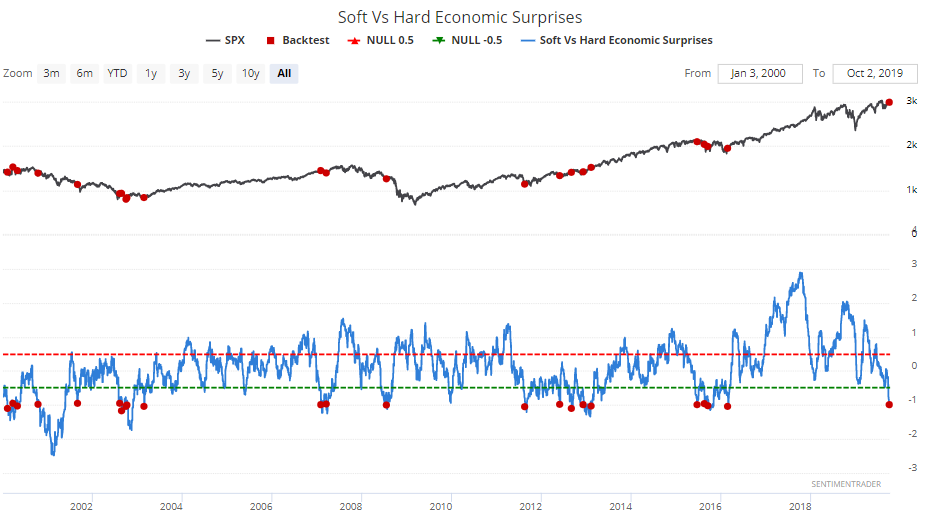
As the WSJ notes, hard economic data has been significantly better than soft economic data. Examples include recent weakness in the ISM manufacturing PMI. As a result, our Soft vs. Hard Economic Surprises calculation has recently fallen below -0.95. This is the lowest level since early-2016, just as a monster rally began.
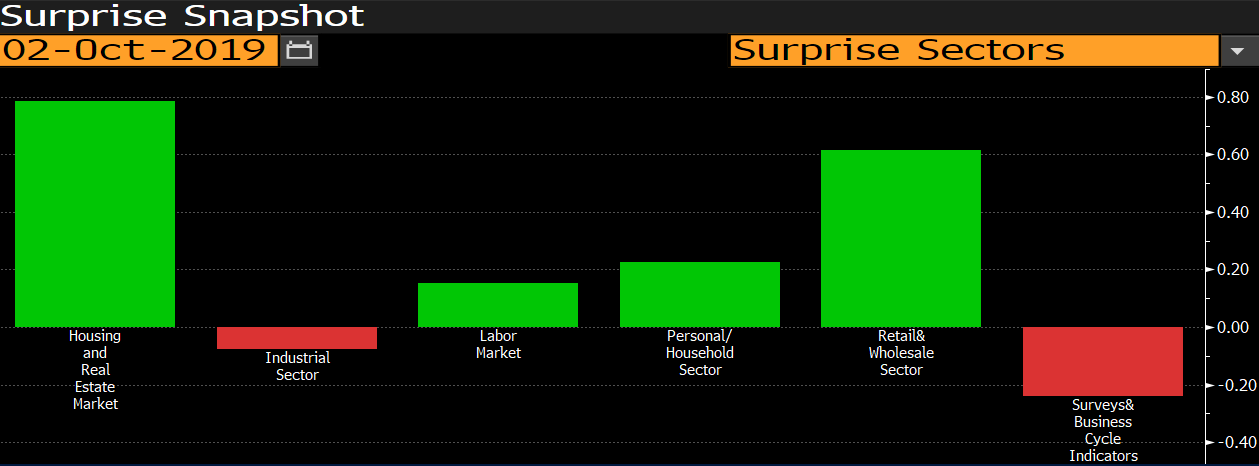
We can also see this in Bloomberg. The biggest sectors weighing on economic surprises are industrials & surveys.
The general thinking is that when soft data significantly underperforms hard data, people are too pessimistic towards the economy. What does the data suggest? The following table looks at every case in which the Soft - Hard data spread fell below -0.95:
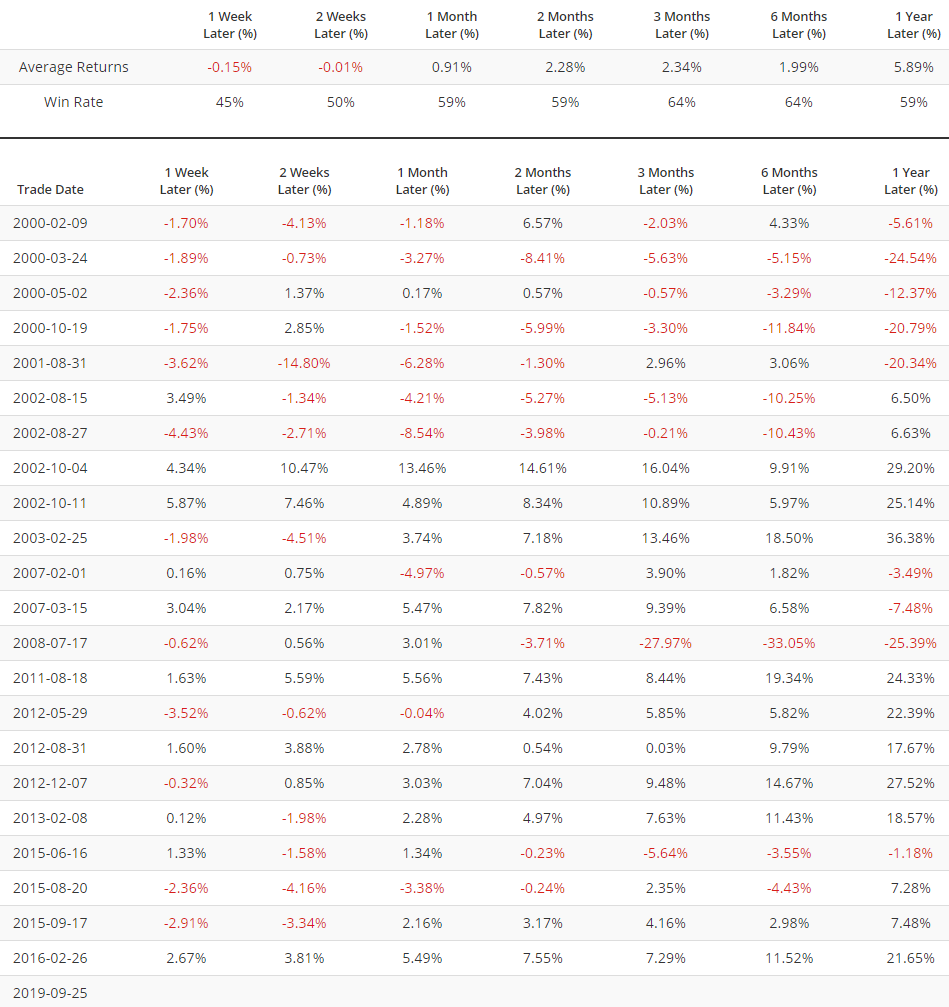
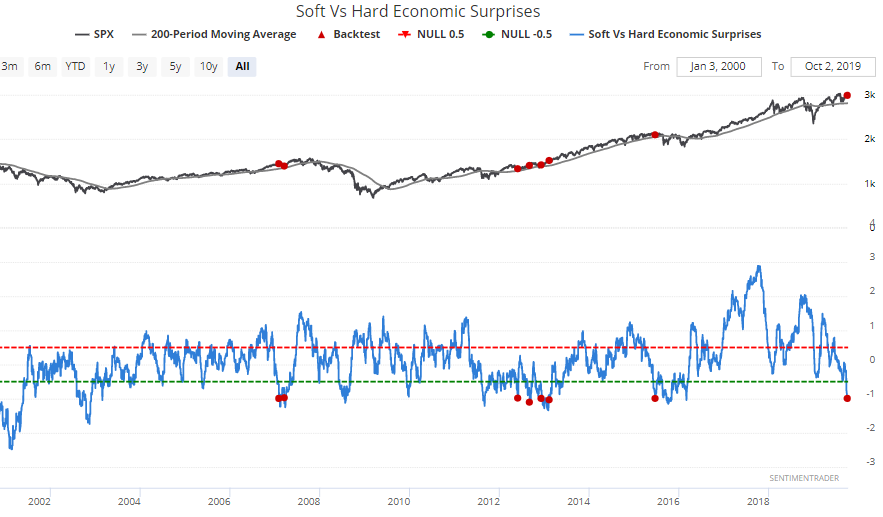
As you can see, forward returns clearly depend on what type of market we are in. In a bear market, this is a bearish sign. In a bull market, this is a bullish sign. The following table only examines the cases in which the S&P was above its 200 dma.
Earning estimates
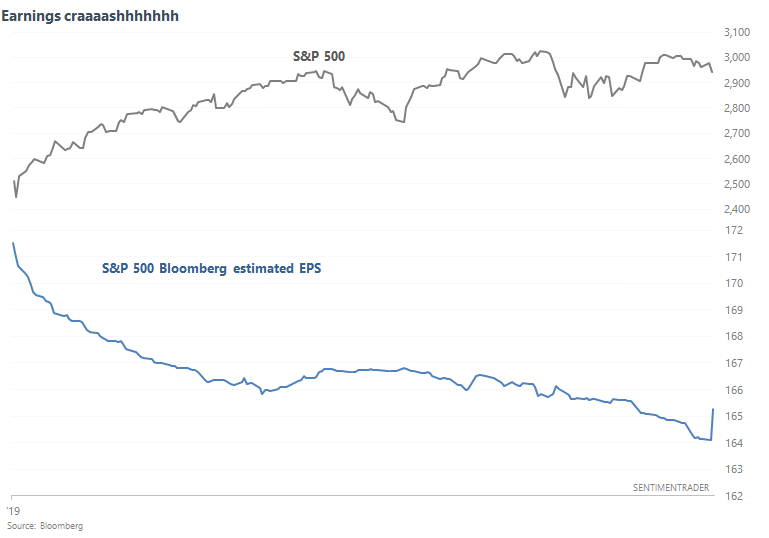
Speaking of fundamental data, a popular bearish website (which shall remain unnamed) continues to post a chart that compares the S&P 500 against Bloomberg's estimated EPS for the S&P 500. The following chart tells a simple narrative: earnings estimates are crashing, so the S&P's rally is just a bubble.
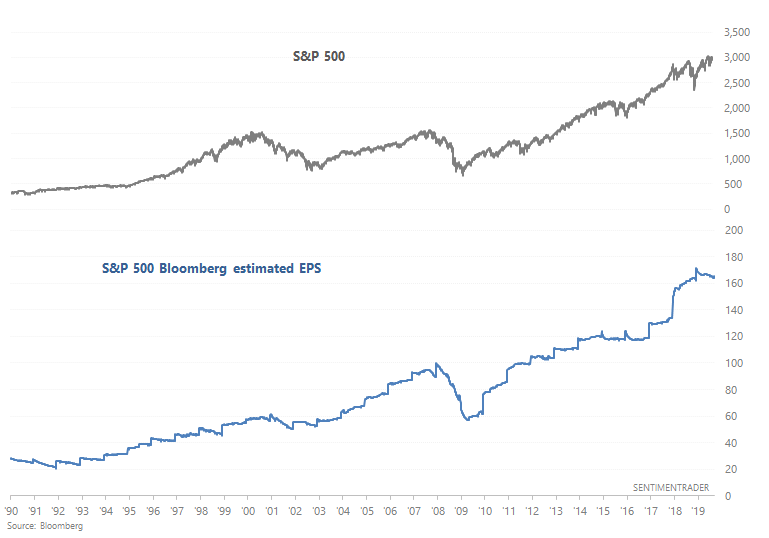
Except when we look at the history of Bloomberg's earnings estimates for the S&P 500, we can see that this is pretty much the norm. Earnings estimates tend to jump at the start of the year, and then as the year goes on earnings estimates are downgraded. (Ed Yardeni noted a similar phenomenon in his autobiography).
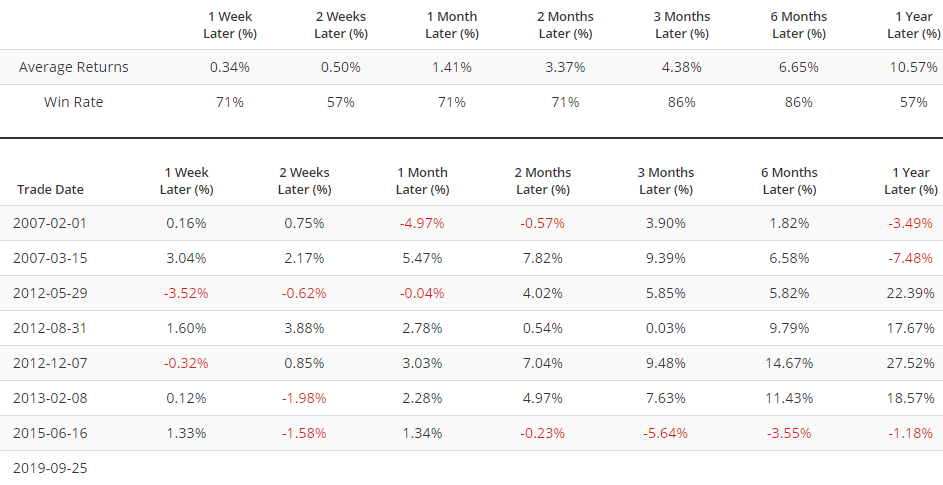
The following table illustrates every case in which the S&P rallied more than 20% over the past 9 months, while earnings estimates' 9 month rate-of-change is less than +2%:
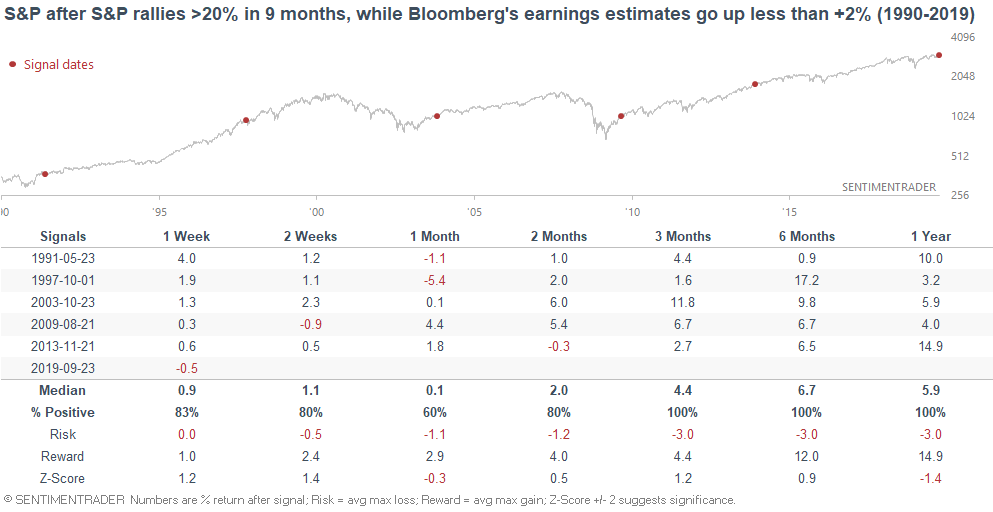
Starting points matter. These charts are plain misleading unless we zoom out and examine the bigger picture.
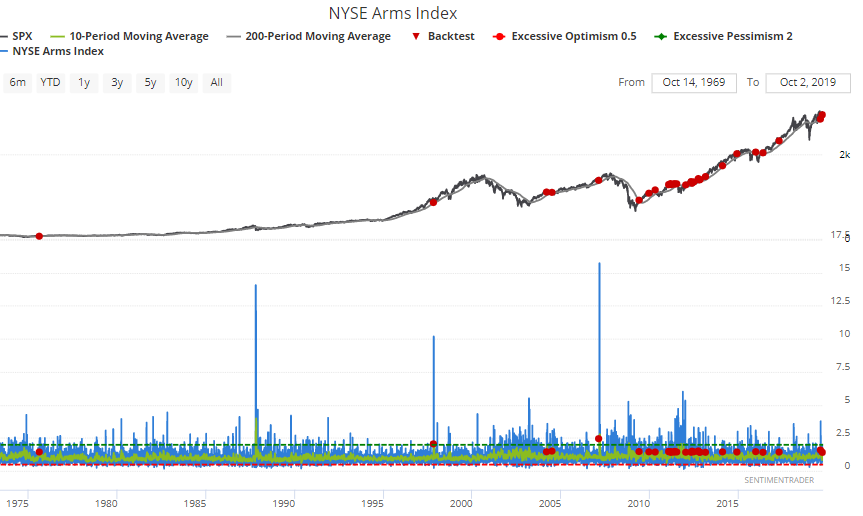
Arms Index
The Arms Index - a popular technical indicator that helps us gauge the market's sentiment - has reached 2, which is our threshold for for excessive pessimism.
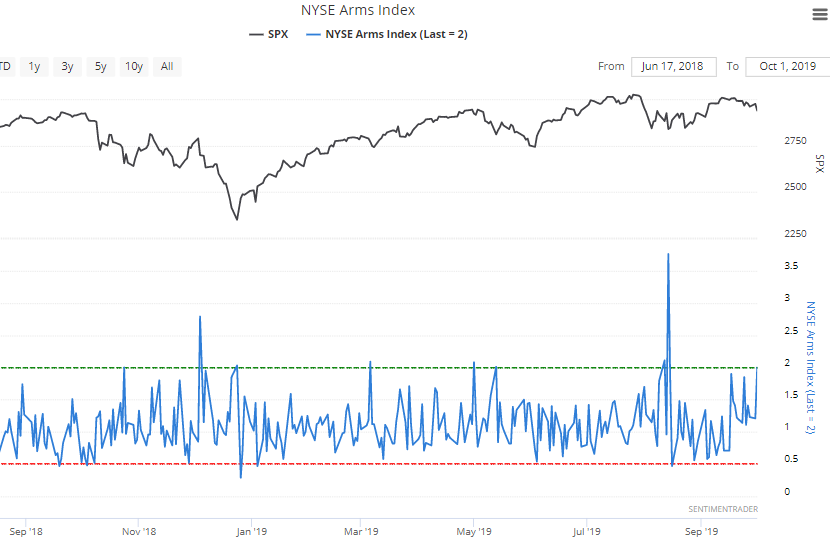
Moreover, several days in the past 2 weeks have seen relatively high readings. This has pushed the Arms Index's 10 day average above 1.4
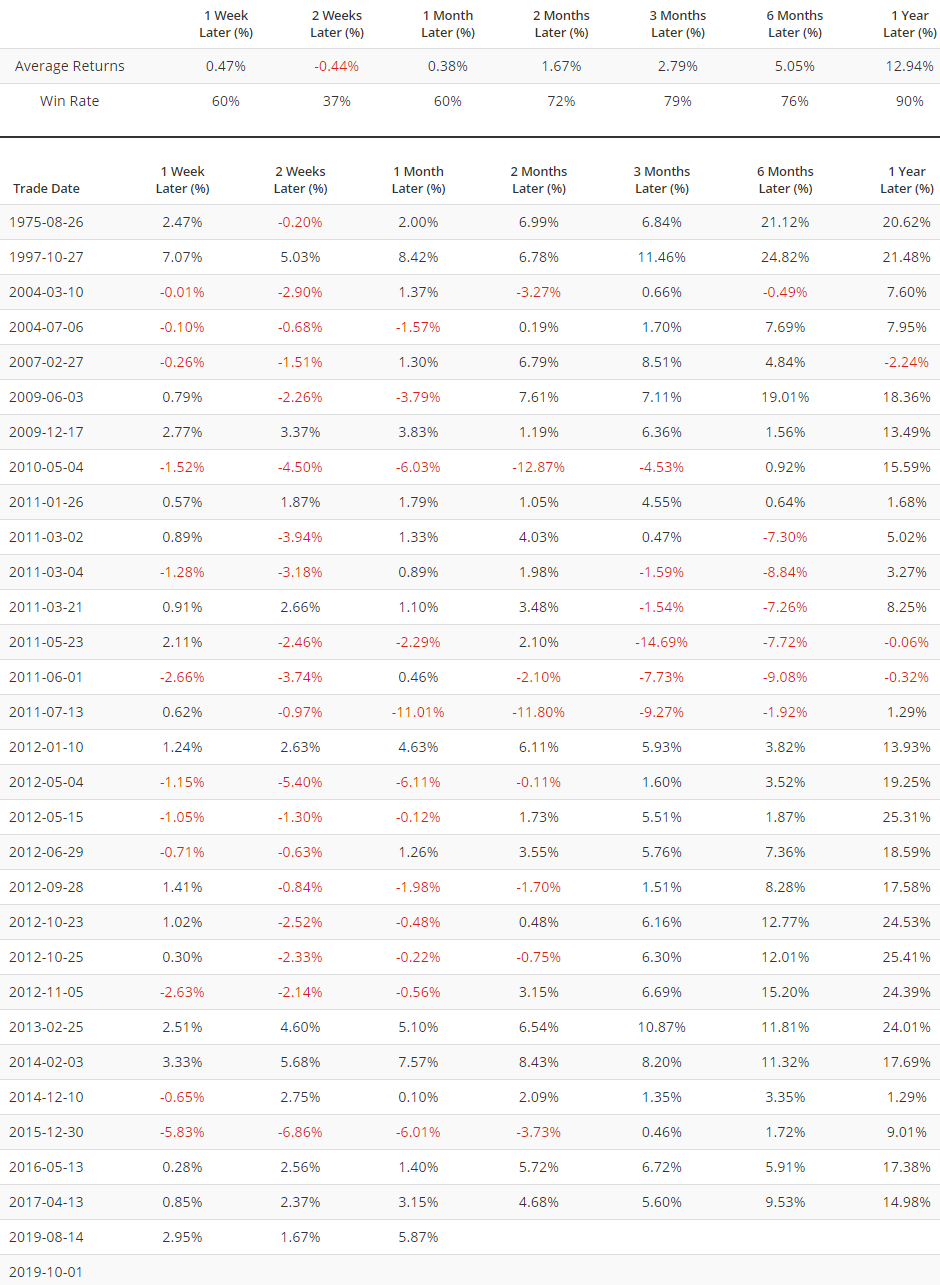
Such readings in the past often lead to more weakness for the stock market over the next 2 weeks, but gains over the next 3 months.
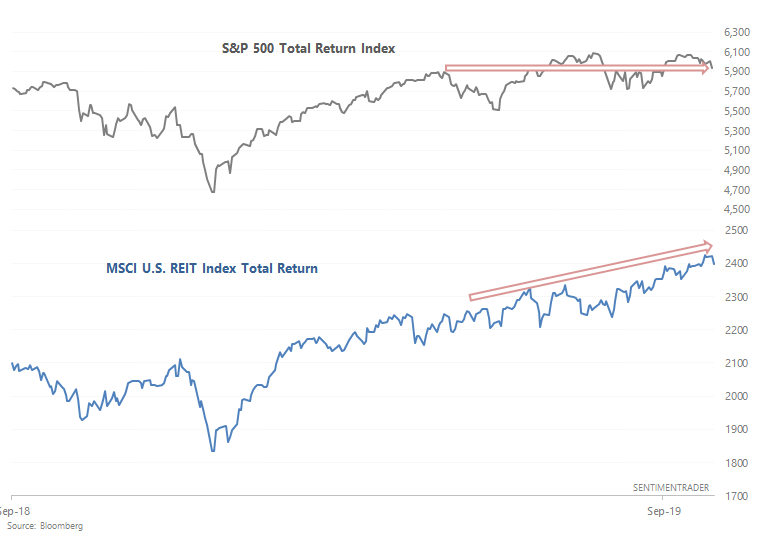
REIT's
And lastly, a quick word on REIT's. The MSCI U.S. REIT Index (total return) continues to trend higher and has outperformed the S&P over the past 5 months:
This may be seen as a sign for concern. Many investors and traders agree that the "next one" (recession and bear market) won't be similar to 2008. But could it be more similar to 2000-2002? I.e. a relatively shallow recession but a bigger bear market? The biggest contributor to the intensity of the bear market won't be the economy, but will be high valuations.
A 2000-2002 scenario is interesting, because the 2000-2002 bear market was accompanied by a strong real estate sector. The following chart looks at the nominal and inflation-adjusted median sales price for new houses sold in the U.S.
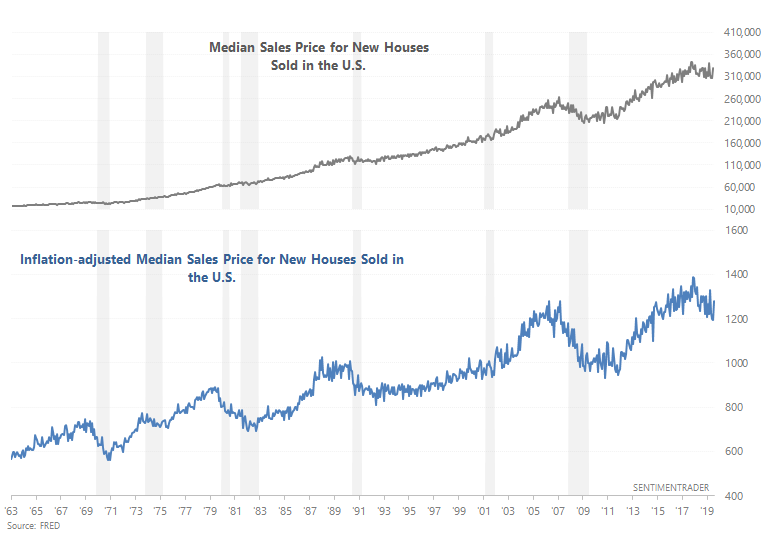
As you can see, real estate usually (but not always) outperforms during a bear market and recession, at least on a nominal basis. This is why some people prefer investing in real estate instead of stocks - it's less volatile.
So the question is simple. Is the recent outperformance in real estate a harbinger of things to come. Is this "just like" 2000-2002?
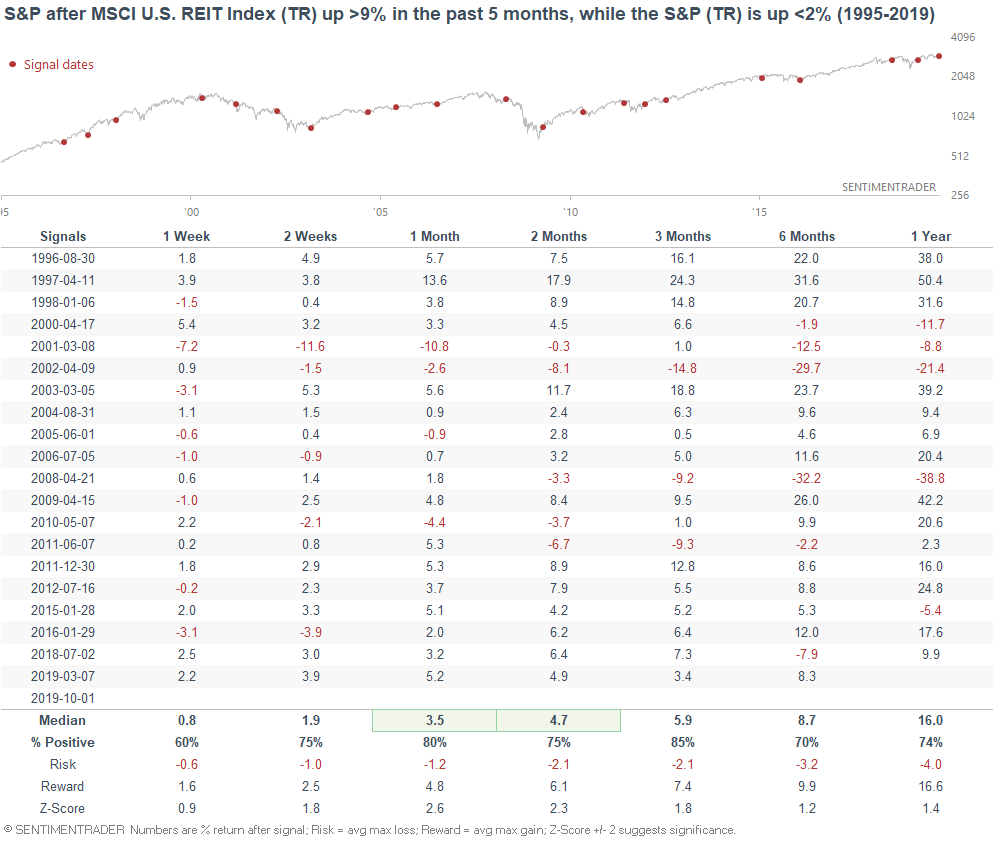
The following table illustrates what happened next to the S&P when the MSCI U.S. REIT Index (total return) significantly outperformed the S&P 500 (total return) over a 5 month period:
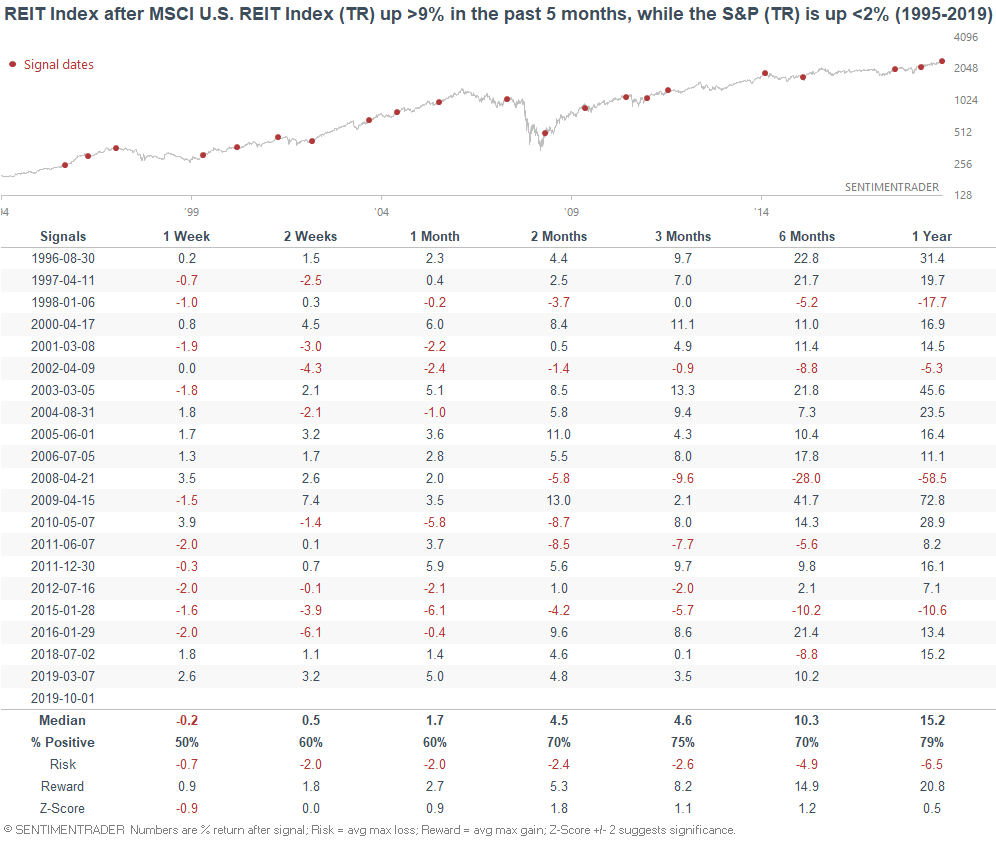
Not consistently bearish, although this did happen during the previous 2 recessions. The following table illustrates what happened next to the MSCI U.S. REIT Index:
Got questions or comments? Please contact me at [email protected]