What I'm looking at - Medium Term Volatility, sentiment, jumpy VIX, NASDAQ breadth, palladium
Here's what I'm looking at:
Lack of volatility
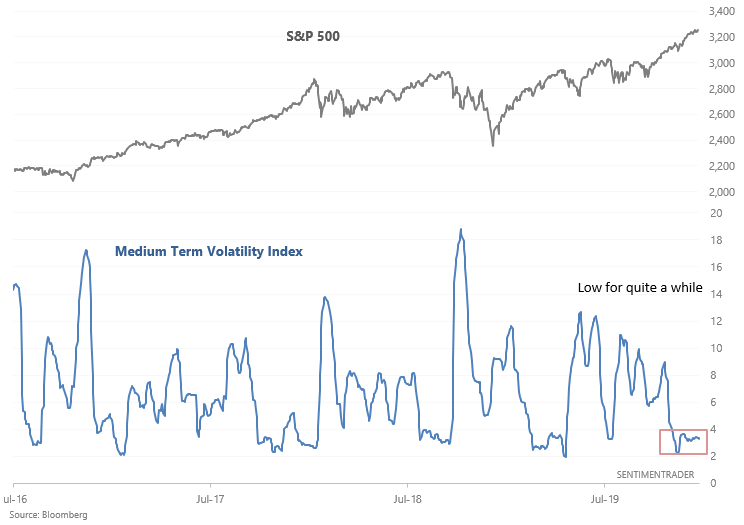
With the stock market refusing to break down, volatility has been low. I created a volatility index called the Medium Term Volatility Index which looks at the volatility of the stock market's volatility. Right now, the Medium-Term Volatility Index has been low for quite a while:
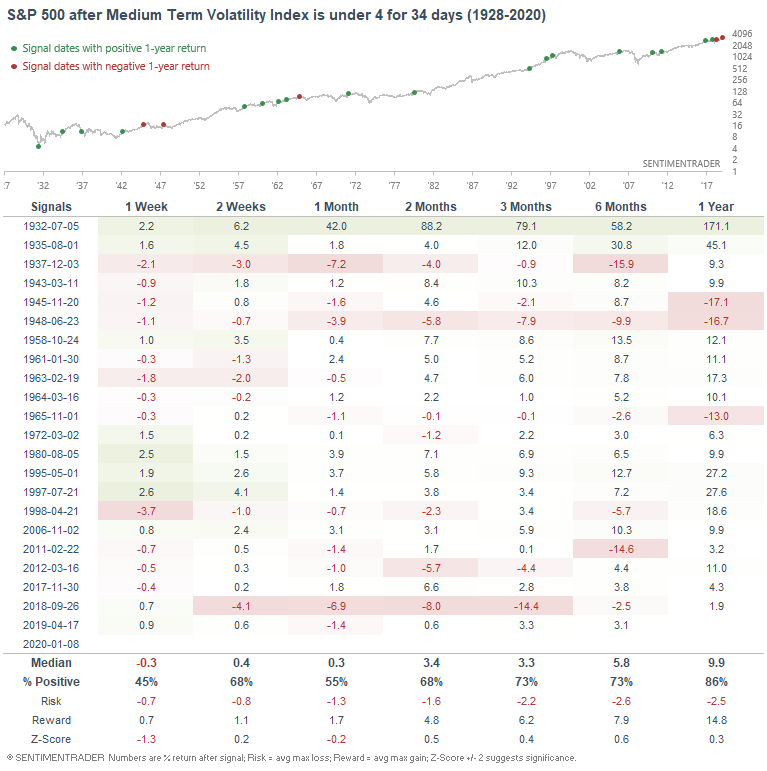
When the Medium Term Volatility Index was under 4 for 34 consecutive days (i.e. low for a sustained period of time), the S&P's returns over the next month were slightly worse than random...
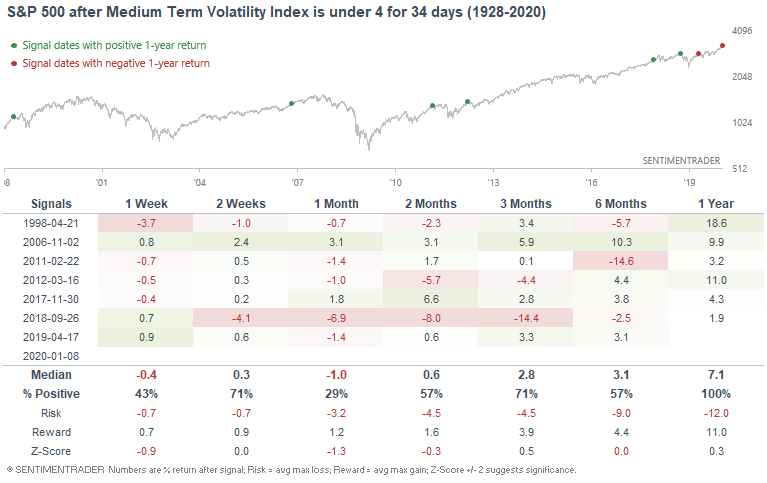
...particularly from 1998-present:
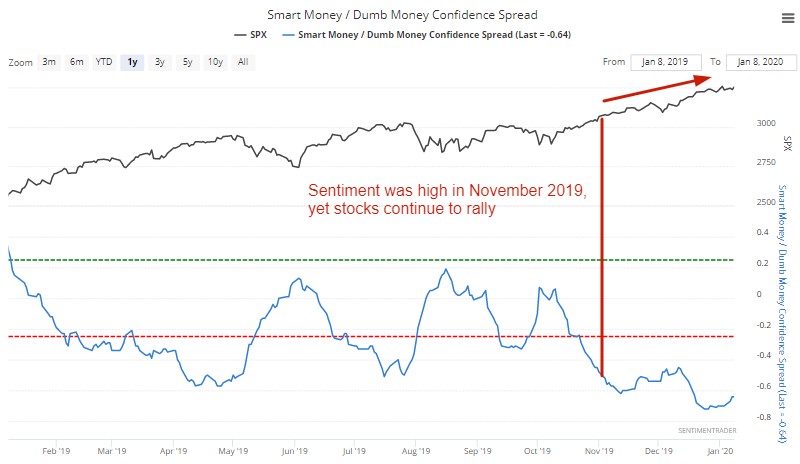
Is sentiment not working?
We've been saying over the past 2 months that sentiment is high, yet the stock market continues to rally relentlessly. This begs the question "is sentiment not working? Have we entered into a 2017 momentum-driven environment?"
In the following table we can look at cases in which the Smart Money/Dumb Money Confidence Spread fell below -0.5 (i.e. sentiment is frothy), yet the S&P still rallied over the next 44 days (a little over 2 months):
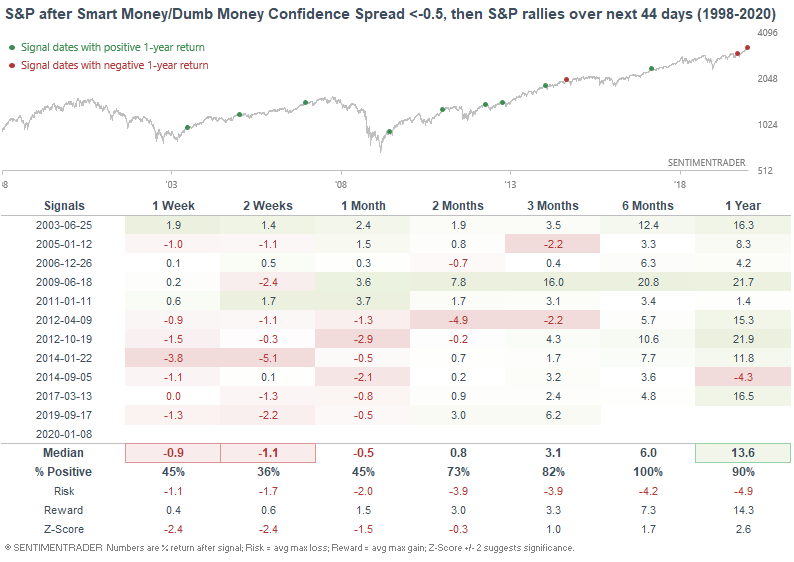
The S&P's returns over the next few weeks were consistently bearish, particularly from 2012-present. Every case saw a pullback over the next few weeks, even the 2017 case in which the market entered a momentum-driven environment.
Jumpy VIX
As Jason noted yesterday, dip buyers have been quite determined in the U.S. stock market recently. Plenty of days have seen the S&P dump in the overnight session and then rally later on during regular trading hours. On the flip side of that, VIX has consistently jumped and faded over the past 6 days.
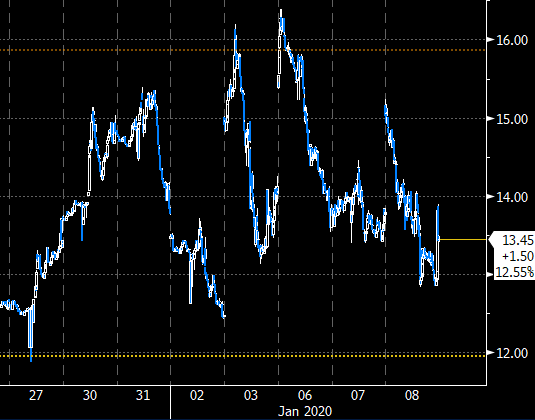
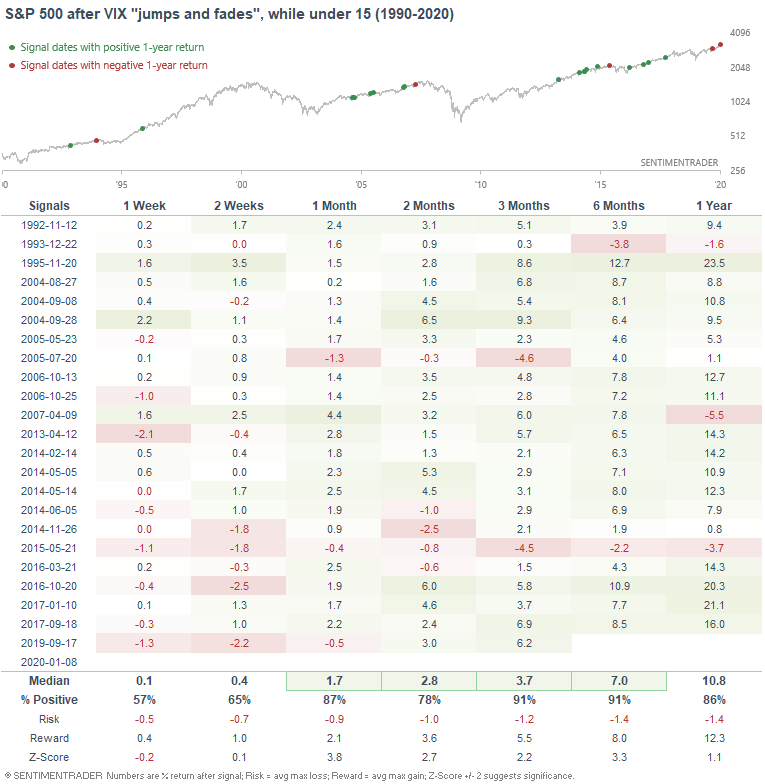
We can define "jump and fade" as at least 4 of the past 6 days seeing their OPEN > yesterday's CLOSE, while all 6 days see their CLOSE < their OPEN. This isn't a very common pattern when the VIX is low, and can be construed as a sign that VIX is getting "jumpy" (about the explode).
But that's not what history suggests. When VIX jumped and faded in the past while under 15, its forward returns over the next few months were not consistently more bearish than random.
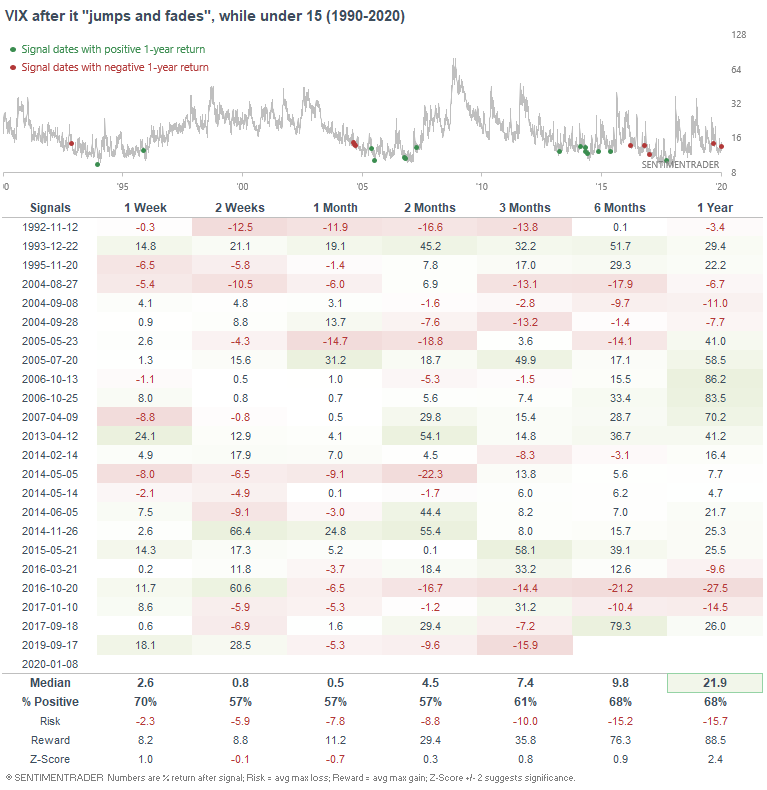
Meanwhile, the S&P had a strong tendency to rally over the next 1-3 months.
So how does this square with Jason's stat? Many of the bearish dates in Jason's stat occurred in 1999. Since I restricted my study's sample size to cases in which VIX was <15, it avoided cases in the late-1990s (VIX was consistently high in the late-1990s). Jason also mentioned that "the few occurrences in recent years also preceded nothing but some shorter-term volatility, with solidly higher medium-term returns." My stat features plenty of cases from 2013-present, hence the overall bullish lean.
So what if we remove the "VIX is under 15" criteria?
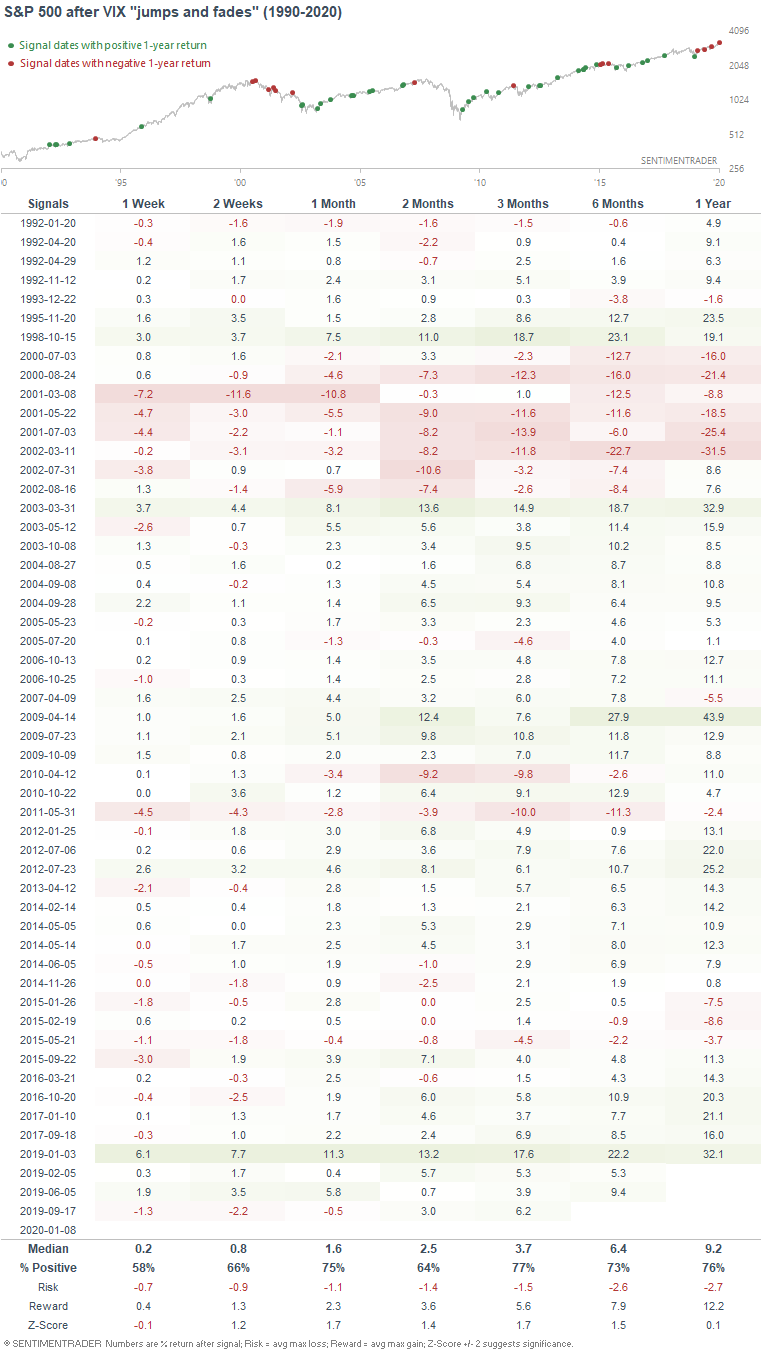
Not quite as bullish for the S&P, but still more bullish than random 1-3 months later.
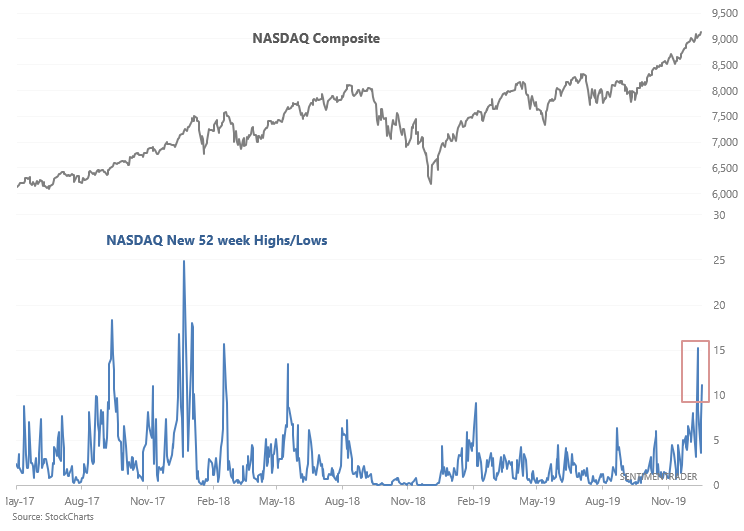
NASDAQ breadth
As the stock market (particularly tech stocks) rallies relentlessly, strong breadth remains a feature of the NASDAQ. Yesterday saw 10x more NASDAQ issues that made 52 week highs than issues that made 52 week lows.
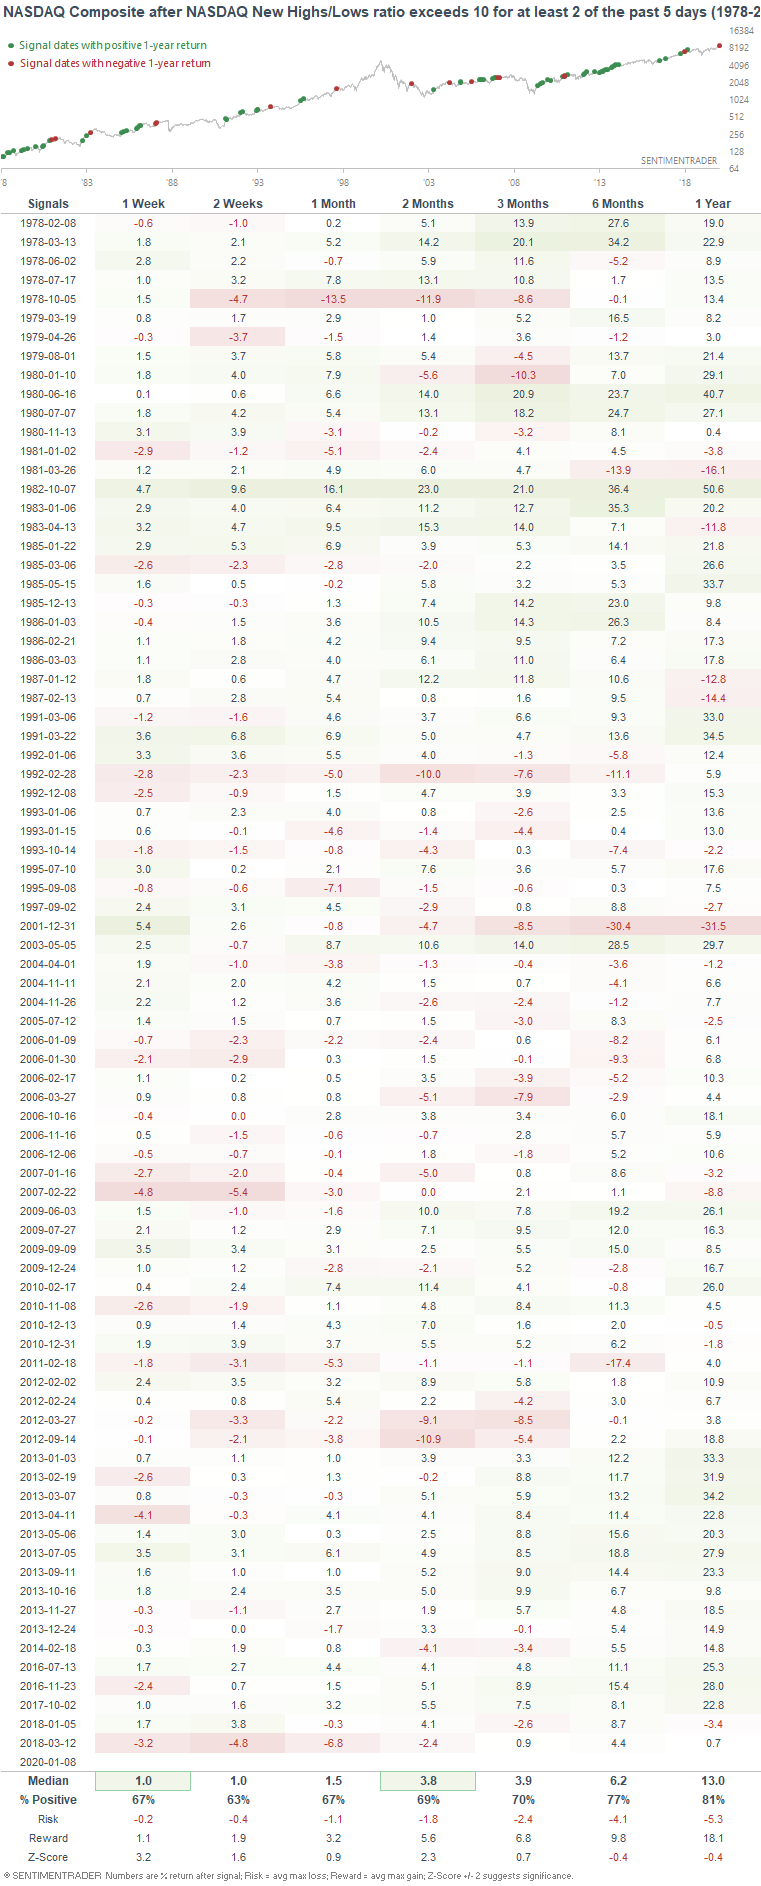
When breadth spiked twice in a week, the NASDAQ's returns over the next few weeks were slightly more bullish than random. We'll see if momentum can carry the day, and so far it has. The battle between momentum and sentiment continues, and momentum does not last forever.
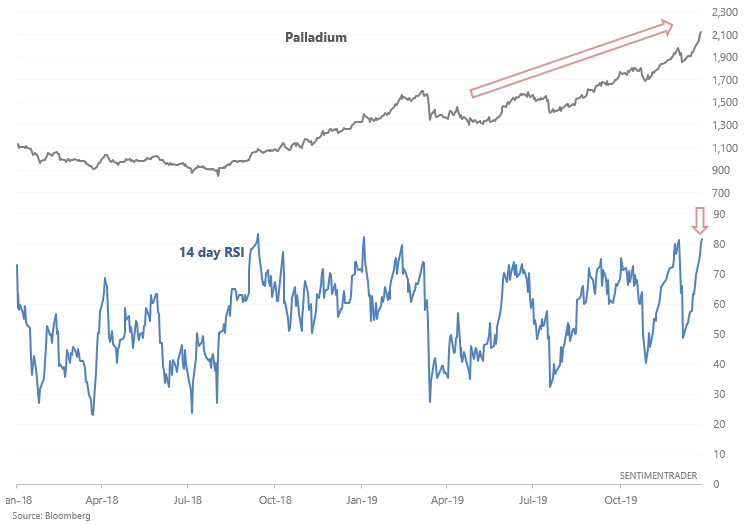
Palladium
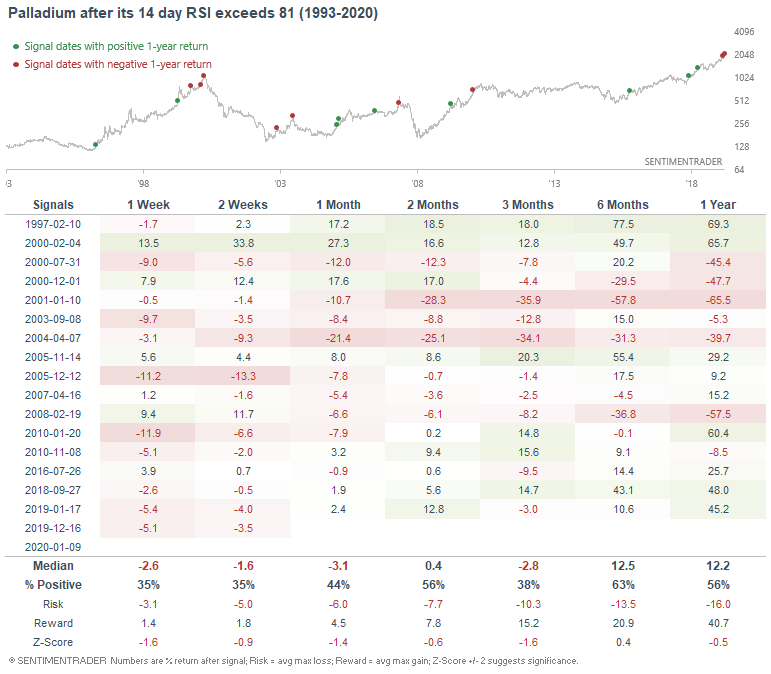
Palladium has soared over the past year due to supply constraints, pushing its 14 day RSI to an extremely high level.
When palladium was this overextended in the past, its returns over the next few weeks were consistently more bearish than random:
My trading portfolio
My trading portfolio is allocated 50% in the Macro Index Model and 50% in the Simple Trading Model With Fundamentals. At the moment I have instituted a discretionary override and gone 100% long bonds (instead of long stocks) due to the extreme nature of many of our core indicators, even though some of these core indicators aren't in the models.
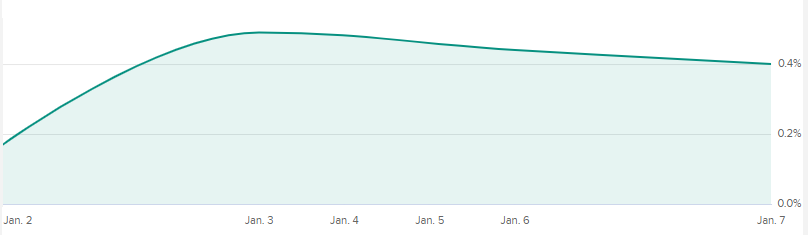
Performance in 2020 through to January 7, 2020:
- My trading account is up 0.4%
- Currently 100% in bonds