Data &
Technology
Research
Reports
Report Solutions
Reports Library
Actionable
Strategies
Free
Resources
Simple Backtest Calculator
Simple Seasonality Calculator
The Kelly Criterion Calculator
Sentiment Geo Map
Public Research Reports
Free Webinar
Pricing
Company
About
Meet Our Team
In the News
Testimonials
Client Success Stories
Contact
Log inLoginSign up
< BACK TO ALL REPORTS

What I'm looking at - maximum fear, safe haven day, maximum oversold, USD volatility, AAII

Troy Bombardia
2020-03-13
The stock market's crash yesterday was a once-in-a-generation event.

What I'm looking at:


Fear is at a maximum

Fear is at a maximum right now. The kind of selloff we witnessed on Thursday can only be compared to some of the worst crashes in market history: October 2008, 1987, and 1929-1932.

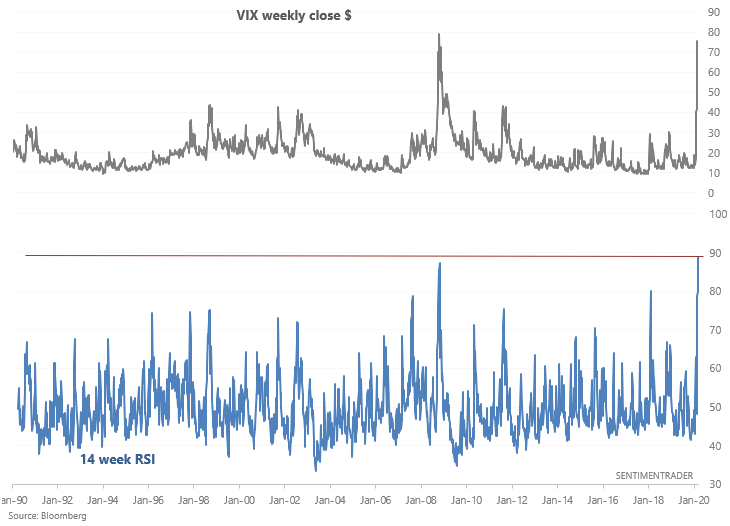
Here's a weekly chart for VIX using VIX's weekly CLOSE $:

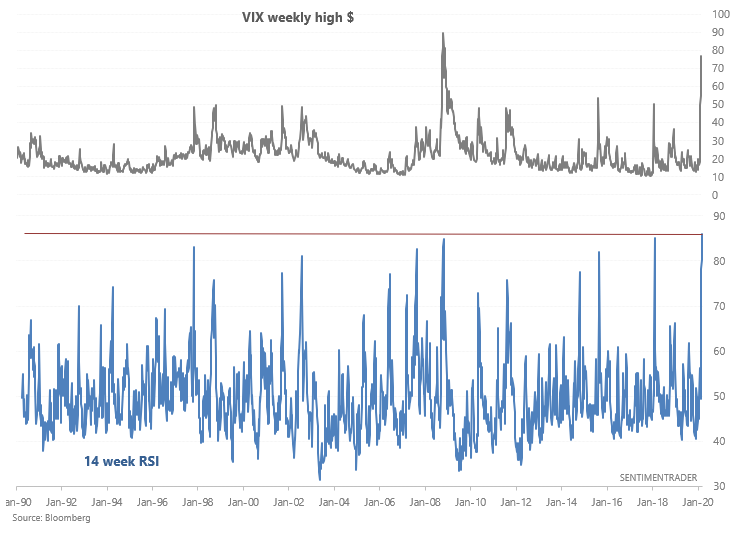
VIX's weekly RSI (using CLOSE $) is at 85, which is even higher than the worst of the 2008 crash. Granted, the week isn't over, so we'll have to use VIX's weekly HIGH $:

Here's what happened next to VIX after its weekly RSI exceeded 81:

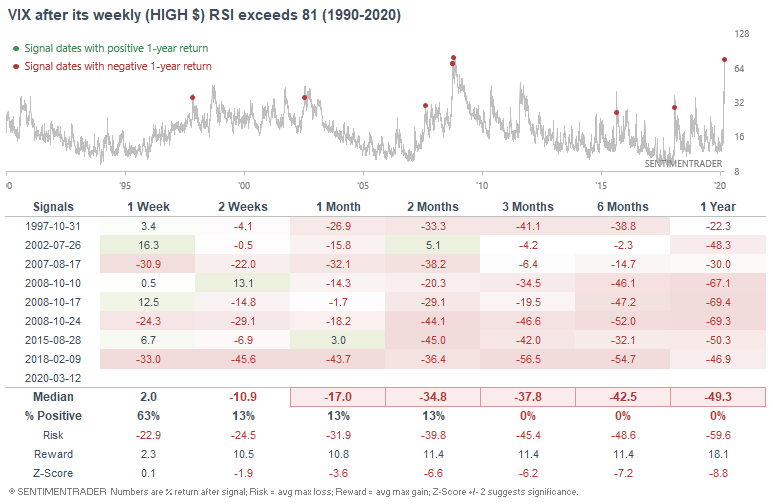
And here's what happened next to the S&P 500:

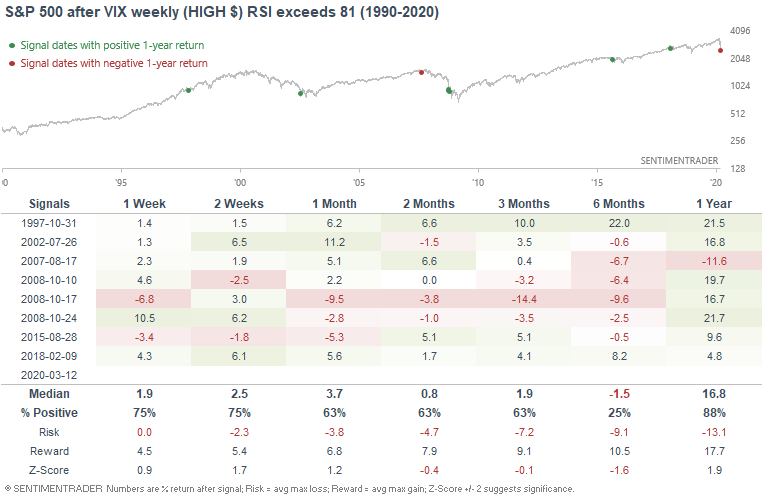
Overall, it's hard to imagine stocks going down much further. In times like this, it's better to focus on risk:reward than to try and catch the exact bottom.


Safe haven

Thursday's stock market crash was a pure safe haven day, in a way that can only be compared to 2008. Supposedly safe haven assets like gold and bonds fell, stocks tanked, and the USD went up. From 1983 - present this only happened during the worst of the 2008 crash:

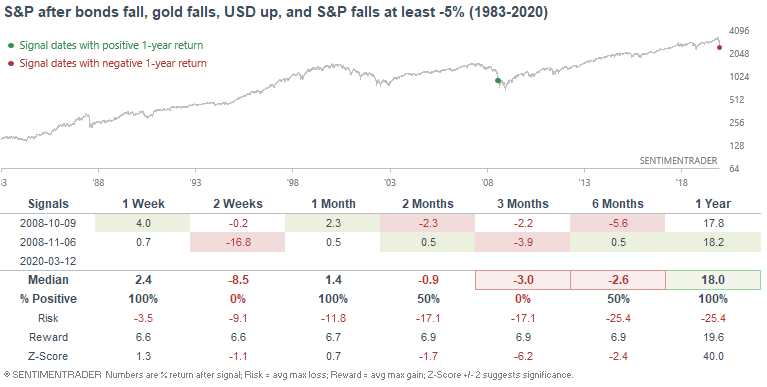
Back then, stocks were extremely volatile over the next few months, with massive rallies followed by massive retracements. But on a longer term basis, this was a terrific place to bet against the bearish crowd. Don't follow the herd.


Oversold

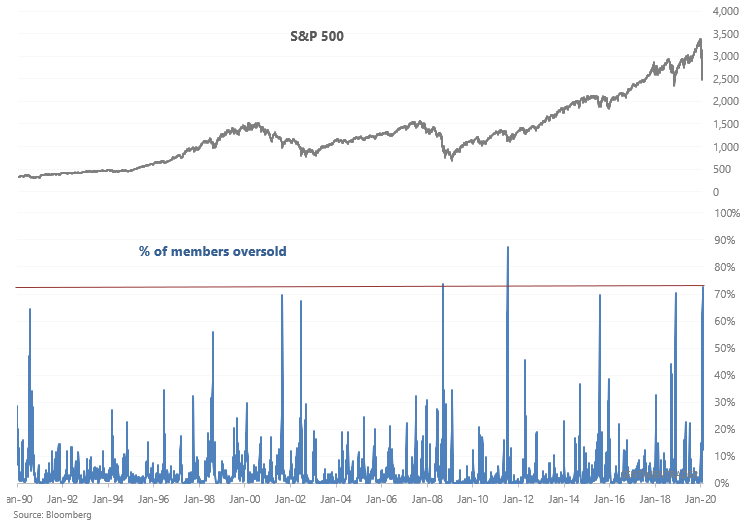
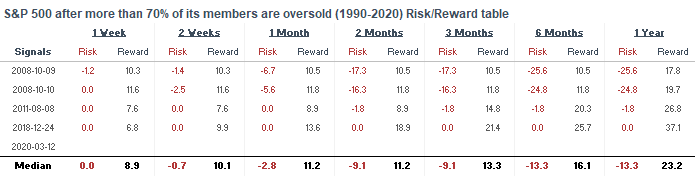
In another sign of extreme selling, 73% of the S&P 500's members are now oversold (RSI < 30). Such indiscriminate selling was only matched by October 2008 and the August 2011 crash:

When so many equities crashed at the same time in the past, the S&P 500 often rallied immediately and sharply:

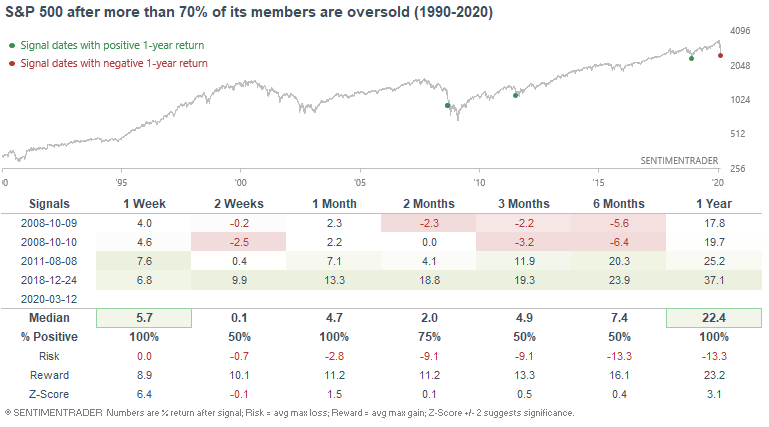
Here's the S&P 500's risk:reward table:

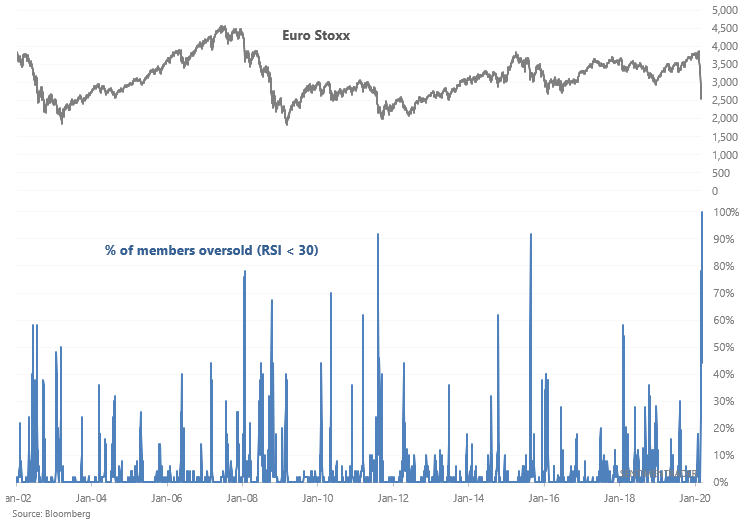
Over in Europe, the 100% of Euro Stoxx members are oversold. This has never happened before, not even during the height of the 2008 crisis:


USD Index

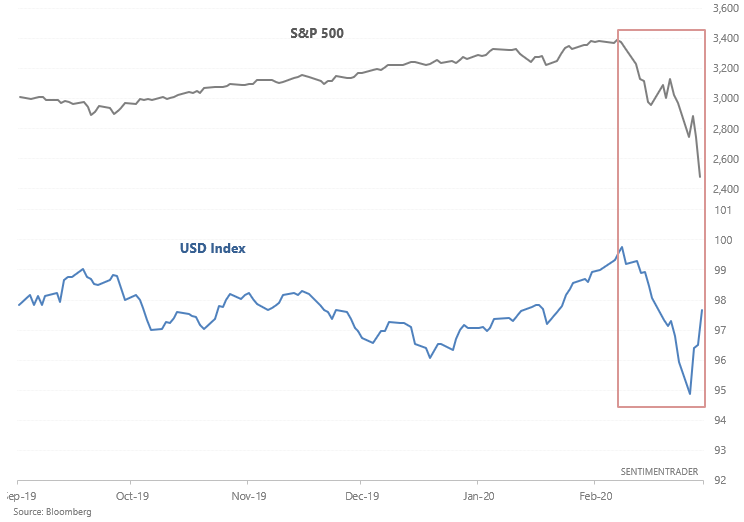
The U.S. Dollar Index has been extremely volatile of late, which is quite normal when global equities selloff and investors rush towards safe havens. (Go from "cash is trash" to "cash is king").

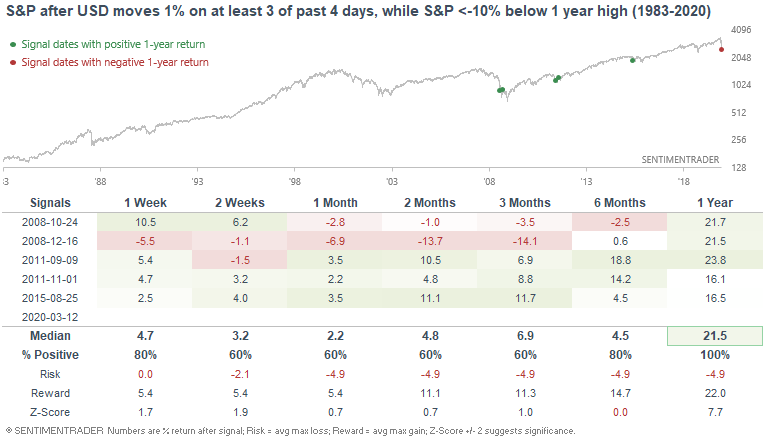
3 of the past 4 days have seen the U.S. Dollar Index move at least 1% (up or down), while the S&P 500 is far below its 1 year high. The only similar historical cases all saw the S&P 500 surge over the next year:


AAII

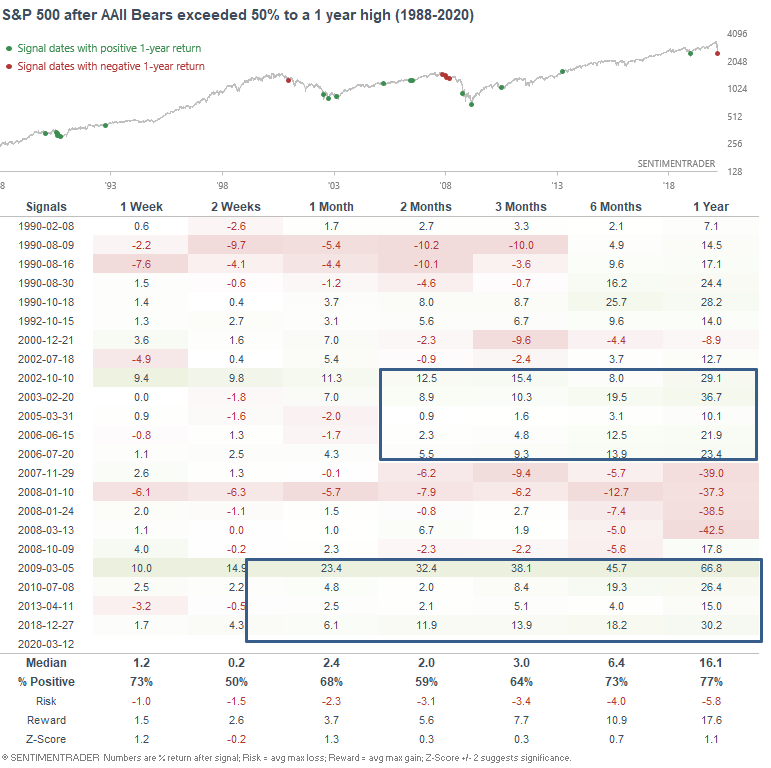
And finally, AAII Bearish % has risen above 50%, a level which in this bull market marked many significant bottoms (the last one being December 2018)

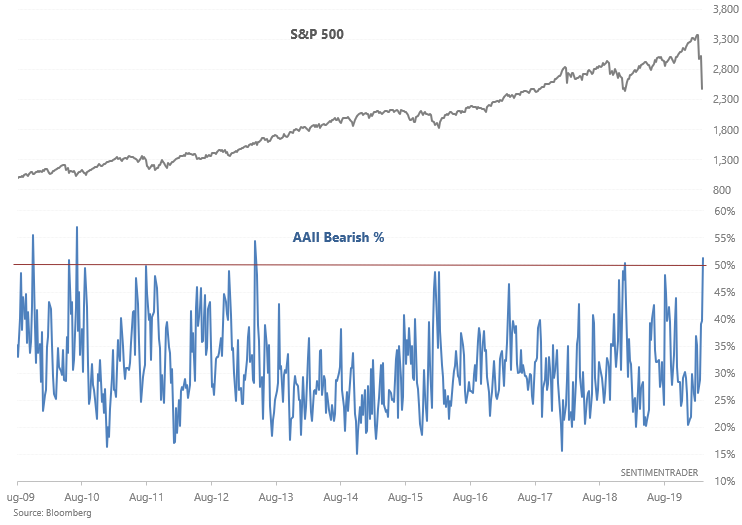
But if we look at every case in which AAII Bears exceeded 50%, it wasn't a clear bullish sign. This was bullish during bull markets, and not consistently bullish during bear markets:

Sorry, you don't have access to this report

Upgrade your subscription plan to get access
Go to Dasboard
DATA &
TECHnologies
IndicatorEdge
‍
BackTestEdge
‍
Other Tools
‍
DataEdge API
RESEARCH
reports
Research Solution
‍
Reports Library
‍
actionable
Strategies
Trading Strategies
‍
Smart Stock Scanner
‍
FREE
RESOUrCES
Simple Backtest
Calculator
Simple Seasonality
Calculator
The Kelly Criterion
Calculator
Sentiment Geo Map
‍
Public Research Reports
‍
Free Webinar
COMPANY
‍
About
‍
Meet our Team
‍
In the News
‍
Testimonials
‍
Client Success Stories
Pricing
Bundle pricing
‍
Announcements
‍
FAQ
© 2024 Sundial Capital Research Inc. All rights reserved.
Setsail Marketing
TermsPrivacyAffiliate Program
Risk Disclosure: Futures and forex trading contains substantial risk and is not for every investor. An investor could potentially lose all or more than the initial investment. Risk capital is money that can be lost without jeopardizing ones’ financial security or life style. Only risk capital should be used for trading and only those with sufficient risk capital should consider trading. Past performance is not necessarily indicative of future results.

Hypothetical Performance Disclosure: Hypothetical performance results have many inherent limitations, some of which are described below. No representation is being made that any account will or is likely to achieve profits or losses similar to those shown; in fact, there are frequently sharp differences between hypothetical performance results and the actual results subsequently achieved by any particular trading program. One of the limitations of hypothetical performance results is that they are generally prepared with the benefit of hindsight. In addition, hypothetical trading does not involve financial risk, and no hypothetical trading record can completely account for the impact of financial risk of actual trading. for example, the ability to withstand losses or to adhere to a particular trading program in spite of trading losses are material points which can also adversely affect actual trading results. There are numerous other factors related to the markets in general or to the implementation of any specific trading program which cannot be fully accounted for in the preparation of hypothetical performance results and all which can adversely affect trading results.

Testimonial Disclosure: Testimonials appearing on this website may not be representative of other clients or customers and is not a guarantee of future performance or success.