
What I'm looking at - manufacturing still weak, housing recovery?, bearish tops, NASDAQ breadth, new highs
With the stock market hovering near all-time highs, here's what I'm looking at:
U.S. manufacturing still weak
As I've said over the past month, U.S. manufacturing remains weak. ISM Manufacturing is below 50 (contraction), and Industrial Production's YoY % change has now fallen below 0.4%
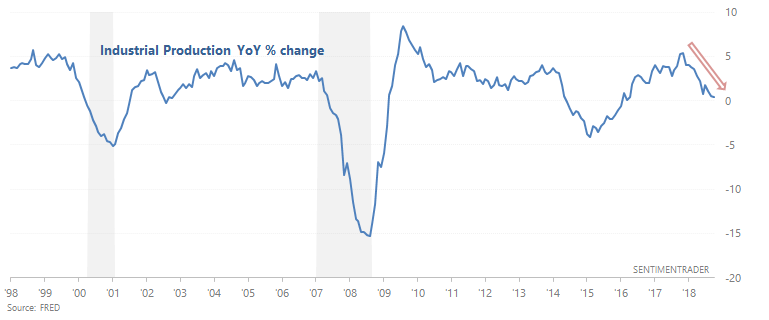
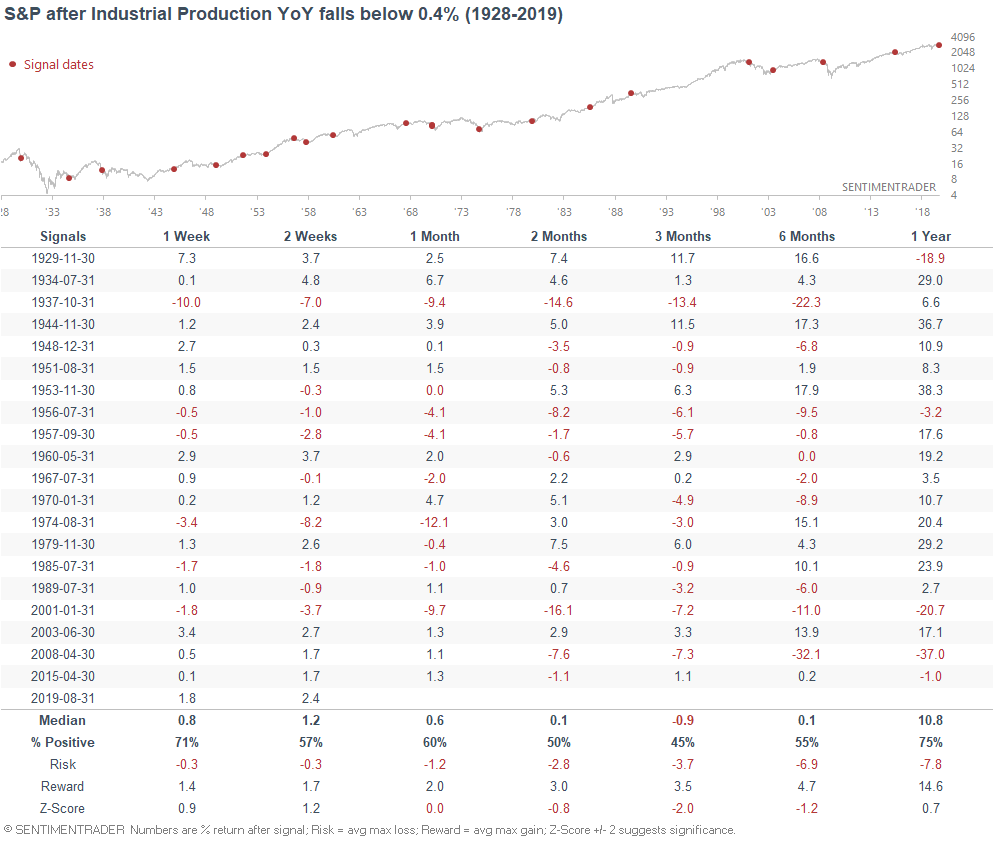
On its own, YoY Industrial Production that comes below 0.4% is more bearish than random for stocks over the next 3 months:
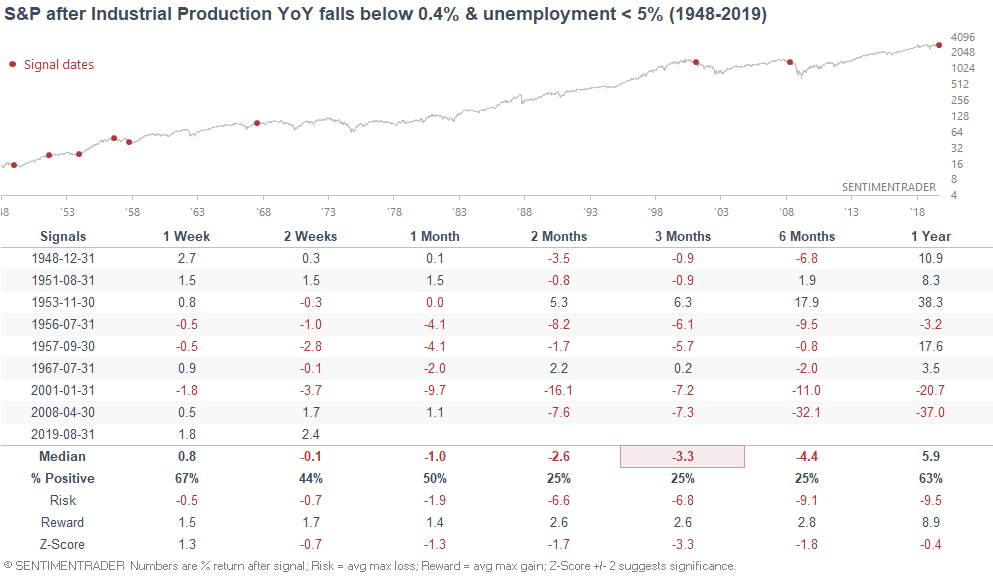
And if you isolate for the late-cycle cases (i.e. Unemployment is also under 5%), the S&P's 3 month forward returns were even worse than random.
Overall, manufacturing remains a bearish factor for macro (this will be reflected in the Macro Index for next month). However, no data point (especially a fundamental data point) should be taken in isolation. Otherwise you will end up confirming your bias. I.e. if you're very bullish, you'll focus the few data points that are extremely bullish. If you're very bearish, you'll focus on the few data points that are extremely bearish.
Housing recovery?
One of the reasons why the Macro Index was bearish late-2018 was because of sustained and significant housing weakness. This continues to be somewhat of a concern, but is becoming less so. For example, the NAHB Housing Market Index has climbed to a 1 year high.
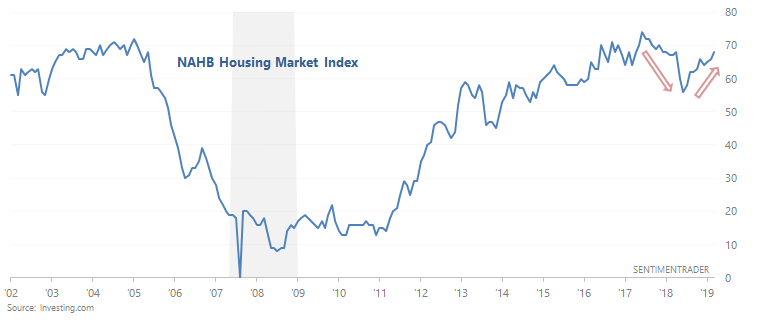
The turnaround in housing is not yet clear, because other housing indicators like Building Permits are still trending downwards. Nevertheless, this is a positive step. The following table illustrates what happened next to the S&P when the NAHB Housing Market Index reached a 1 year high.
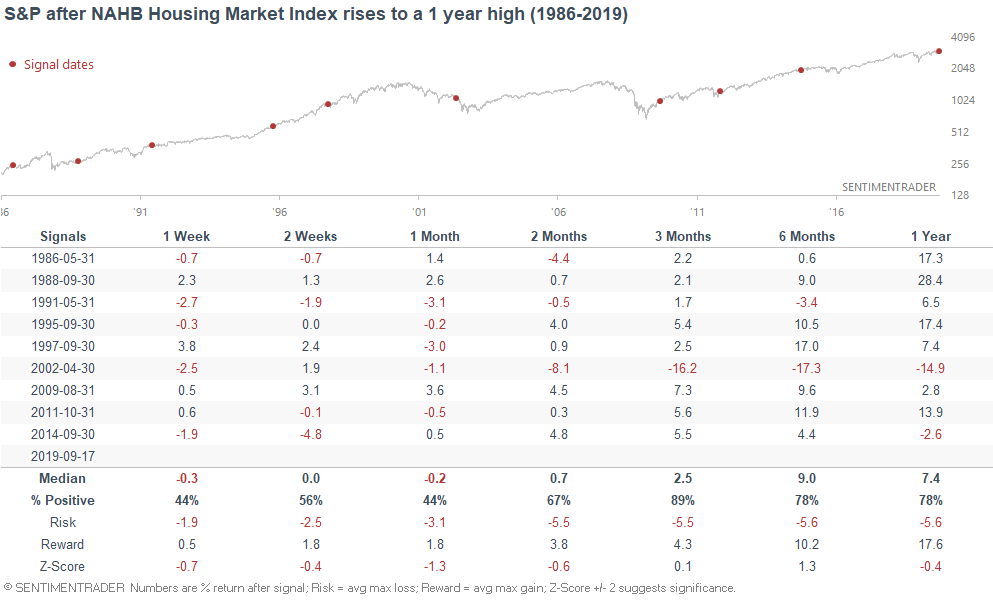
As you can see, the S&P's 3 month forward returns are more bullish than random. The 1 big loss case came towards the end of a big bear market. (That bear market was interesting, because the recession ended long before the bear market ended. Recessions usually end after bear markets end. And whereas most bear markets see sustained weakness in housing, housing was relatively strong in the 2000-2002 bear market).
This stat directly contradicts the previous manufacturing stat, which was bearish for the S&P over the next 3 months. This is why economic data should not be taken in isolation.
Stocks & yields
One of the most oft-cited reasons to be bearish is that the stock market has "gone nowhere" since January 2018. As a result, there have been plenty of calls for a head and shoulders, flat top, double top, triple top, megaphone, etc over the past 1.5 years.
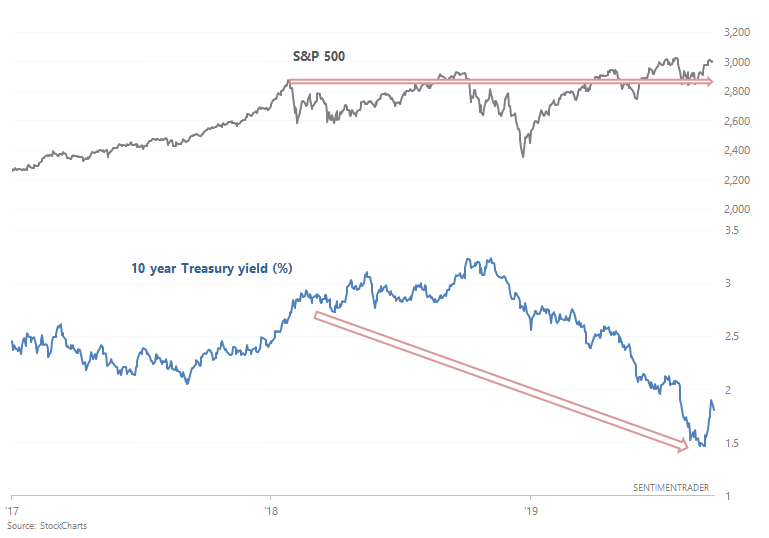
What surprises people even more is that stocks have mostly gone nowhere despite Treasury yields falling significantly. At least according to theory, falling interest rates should stimulate the economy and stock prices.
The following table looks at every case in which the S&P's 12 month change was less than +1%, while the 10 year Treasury yield fell at least -1%
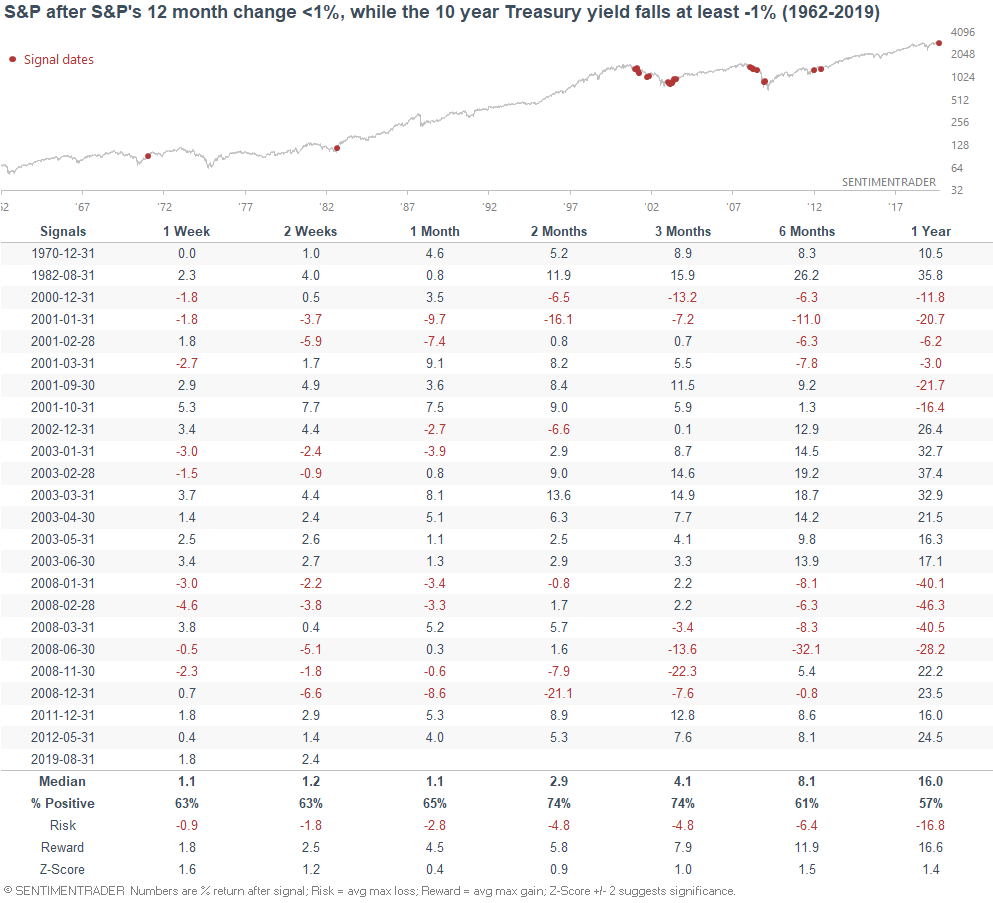
Many of the historical cases are overlaps. So if we only look at the first case in 1 year:
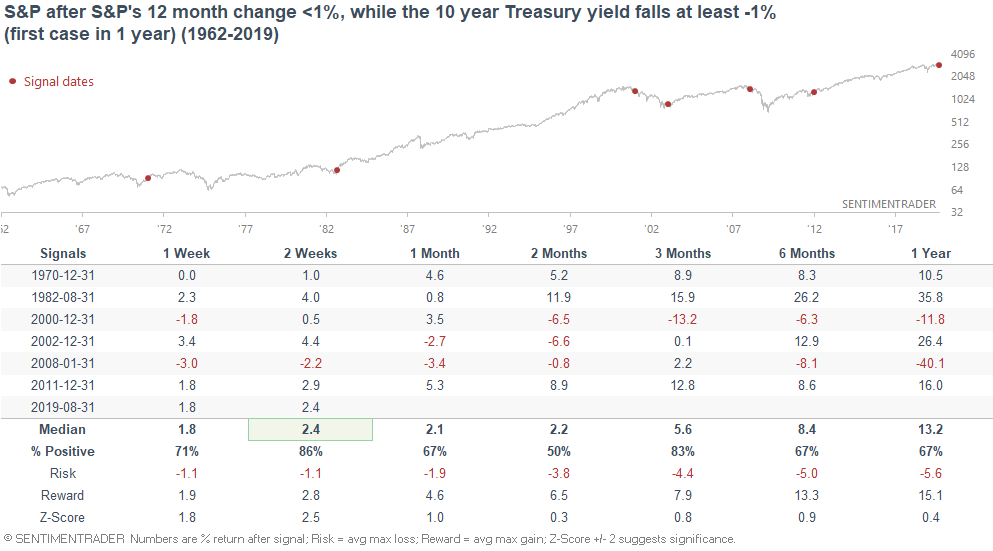
This did happen during the start of the 2000-2002 and 2007-2009 bear markets. But overall, this was not a consistently long term bearish factor for stocks. It is possible (although uncommon) for yields to tank and stocks to not rally significantly.
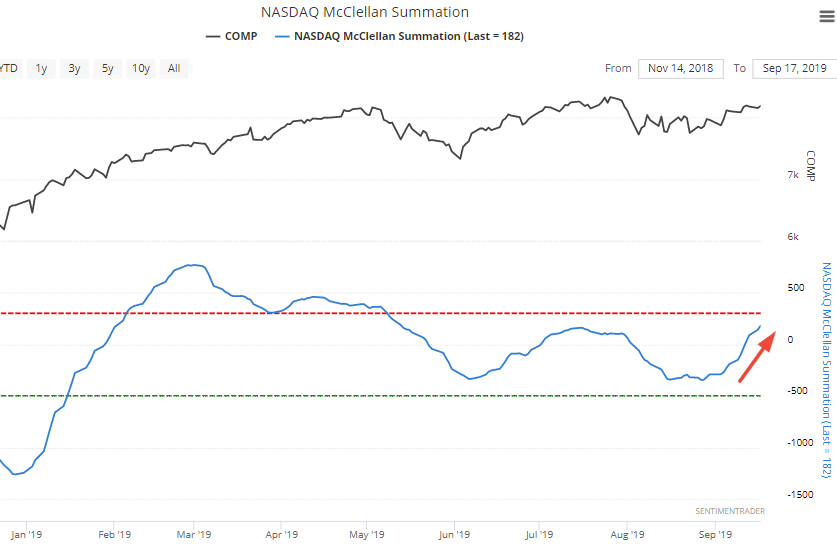
NASDAQ McClellan Summation
The NASDAQ McClellan Summation Index (long term breadth indicator) has made a new 4 month high.
When long term breadth broke out in the past, the NASDAQ often continued to rally over the next 2 weeks. But after that, this was not significantly more bullish for the NASDAQ than random. Even if we isolate for the cases that occurred while the NASDAQ was close to a 1 year high, the NASDAQ's 3-12 month forward returns are close to random.
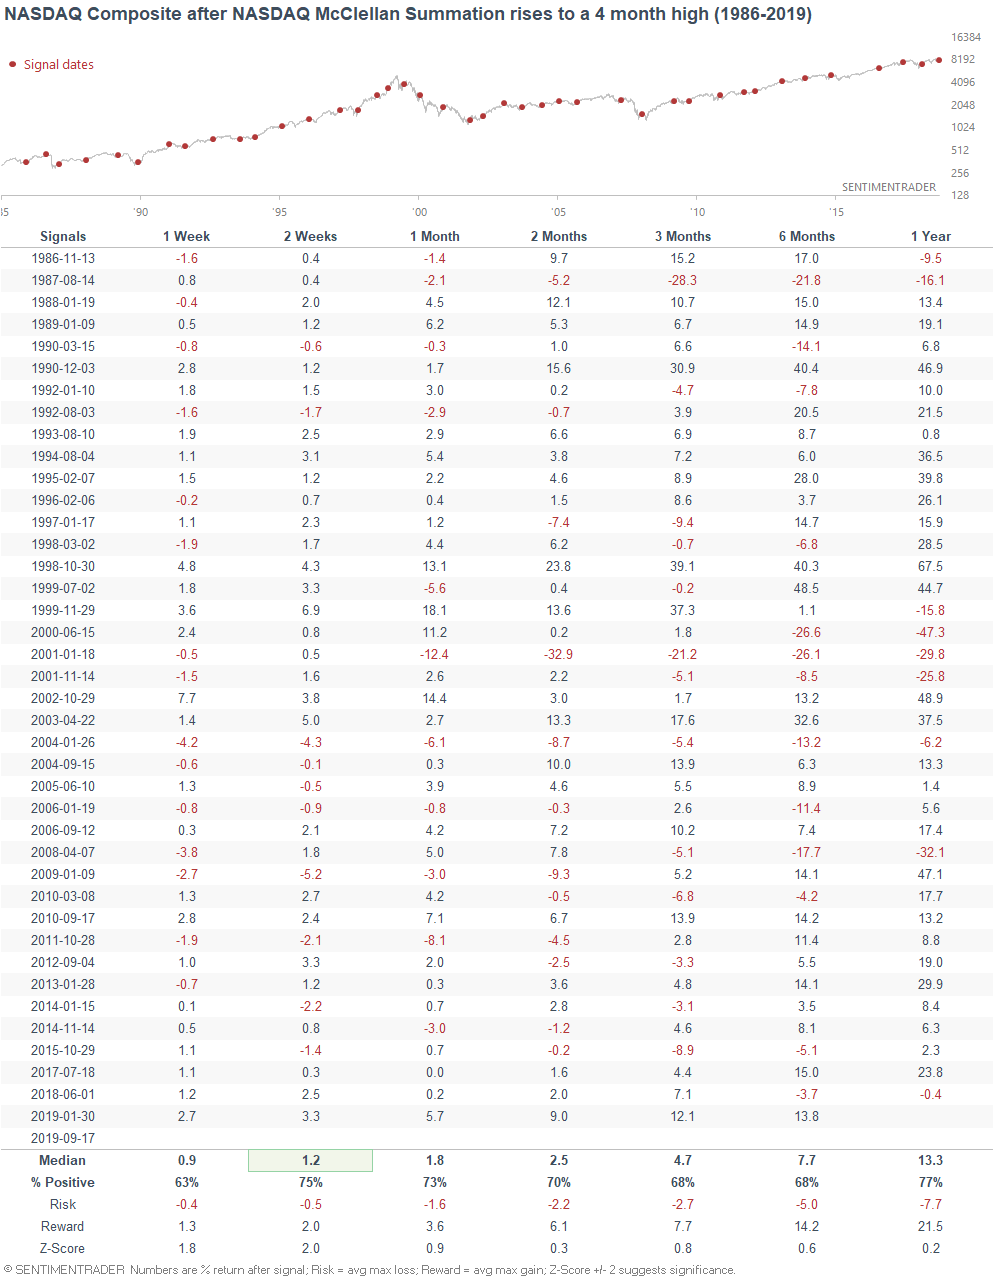
*I don't have a lot of confidence in short term predictions. Too many unpredictable factors can impact the market's short term direction, and short term stats often contradict eachother.
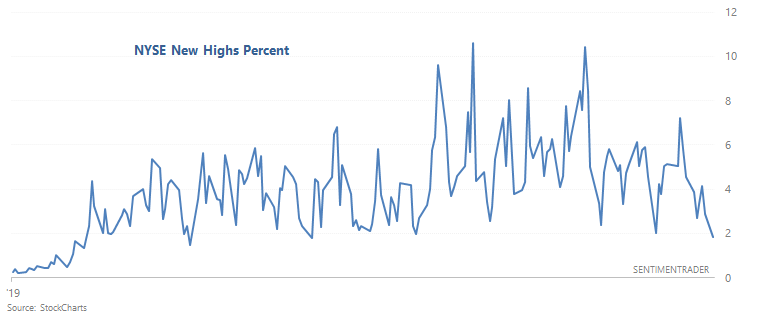
New Highs
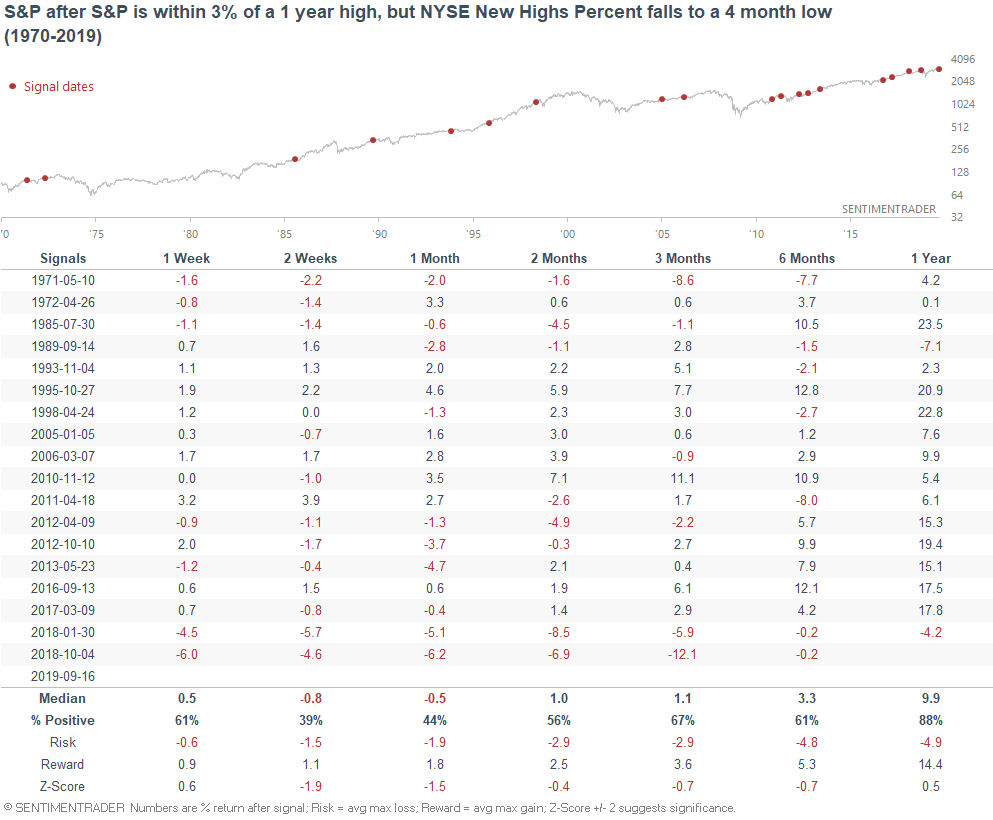
While breadth isn't bad, it's not all "good" either. Many traders have noted that while the U.S. stock market is approaching all-time highs, relatively few issues are making new 52 week highs.
While this is a slight bearish concern for stocks over the next 2 weeks, it hasn't been a consistently long term (1 year) bearish factor for the stock market.
Conclusion
From my weekend market overview:
- Long term risk:reward doesn’t favor bulls. Valuations are high, but valuations can remain high for years.
- Fundamentals (6-12 months): still bullish because there is no significant U.S. macro deterioration, but this could change IF macro data deteriorates significantly over the next few months
- Technicals (3-6 months): mostly bullish
- Technicals (1-2 months): no clear edge in either direction