
What I'm looking at: MACD breadth, time extreme, precious metal's momentum
Here's what I'm looking at:
MACD breadth
The U.S. stock market has swung up and down in recent sessions, causing the rally's momentum to lose steam. This has pushed the % of S&P 500 members with a MACD sell signal in the past 10 days to more than 34%:
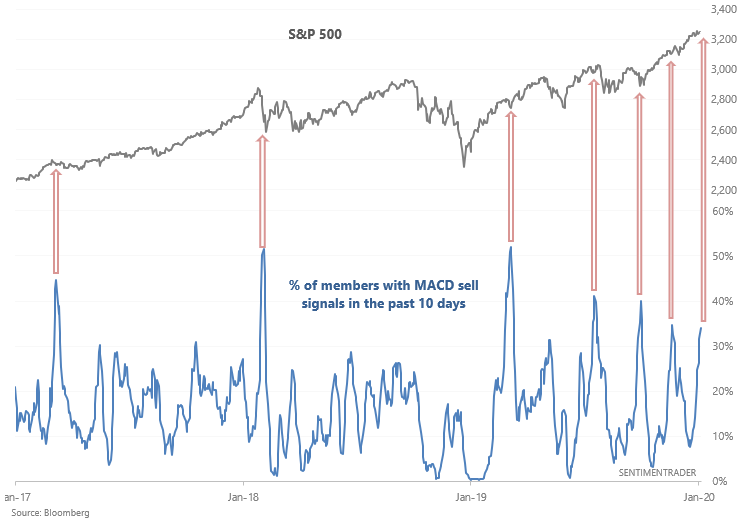
Such a signal has been decent at predicting stock market pullbacks from 2017-present. But not so much before that. The following table demonstrates what happened next to the S&P when this occurred in the past (1990-present)

Pullbacks over the next few weeks were inconsistent. On a 1 year forward basis, this was more bullish than bearish for U.S. equities.
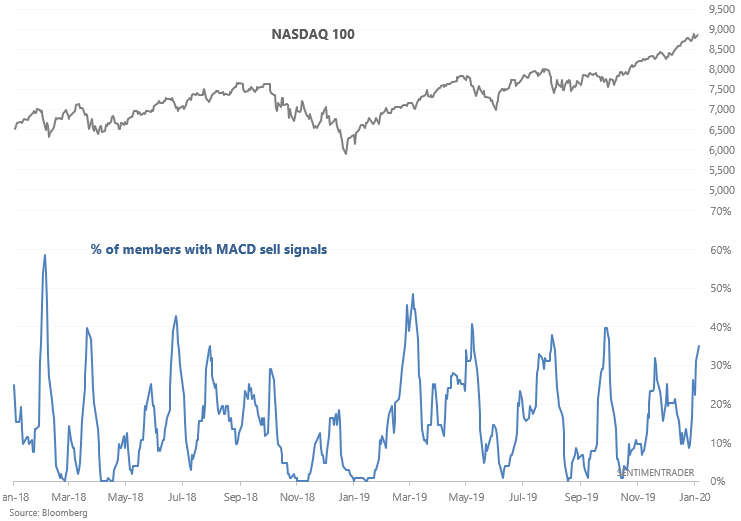
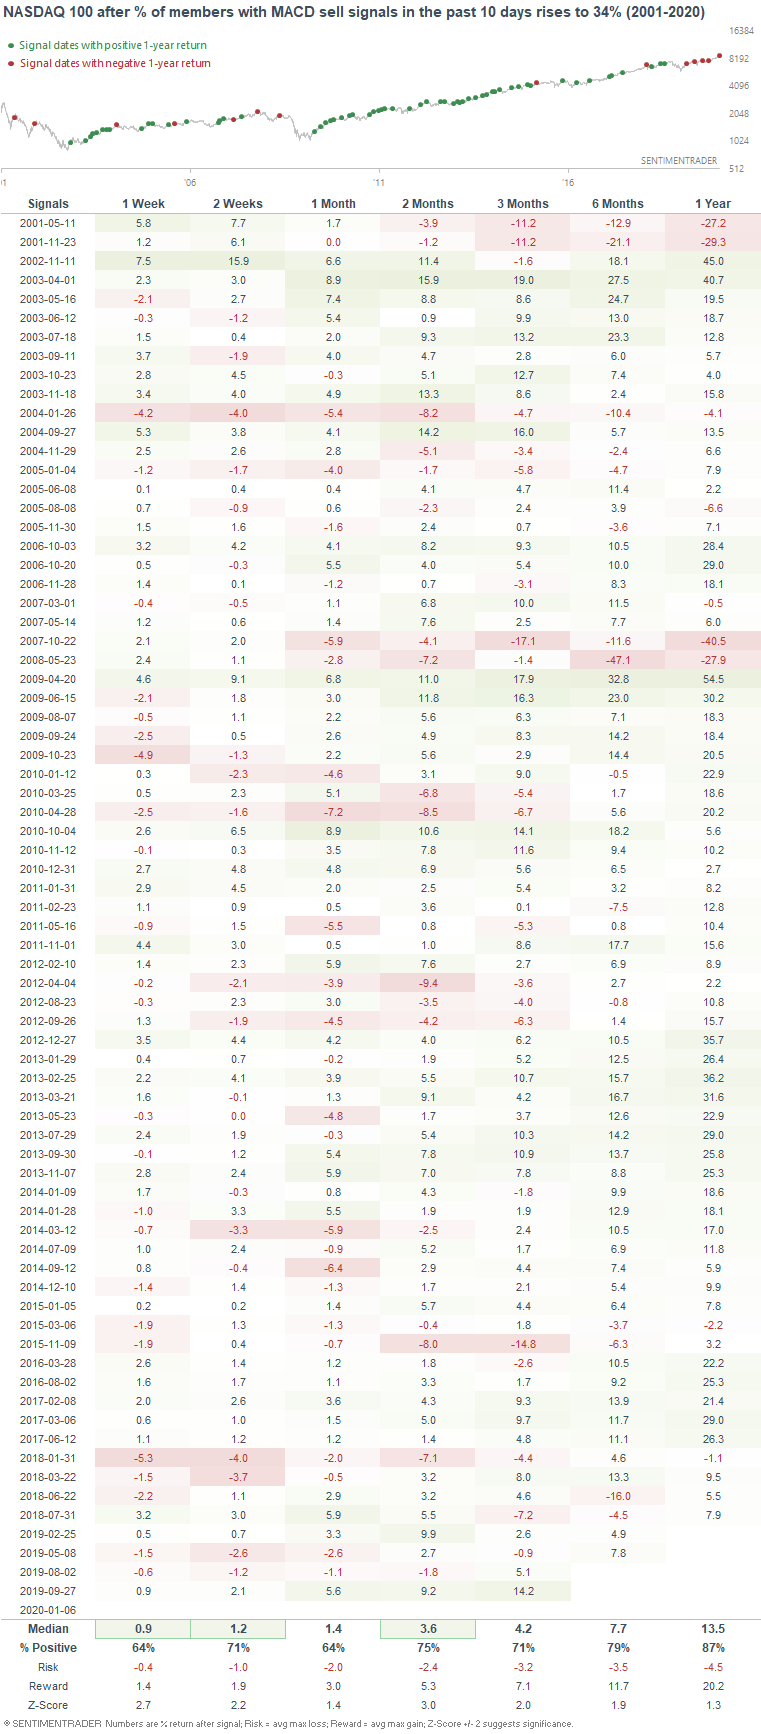
Similarly, the % of NASDAQ 100 members with MACD sell signals also increased to 34%. While this has been short term bearish since 2018, it wasn't consistently effective before that:
Long time without a correction?
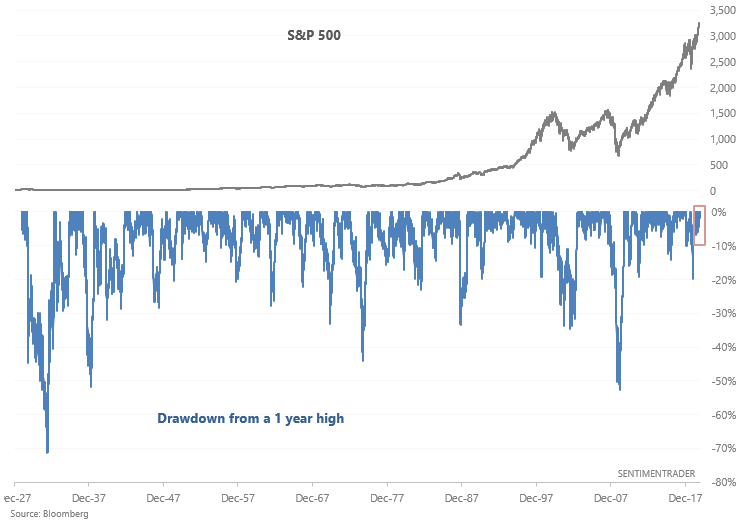
The past year has been fantastic for U.S. equities and there haven't been many sustained pullbacks (or even a correction).
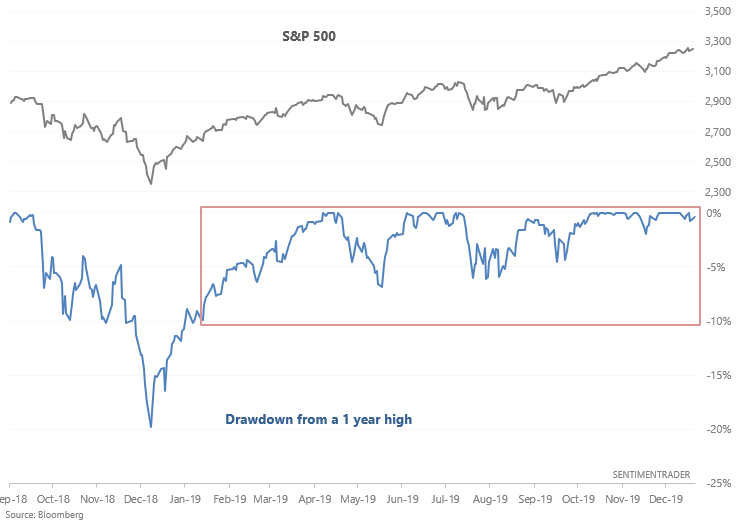
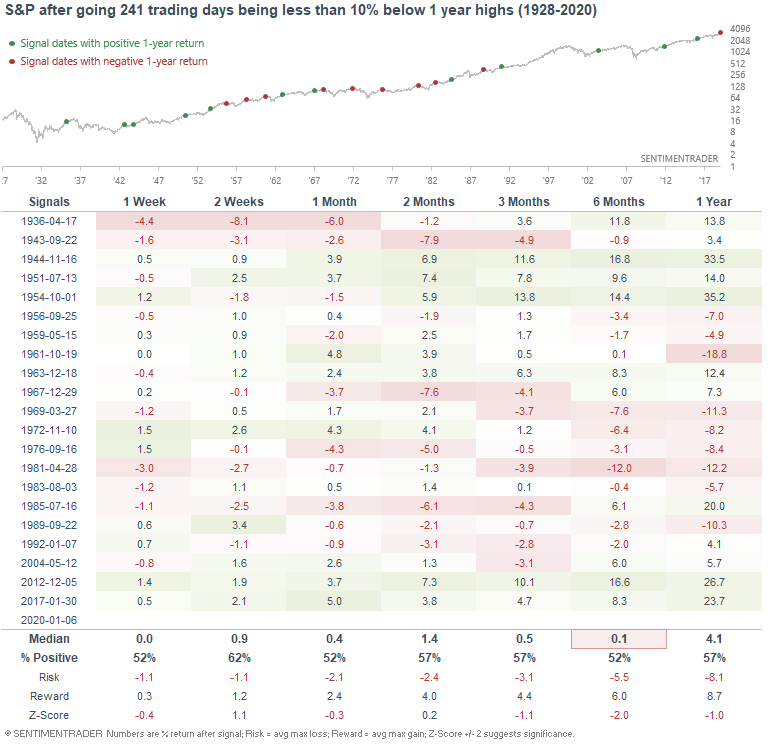
This marks 241 days without the S&P 500 being more than -10% below a 1 year high, which is quite a long streak:
When the stock market went this long without being in correction territory, its returns over the next 6 months were mixed and worse-than-random. After a great year for stocks, it's hard to imagine how the next 6 months would be as bullish as the past year. If stocks do rally, it will probably do so in a more choppy manner.
Gold
Gold's nonstop surge over the past few days has pushed its 14 day RSI to the highest level in years:
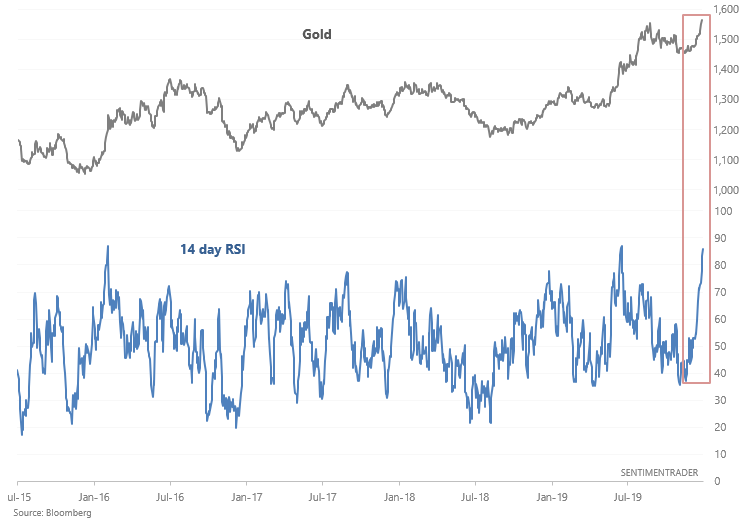
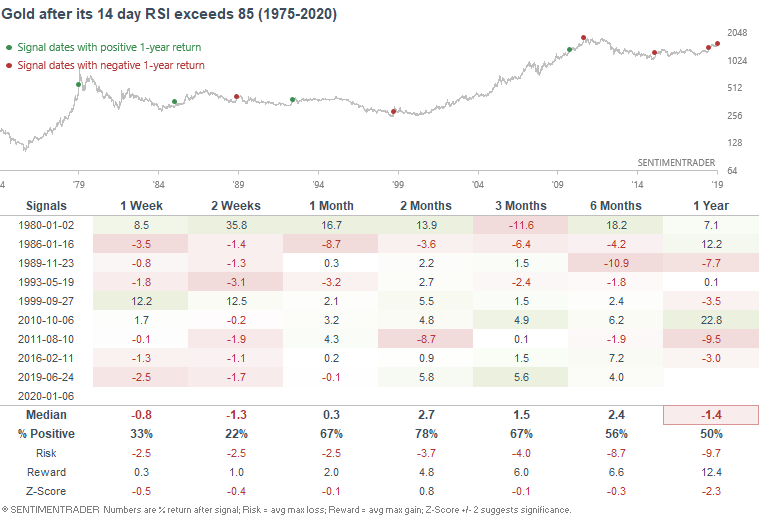
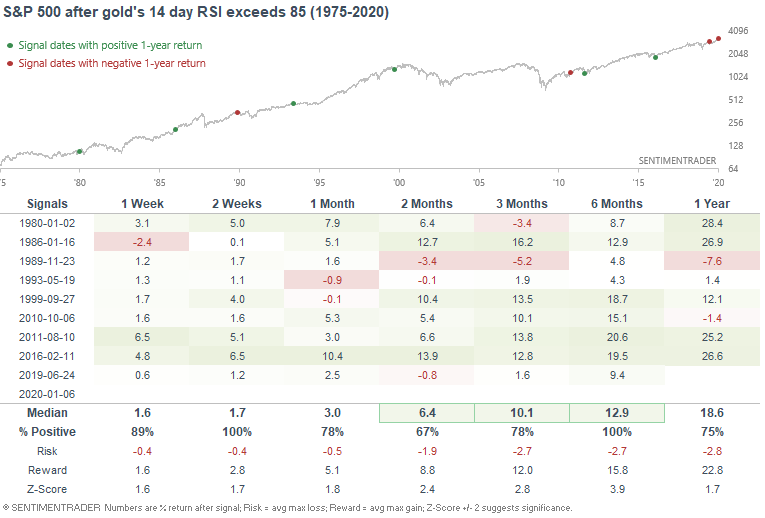
Such extreme momentum readings have only been matched 10 other times from 1975-present, and as one would expect it usually led to weakness over the next 1-2 weeks:
In the meantime, this usually led to gains for the S&P over the next 6 months:
Is this a valid reason to be bullish on U.S. equities? No. This is probably more of a coincidence.
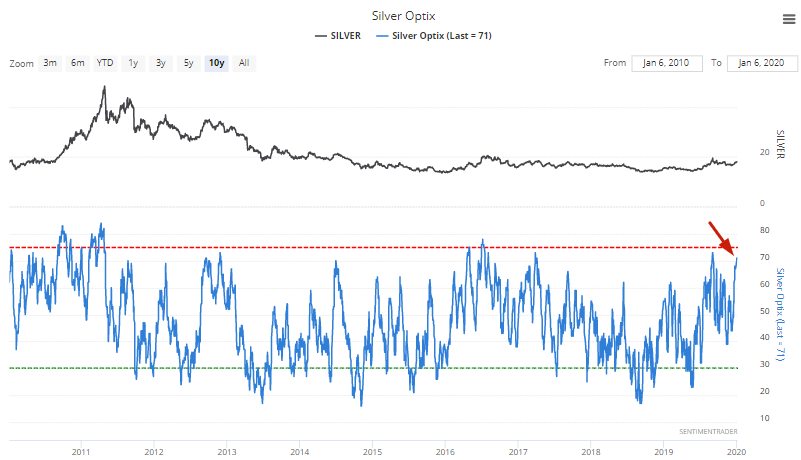
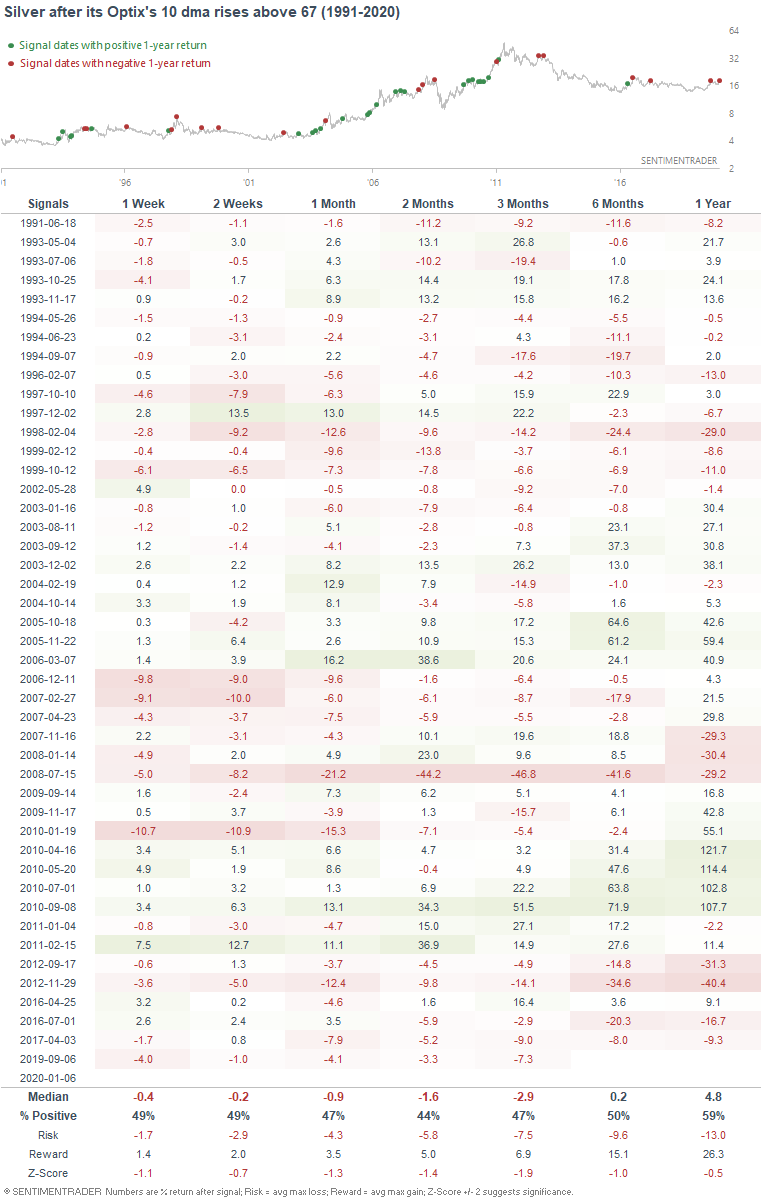
Silver's Optix has spiked as well, pushing the Optix's 10 dma above 67:
When this happened in the past, silver's returns over the next few weeks and months were worse than random:
My trading portfolio
My trading portfolio is allocated 50% in the Macro Index Model and 50% in the Simple Trading Model With Fundamentals. At the moment I have instituted a discretionary override and gone 100% long bonds (instead of long stocks) due to the extreme nature of many of our core indicators, even though some of these core indicators aren't in the models.
Year-to-date 2020:
- My trading account is up 0.49%
- Currently 100% in bonds